


On July 2, 2019, the NEO price reached a high of 171,814 satoshis. It has been on a gradual downtrend since. On July 17, it reached a low of 107,101 satoshis. Since then, it has been increasing.
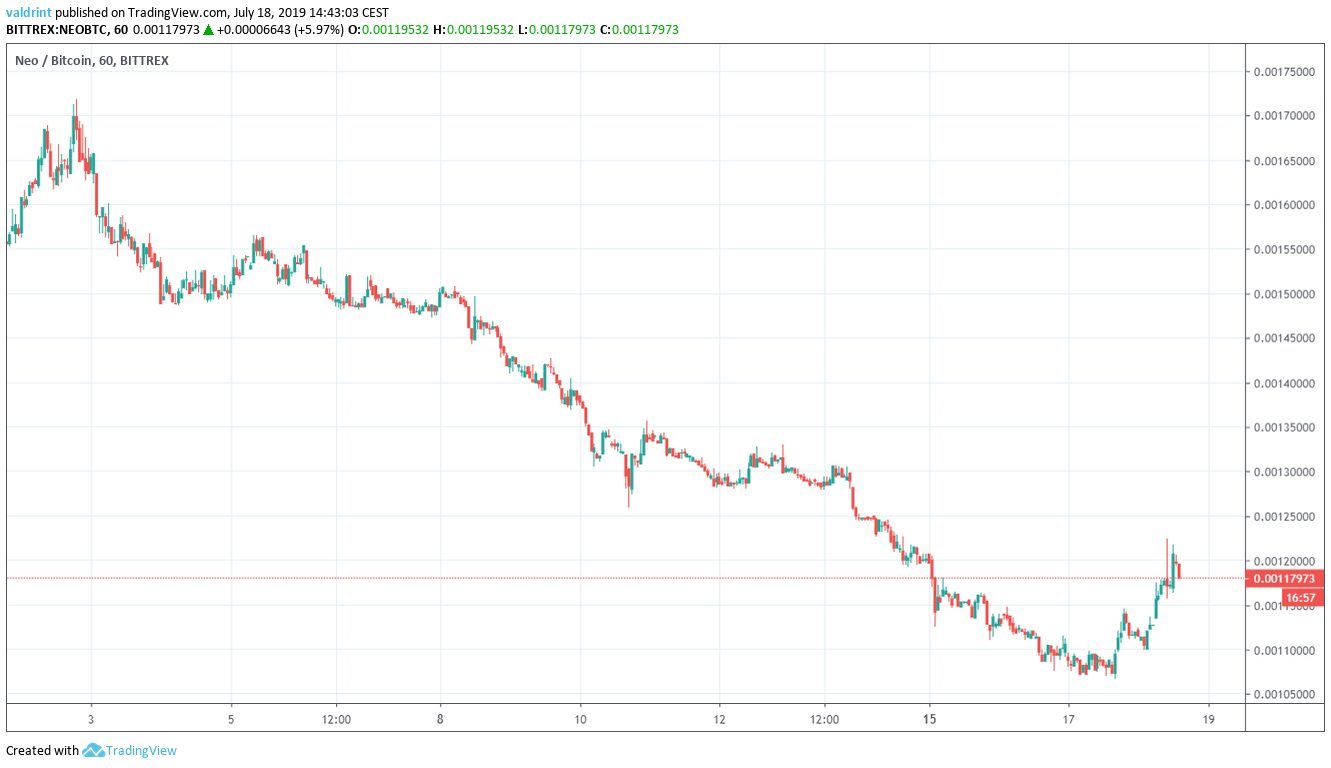
At the time of writing, it was trading near 120,000 satoshis.
Will it begin an upward move or are there further decreases in store for the NEO price? Keep reading below in order to find the answer.
If you would like to trade cryptocurrencies with a multiplier of up to 100x on our partner exchange, follow this link to sign up for free on StormGain.
NEO Price: Trends and Highlights for July 18
- NEO/BTC has been decreasing since the beginning of July.
- There is resistance at 127,000 satoshis.
- It is following a descending support line.
- Weekly and daily moving averages have made a bearish cross.
- There is bullish divergence developing in the RSI.
Resistance for the NEO Price
A look at the six-hour time-frame shows that gives us one resistance area that is attempting to bring an end to the current rally.
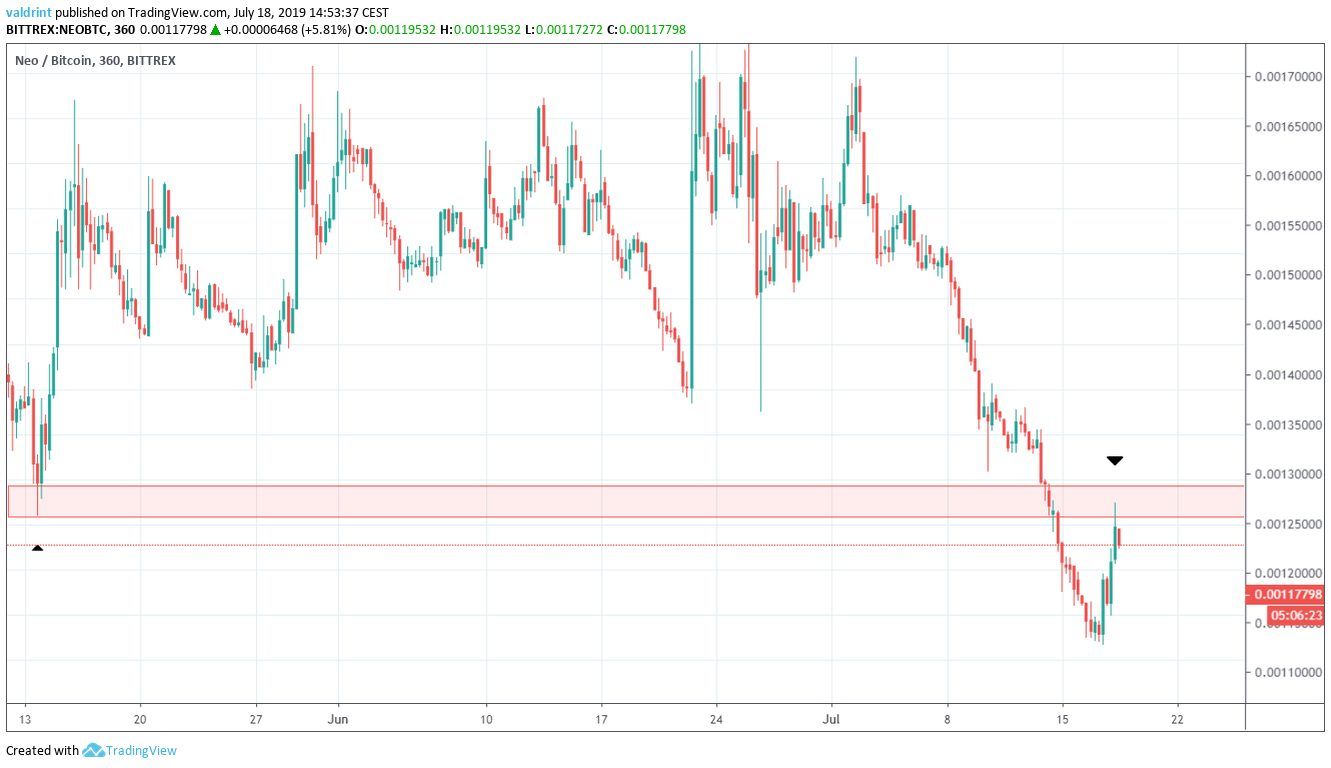
This area previously served as support on May 23. Since then, NEO has traded above it until the recent breakdown that began on July 10.
Once the NEO price reached this area, it immediately began to decrease — creating a long upper wick.
This is a sign of significant selling pressure.
In the short-term, the NEO price is not following a visible trading pattern.
Long-Term Support
A look at the daily time-frame shows that the NEO price has been following a descending support line since the beginning of December 2018.
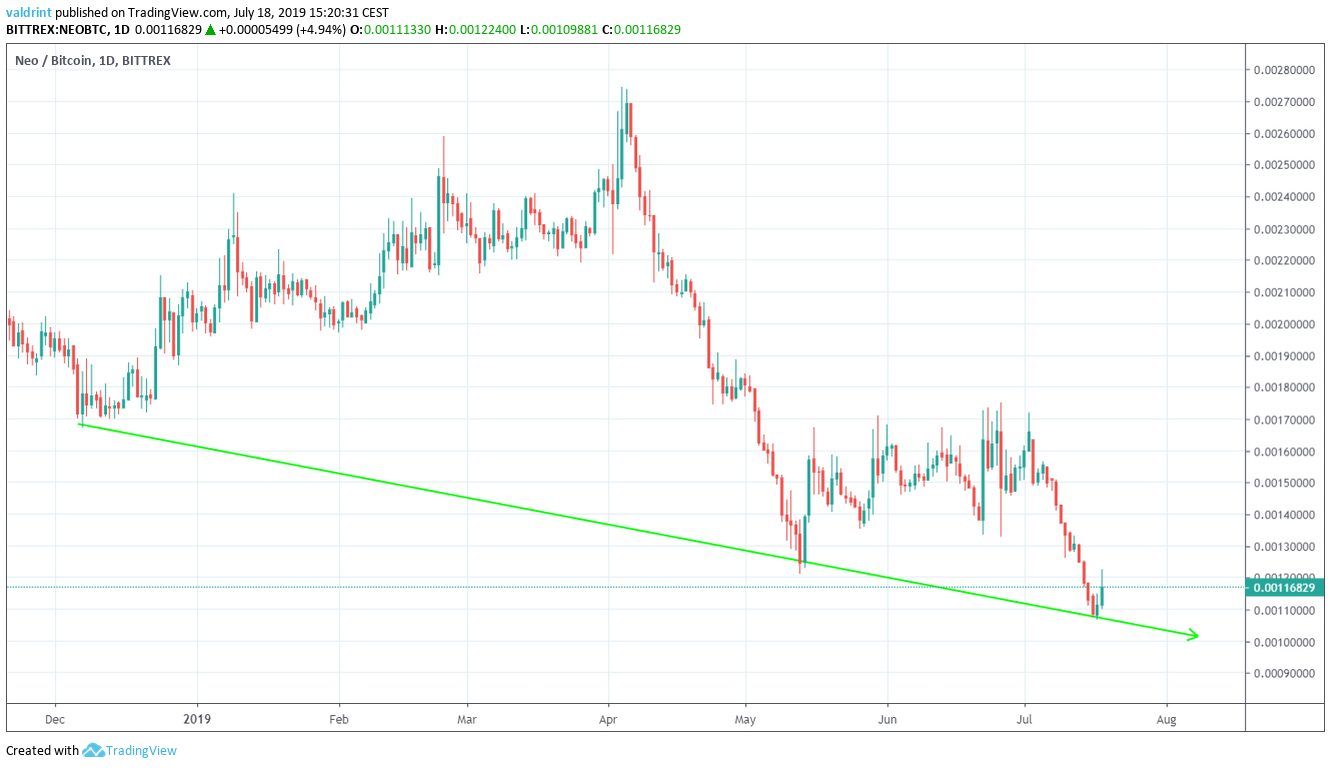
At the time of writing, the NEO price had just touched the support line for the third time.
The previous time it did so, on May 15, it began an upward move.
A look at the RSI suggests that the same thing might happen again.
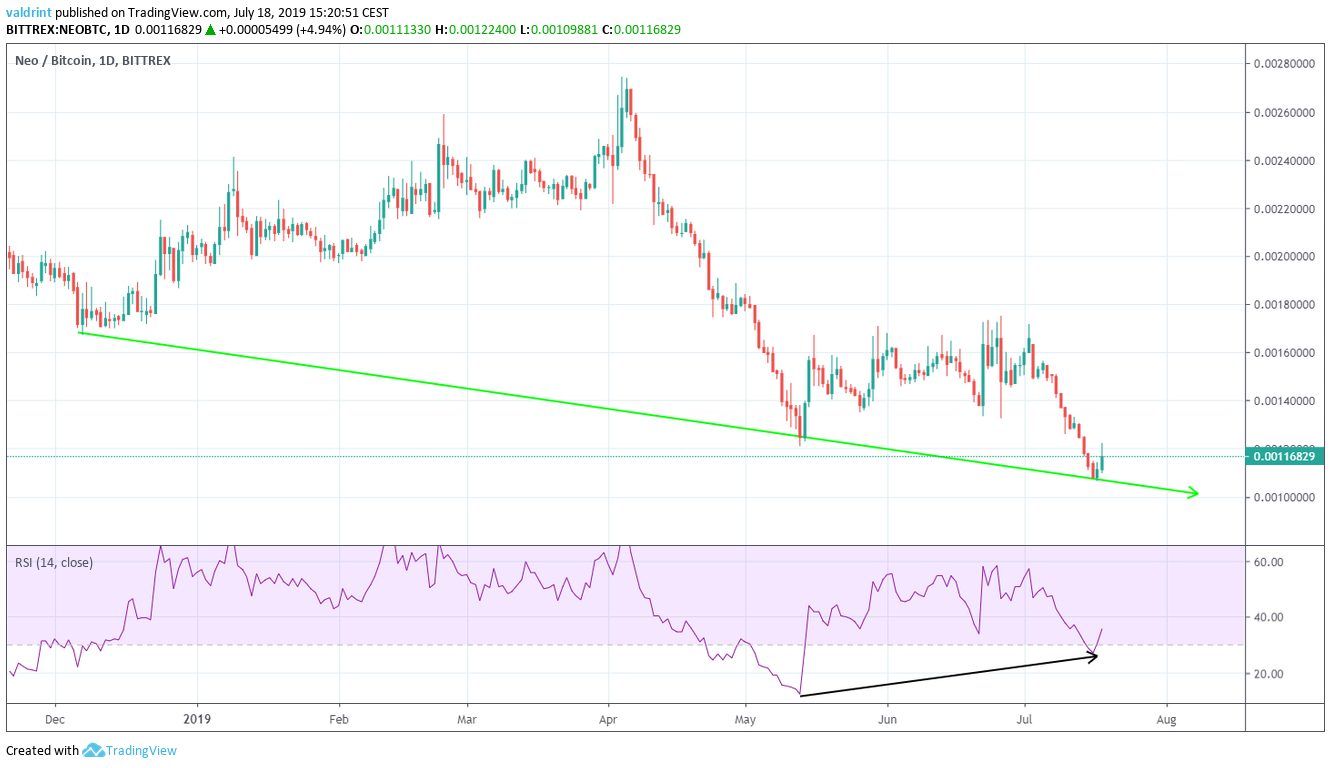
There has been significant bullish divergence developing in the RSI.
However, this divergence is not present in the MACD.
Will this be sufficient in initiating an upward move?
Let’s take a look at moving averages to see if that is likely.
The Downtrend May Continue
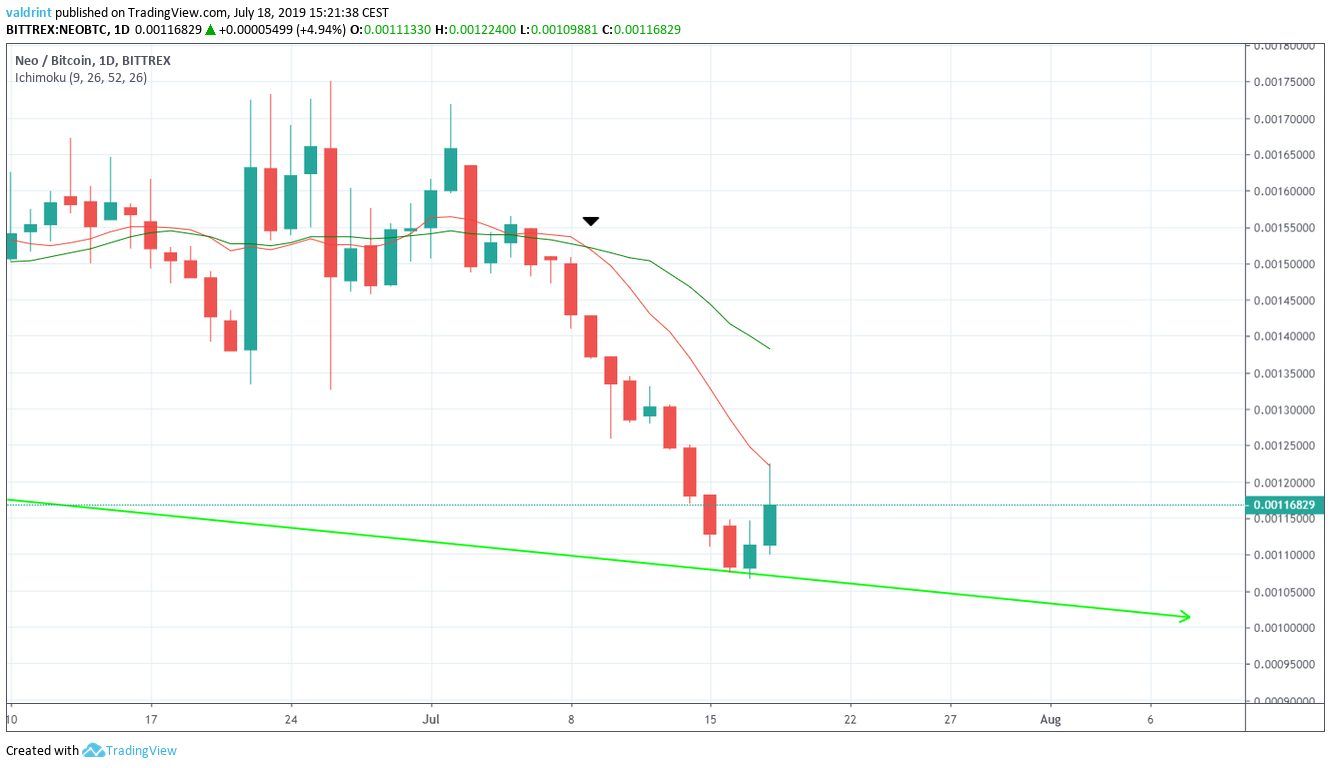
During the recent increase, the NEO price reached the 10-day MA before decreasing rapidly.
This created a long upper wick, confirming the MA as resistance.
A look at the weekly MAs gives a similar outlook.
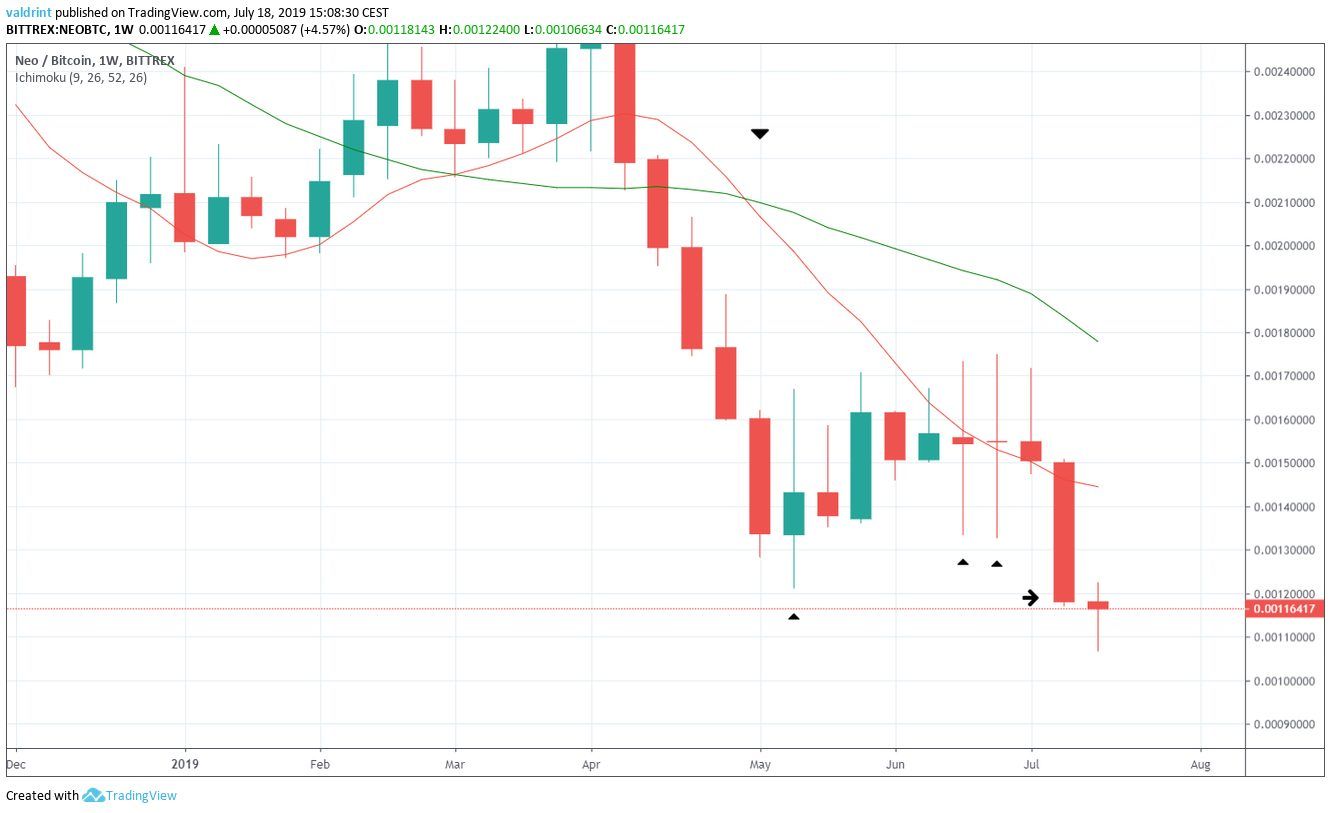
In the week of Apr 23-30, a bullish cross transpired between the 10- and 20-week MAs. This is often an indication that a downtrend has begun.
Since then, the NEO price has been trading below them, facing close resistance from the 10-week MA.
Also, there has been a bearish development in the period between May and July.
Candlesticks that reached values close to 130,000 satoshis were characterized by long lower wicks. This is a sign of buying pressure around that area.
However, it was all erased by the engulfing bearish candle in the week of July 8-15. During it, the NEO price closed below 120,000 satoshis — confirming the existence of a downtrend.
The bearish crosses that have transpired in different time-frames make us believe that if NEO begins an upward move, it will not be strong enough to clear the significant resistance above.
Rather, it is more likely that, eventually, it will touch the support line again.


