


The Monero (XMR) price has increased massively since its yearly low on June 10, barely retracing in the short term.
Even though the bullish trend reversal has not been confirmed yet, there are decisive signs in long- and short-term time frames that suggest the XMR price will continue increasing.
Monero Attempts Breakout From 665-Day Resistance
The weekly time frame analysis for XMR shows that the price has increased significantly since bouncing at the $130 horizontal support area (green icon) during the week of June 5 to 12.
This week, the price is breaking out from a long-term descending resistance line that has been in place for 665 days. A breakout from such a long-term structure would indicate that the previous correction is complete. However, the XMR price has yet to reach a close above this resistance line.
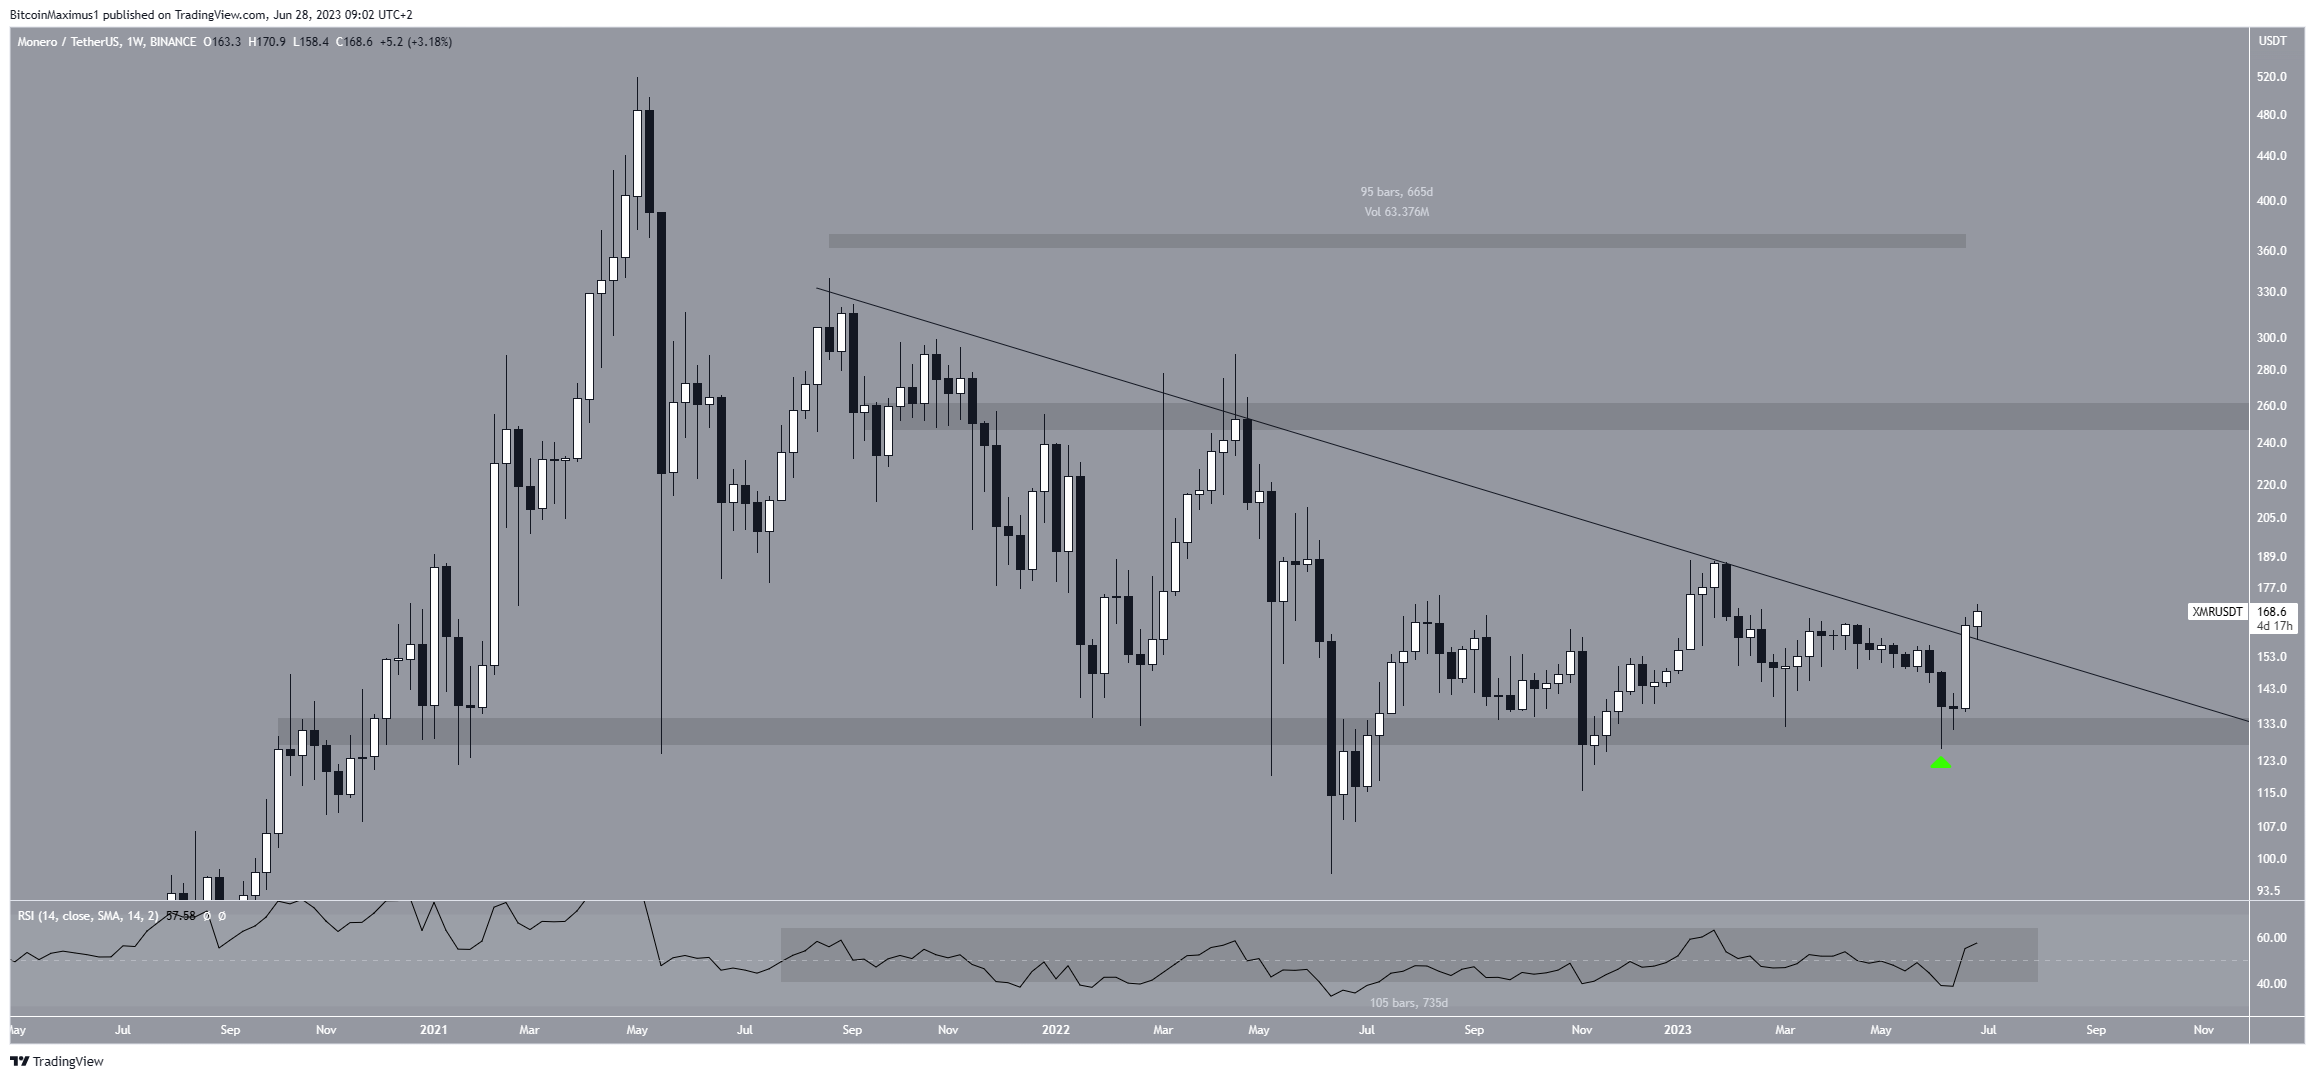
Despite this upward movement, the weekly RSI does not confirm the validity of the breakout. Traders utilize the RSI as a momentum indicator to assess whether a market is overbought or oversold and to determine whether to accumulate or sell an asset.
If the RSI reading is above 50 and the trend is upward, bulls still have an advantage, but if the reading is below 50, the opposite is true. Even though the RSI is slightly above 50, it has been freely moving above and below 50 (highlighted) since the middle of July 2021. This is considered a sign of an undetermined trend.
Read More: Best Crypto Sign-Up Bonuses in 2023
XMR Price Prediction: Is Monero Ready for Blast-Off?
While the weekly time frame readings are still undetermined, the daily time frame provides a decisively bullish outlook. There are several reasons for this.
Firstly, the XMR price has rapidly increased since its yearly low on June 10. So far, the price has increased by 34% without experiencing any retracement at all.
Secondly, the price of Monero broke out from a short-term descending resistance line that had previously been in place since Jan. 29. This is a sign that the short-term correction is complete.
It is also supported by the XMR price moving above the 0.618 Fib retracement resistance level at $164.
Fibonacci retracement levels operate on the principle that after a significant price change in one direction, the price will retrace or revisit a previous price level before resuming in its original direction.
Additionally, they can be employed to identify the highest point of future upward movements. The 0.618 level most commonly acts as resistance once the price retraces to it. So, its reclaim is a decisively bullish sign.
Finally, the daily RSI is above 50 and increasing.
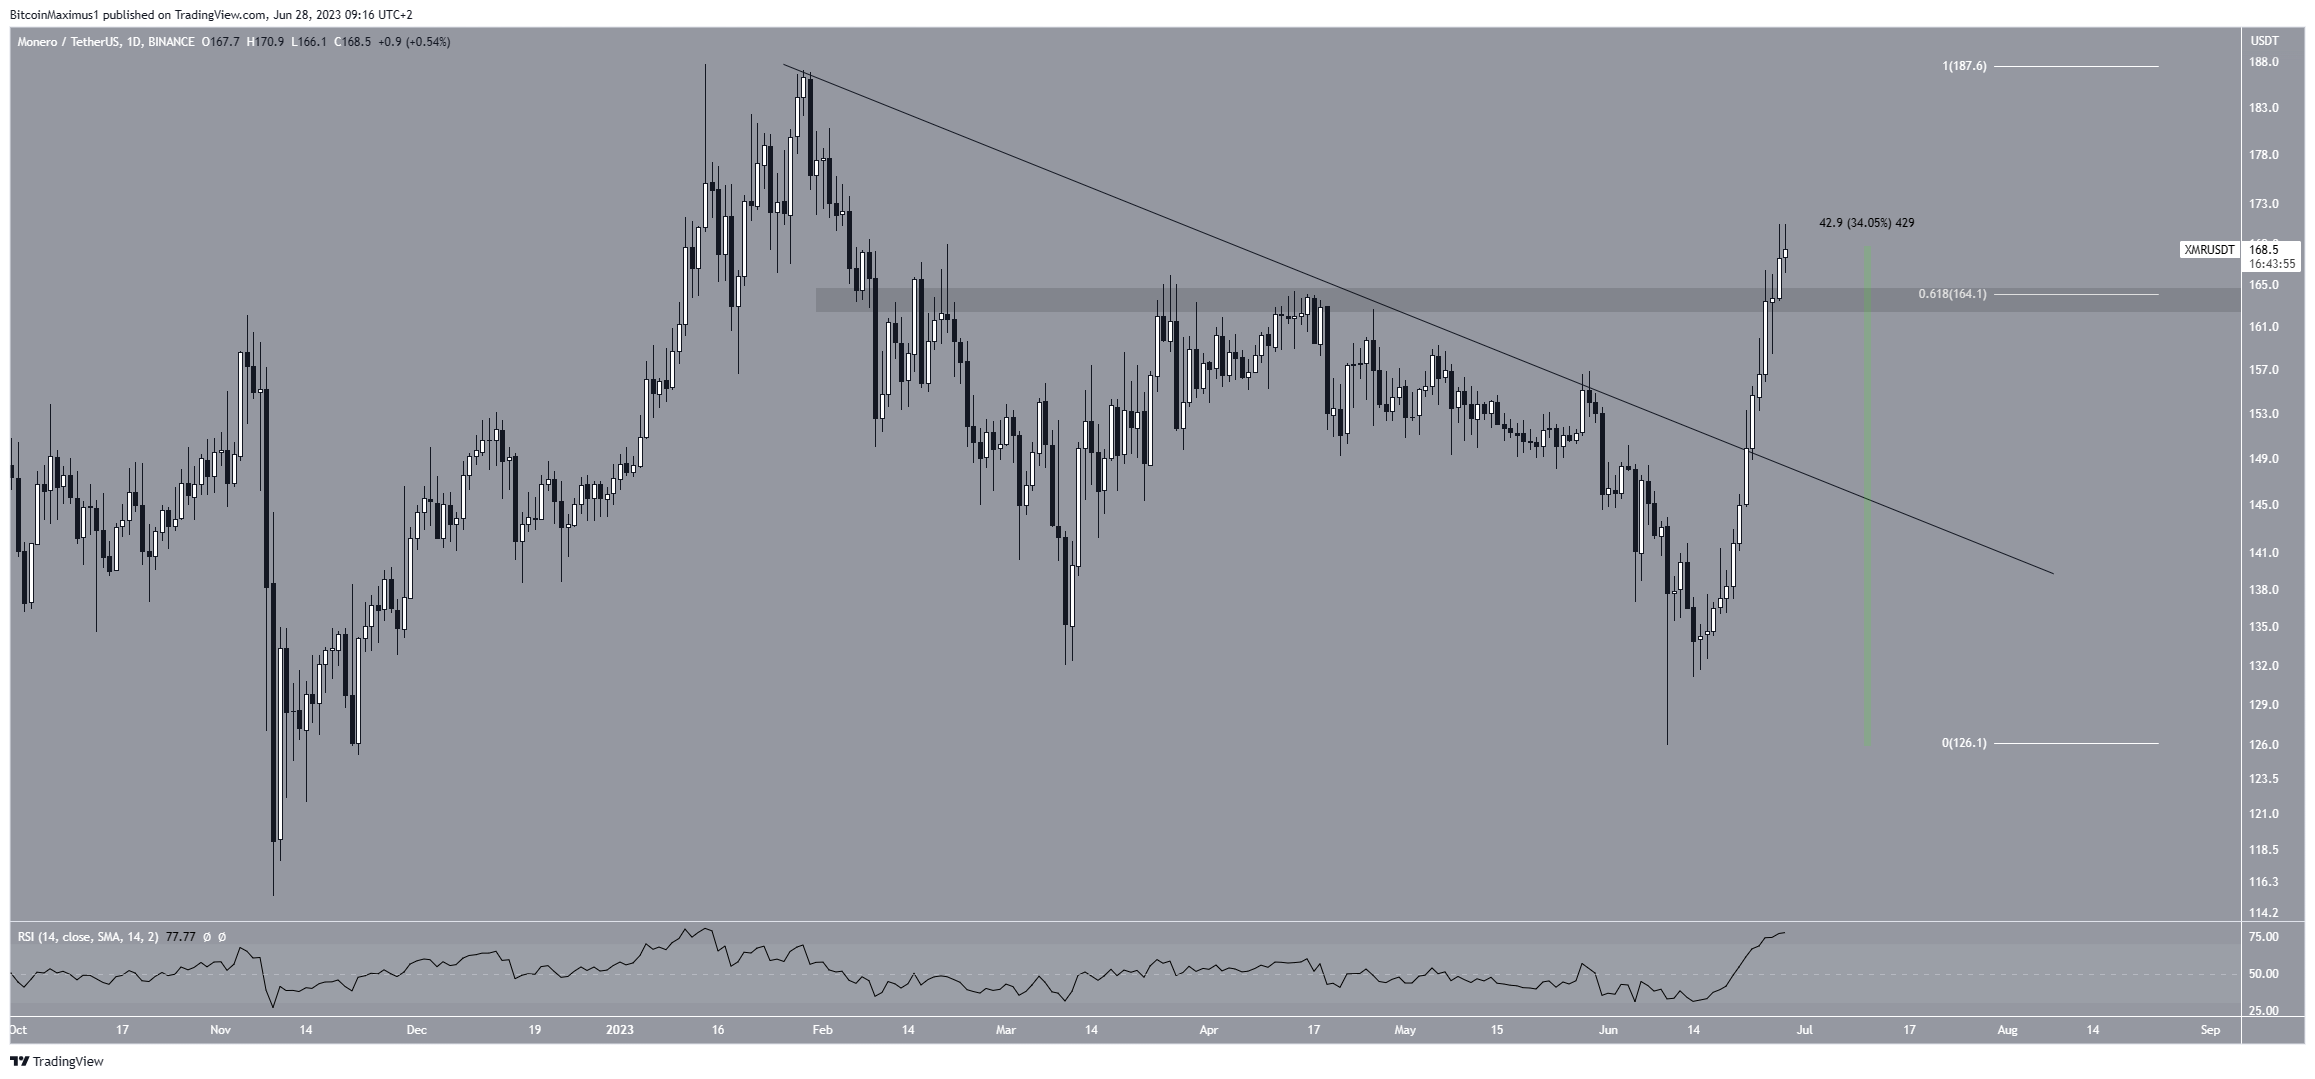
Therefore, the most likely XMR price prediction suggests that the price will continue increasing and break out from the long-term descending resistance line. It can move to the next long-term resistance at $260 in that case.
Despite this bullish XMR price prediction, a daily close below the $164 area will mean that the trend is still bearish. In that case, a drop and retest of the $140 resistance line will be the most likely price scenario.
Read More: 9 Best Crypto Demo Accounts For Trading
For BeInCrypto’s latest crypto market analysis, click here.



