


The Polygon (MATIC) price is under scrutiny as Daily Active Addresses have declined over the last eight days, hitting a seven-day Moving Average low not observed since February 27. With 51% of MATIC holders now facing losses, there’s a likelihood they might cling to their assets in anticipation of future price recoveries.
Furthermore, the recent formation of a death cross in MATIC Exponential Moving Average (EMA) lines points towards a persistent bearish trend, casting shadows over the immediate outlook for the cryptocurrency.
Polygon Active Addresses Are Declining
The number of MATIC Daily Active Addresses has seen a notable uptick in recent times, exhibiting a robust growth pattern. Specifically, from February 1 to March 14, there was a significant increase in daily active addresses, soaring from 1,946 to 3,301, marking an impressive 69.63% growth.
This uptrend shows a growing interest and engagement within the MATIC network. However, this vigorous growth pace has shown signs of deceleration over the last eight days, a trend discernible from the seven-day Moving Average depicted in the chart below.
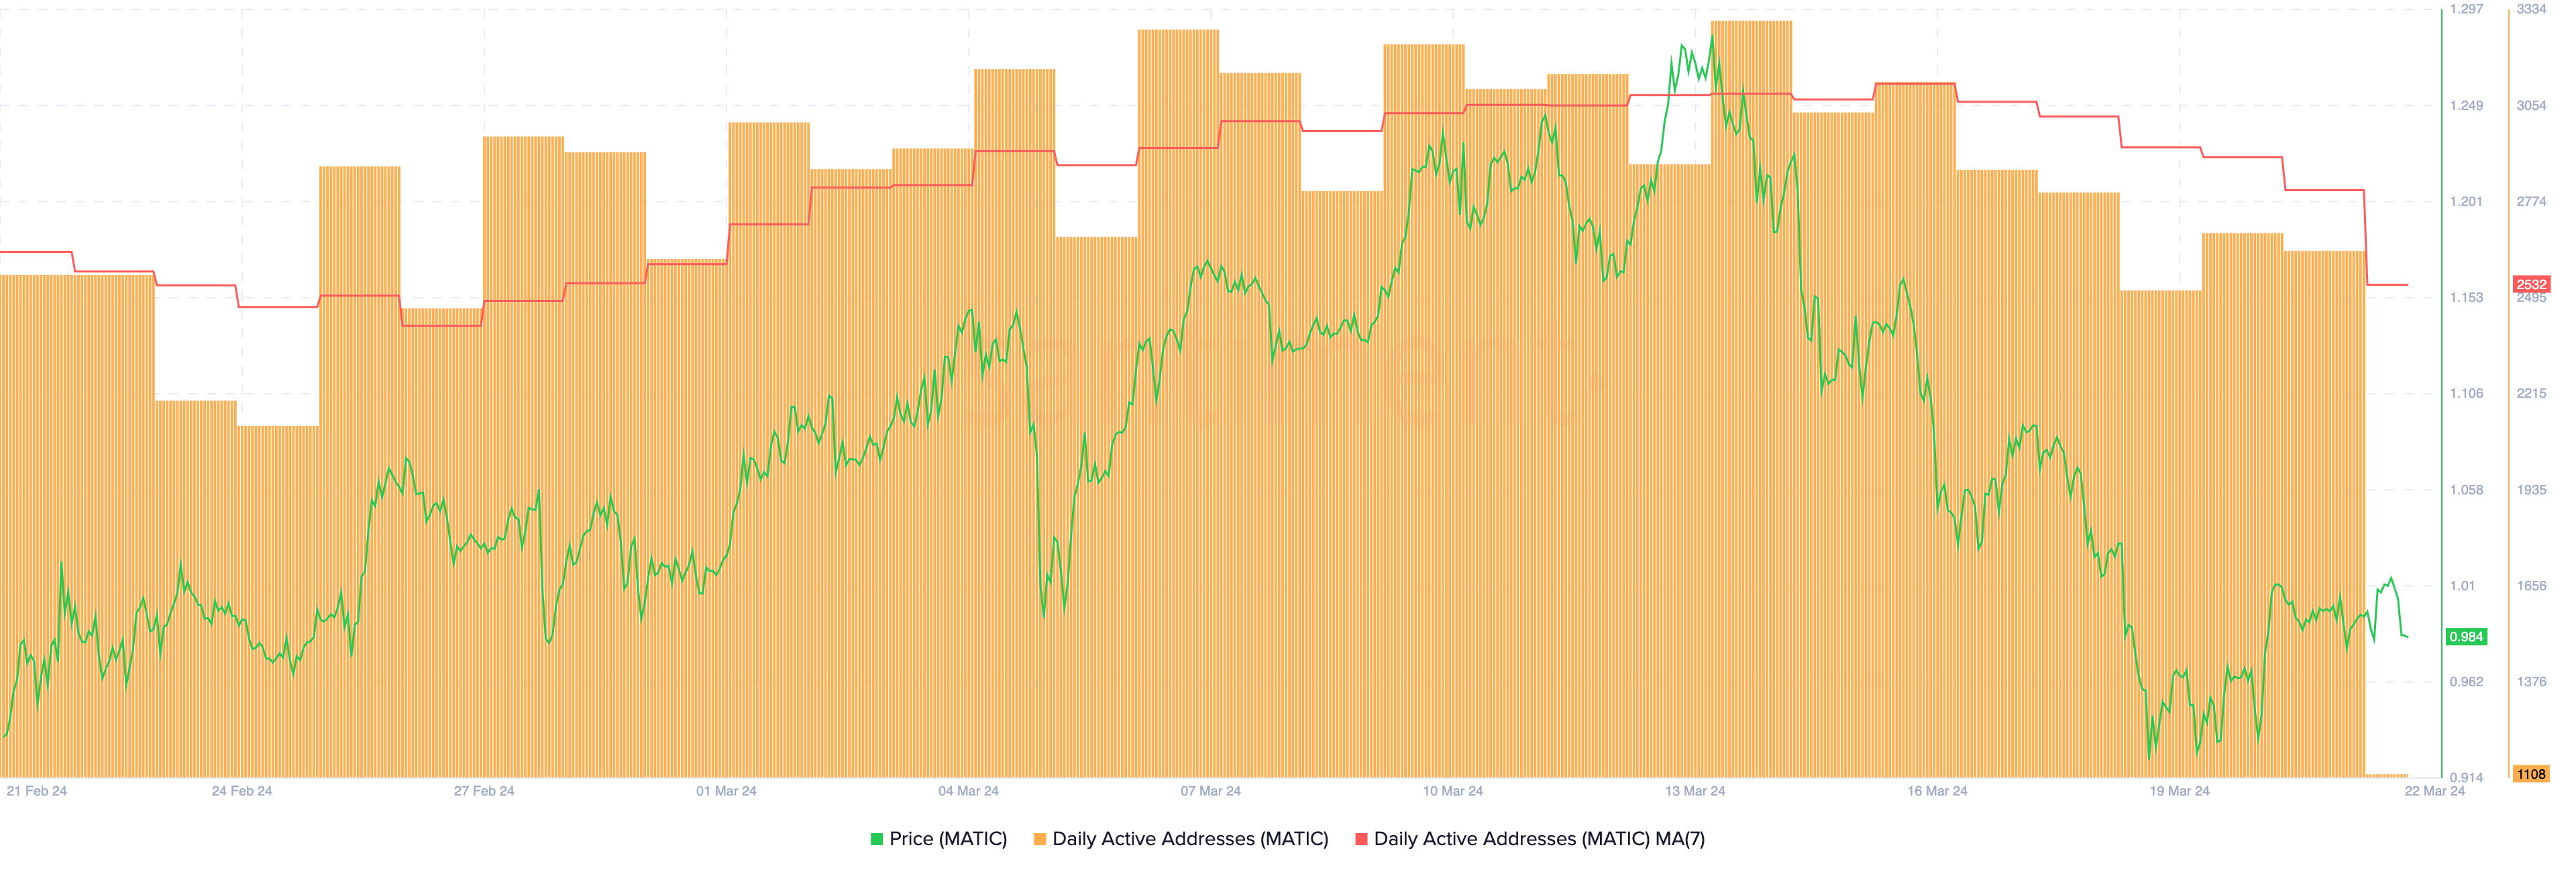
The relationship between MATIC price movements and its Daily Active Addresses, particularly the seven-day Moving Average, has historically been tight. This correlation was displayed in the recent price surge observed from February 1 to March 14, during which the MATIC price experienced a notable increase of 41.77%.
Given the recent downturn in the Daily Active Addresses’ seven-day Moving Average, there’s an inference that MATIC price might be gearing up for a potential correction phase shortly. If historical patterns hold true, this downturn in active address growth could presage a cooling period for MATIC market valuation, hinting at an upcoming adjustment in its price trajectory over the ensuing days.
Holders Face Losses: On-Chain Metrics Signal Bearish Trend
The current situation, with 51% of MATIC addresses being at a loss while only 44% are in profit, tends towards a bearish sentiment. Having the majority of investors underwater suggests they purchased at higher prices, leading to diminished buying enthusiasm and potentially stalling any upward price momentum.
This situation might also prompt those at a loss to sell as soon as prices recover, introducing selling pressure at certain thresholds and limiting potential price growth.
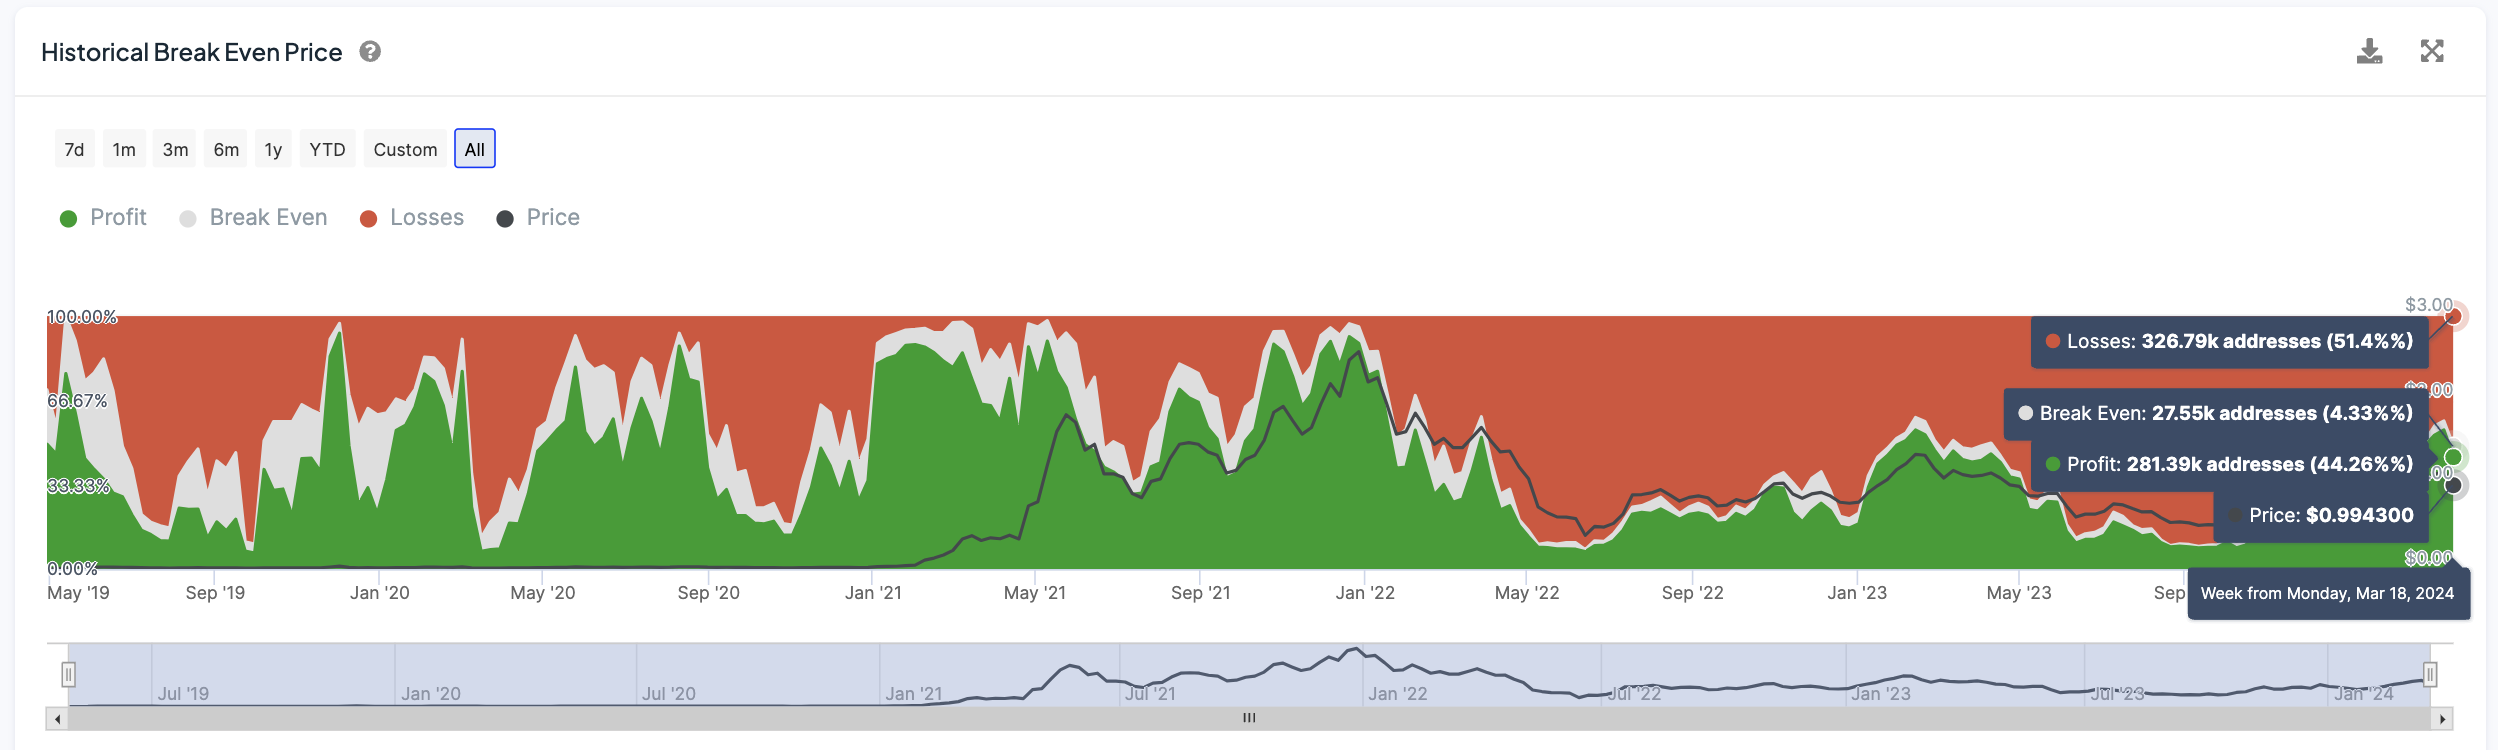
The psychological impact on investor sentiment, with a majority facing losses, could foster a bearish outlook, as the concern over further declines overshadows optimism for recovery. This could dissuade new investments and delay any positive price movement.
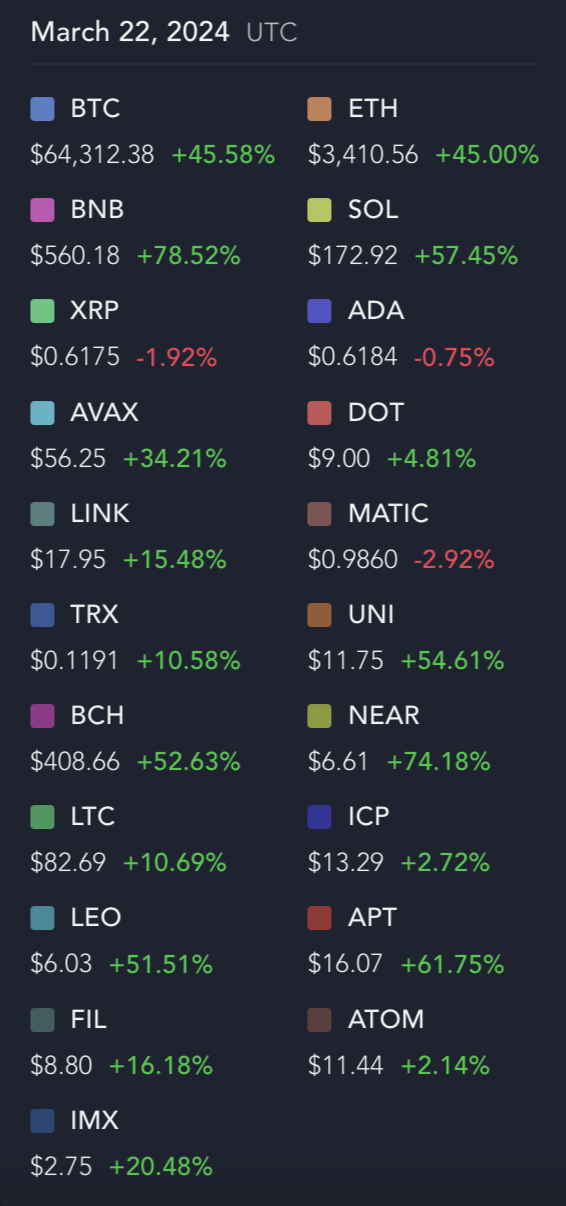
Comparing the year-to-date (YTD) growth of some of the biggest crypto in the market today – excluding stablecoins and memecoins, MATIC is now at a loss. That status is only followed by the other two coins: ADA and XRP. With the rest of the market booming, investors could start leaving MATIC behind as they seek other investment opportunities with more potential return on their investment.
MATIC Price Prediction: Is A 10% Drop Imminent?
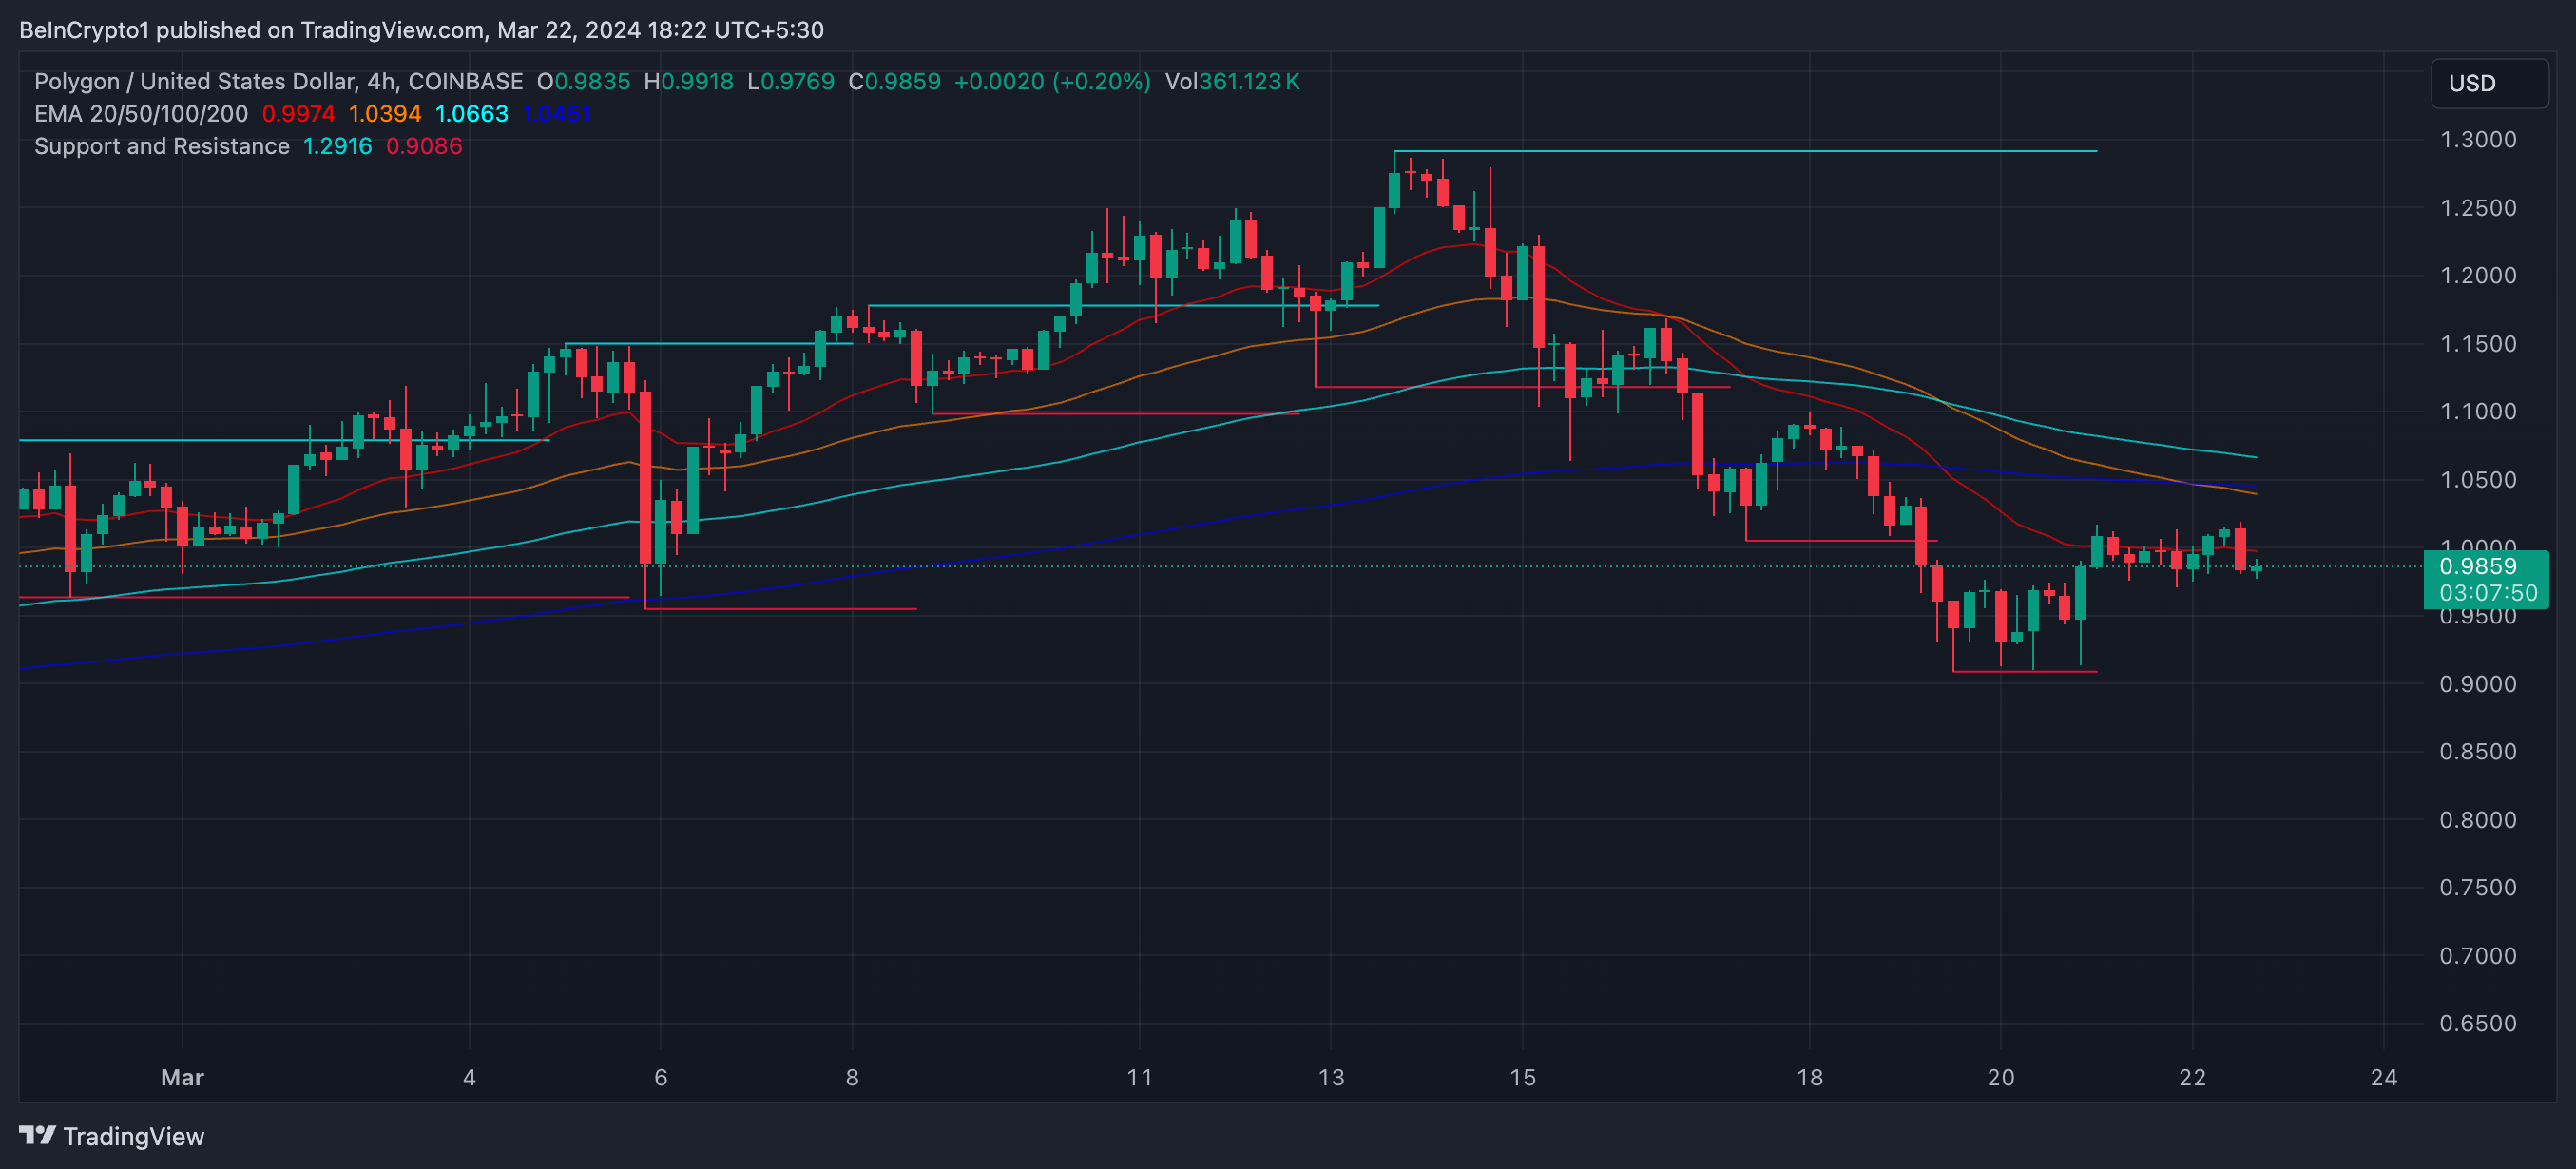
MATIC’s 4-hour price chart shows that both of its short-term EMA lines recently crossed below long-term EMA lines, triggering a bearish trend. This indicates that recent prices are lower than the historical average, suggesting a period where selling pressure has outweighed buying interest.
Such a trend implies that the market may continue to see downward pressure on MATIC prices as the bearish sentiment persists over time.
Exponential Moving Averages (EMAs) are a moving average that places a greater emphasis on recent price data, aiming to provide a more accurate reflection of current market trends. They are pivotal in identifying the direction of the price momentum and potential trend reversals.
If the downtrend persists, MATIC’s price could drop until the next support zone at $0.90, an almost 10% price drop. On the other hand, other factors, such as an ETH price surge, could revert this trend and make MATIC’s price start rising again. In that case, it could test resistances at $1.10 and $1.15.


