


The Polygon (MATIC) price is in the process of breaking down from a long-term structure, putting the entire increase since the beginning of the year at risk.
Besides the long-term breakdown, the daily time frame also provides bearish signs. As a result, an almost immediate bullish reversal will be required to negate the bearish trend.
Polygon Price Risks Losing Bullish Structure
According to the technical analysis of the long-term weekly time frame, there is a bearish outlook for MATIC, the native token of the Polygon network. There are multiple reasons for this.
Firstly, the price of the MATIC token is trading within an ascending parallel channel, a pattern that typically culminates with a breakdown. As a result, it is considered a bearish pattern.
The fact that the price is trading in the lower portion of the channel supports this outlook.
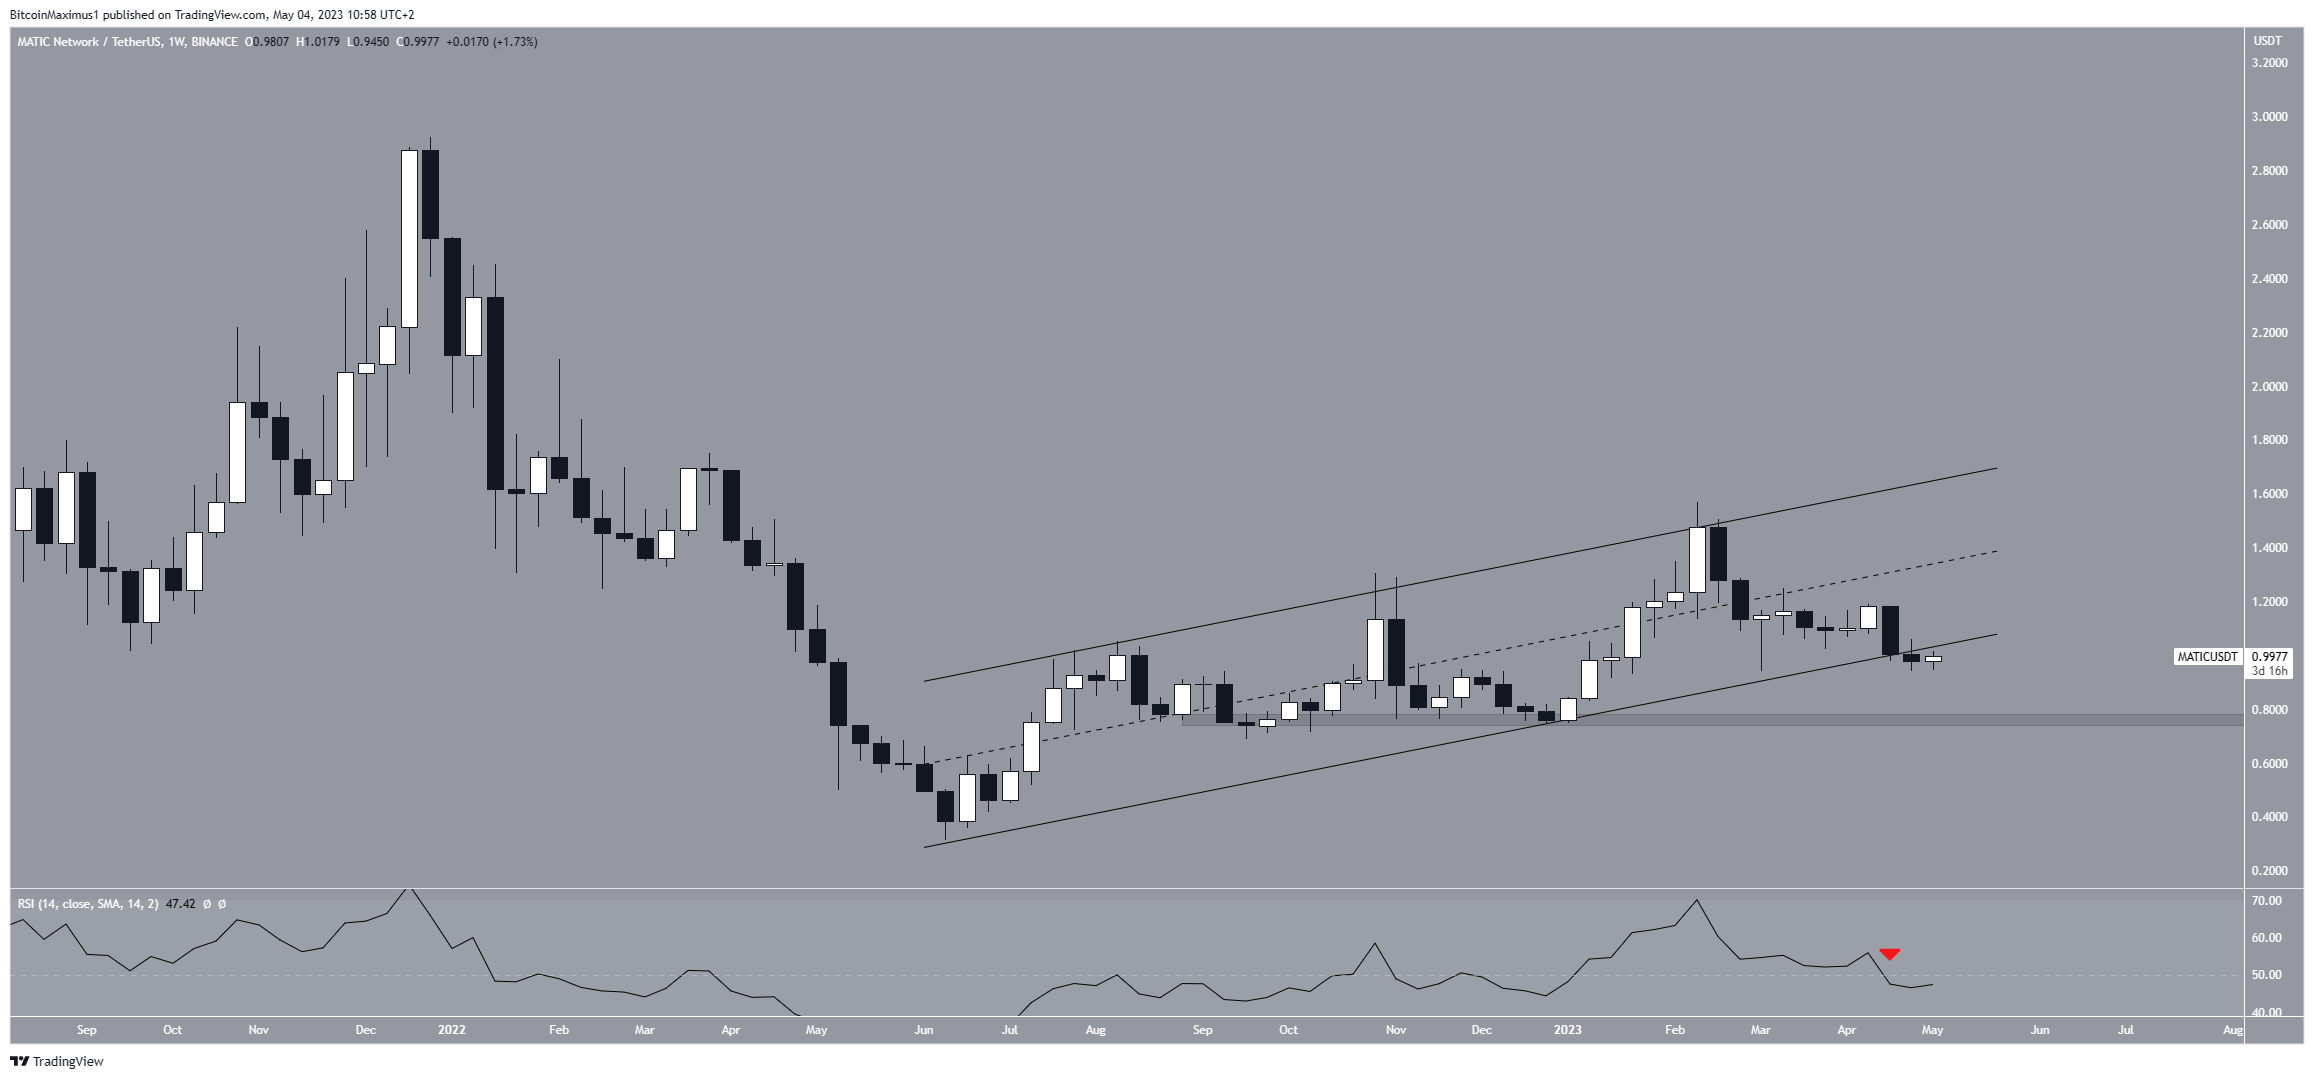
Secondly, the weekly Relative Strength Index (RSI) gives a bearish reading. Traders use the RSI as a momentum indicator to determine whether a market is overbought or oversold and decide whether to buy or sell an asset.
If the RSI reading is above 50 and the trend is upward, bulls have an advantage, but if the reading is below 50, the opposite is true.
In the case of the Polygon price, the RSI broke down from its trendline and decreased below 50, indicating a bearish trend. The fact that the RSI decrease coincides with a price decrease increases the chance of a breakdown.
The closest support area is at $0.76, while the closest resistance is at the channel’s midline at $1.40.
MATIC Price Prediction: Does Price Have Any Strength Left?
The daily time frame price analysis is in alignment with the weekly one. Even though the Polygon price bounced at the $0.95 horizontal support area, it still follows a short-term descending resistance line.
Combined with the support area, this created a descending triangle, which is considered a bearish pattern.
As a result, a breakdown from it is the most likely outlook. If this happens, it will likely cause a downward movement toward $0.76.
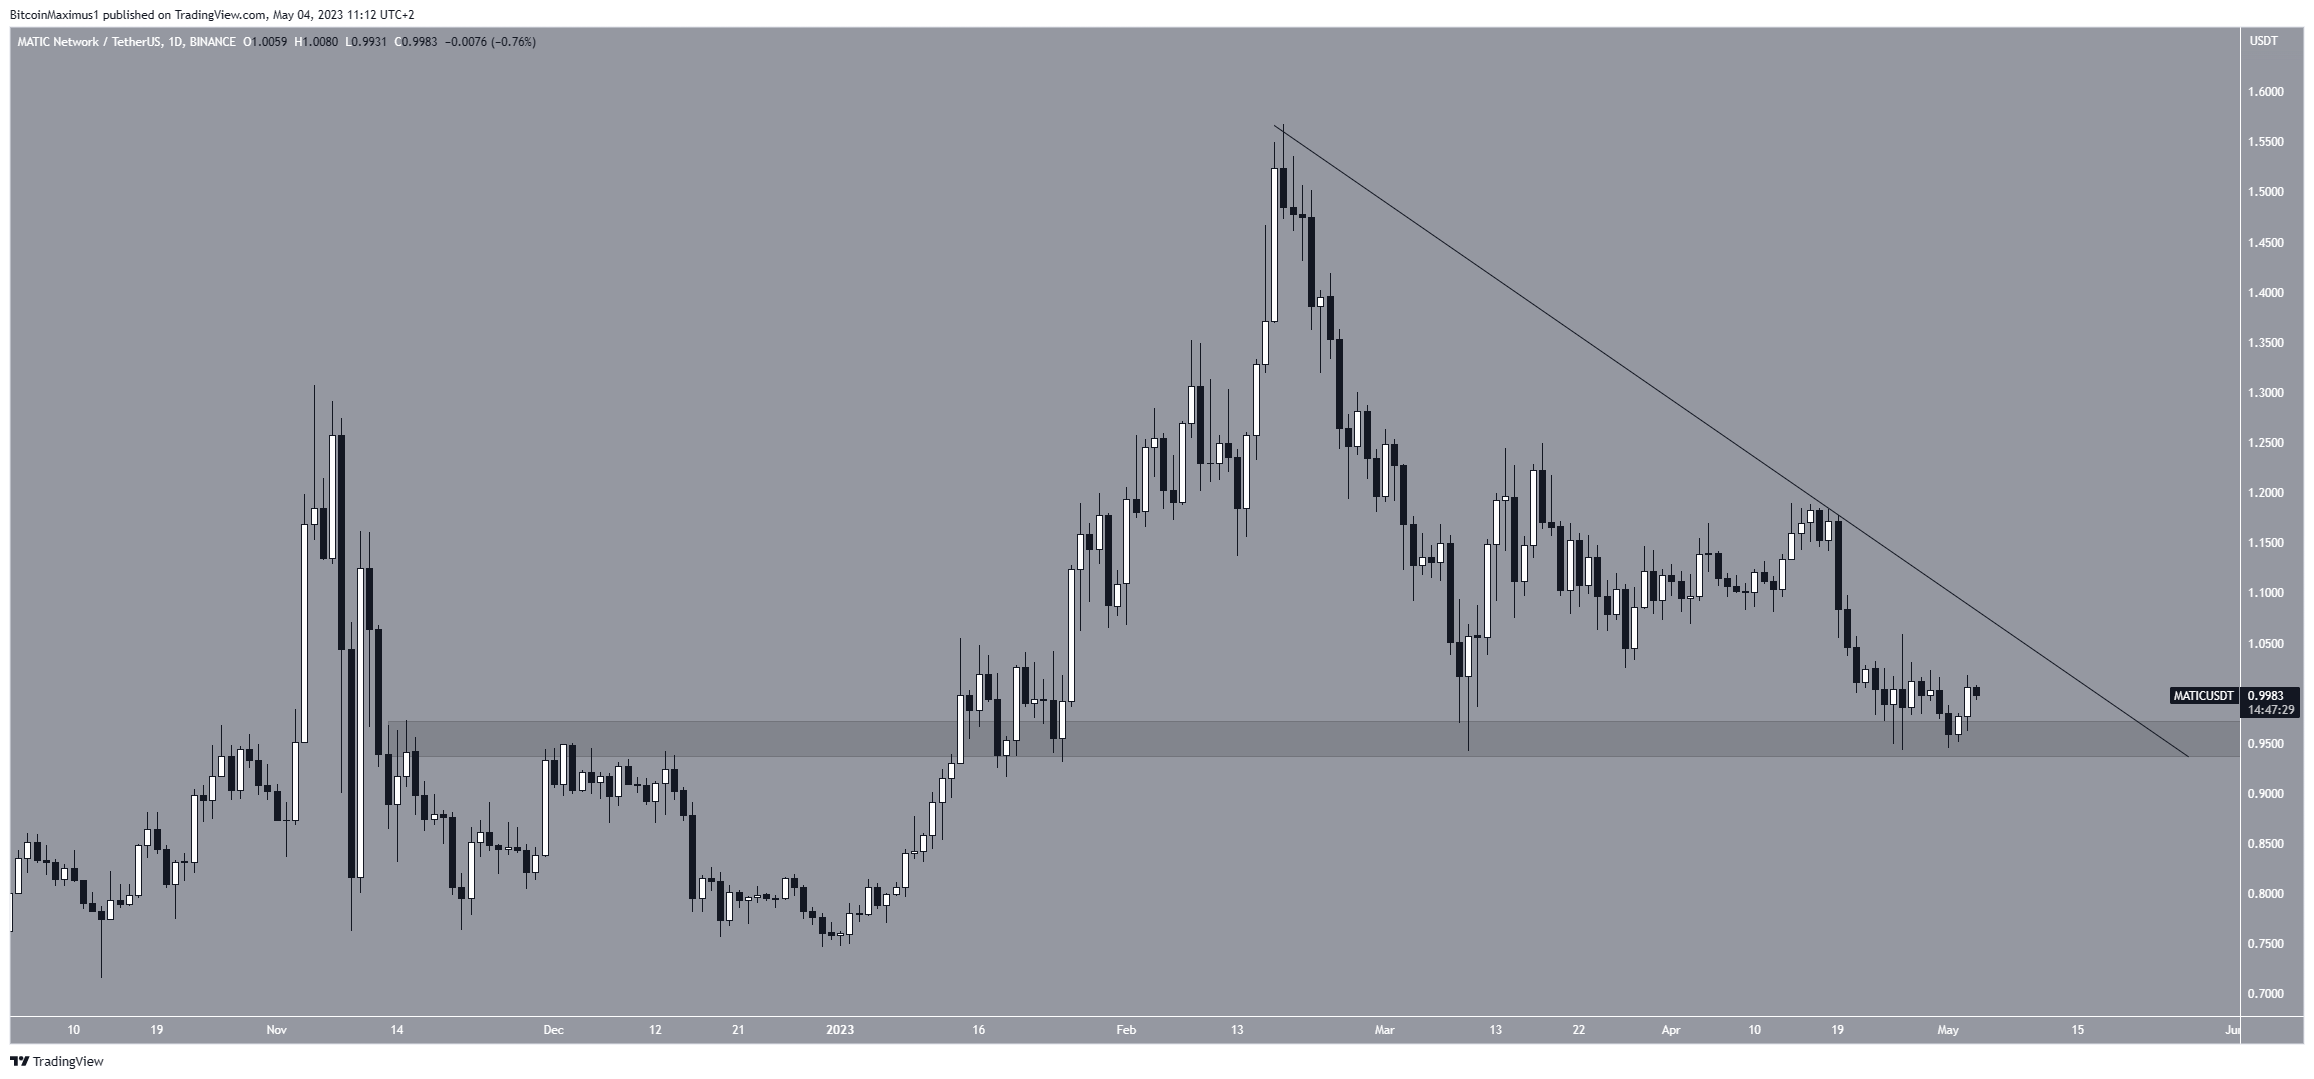
Despite the bearish MATIC price prediction, moving above the resistance line and reclaiming the previous channel’s support line will mean that the trend is bullish. In that case, the price can move toward the channel’s midline at $1.40.


