


On-chain analyst @TheRealPlanC completed several months of work on his Market Reversal Indicator for crypto investors, showing a bullish market for the first time since late November 2021.
On-chain analysis is a testing ground for many smart and mathematically-sensitive cryptocurrency market observers. This relatively new field of technical analysis is growing rapidly, providing many complementary takes on what is happening in the blockchain network.
We have just witnessed a new creation of it – Market Reversal Indicator.
The author of this new indicator and on-chain analyst @TheRealPlanC, who with 64,000 followers is gaining more and more popularity on crypto-Twitter, just completed his 3+ months of work on a new aid for cryptocurrency investors – the Market Reversal Indicator.
This morning, the Indicator gave a bullish signal that hasn’t been seen since late November 2021.
Could it be that the Bitcoin (BTC) market has started a new uptrend?
Bitcoin price action
To answer this question, let’s first look at the Bitcoin price action. The largest cryptocurrency reached the all-time high (ATH) of $69,000 on November 10, 2021. It then began a downward trend that continues to this day.
As a result of this decline, BTC lost 52% of its value and recorded a bottom at $32,950 on January 24, 2022. The price action respected both the daily super trend indicator (red) and the descending resistance line (blue).
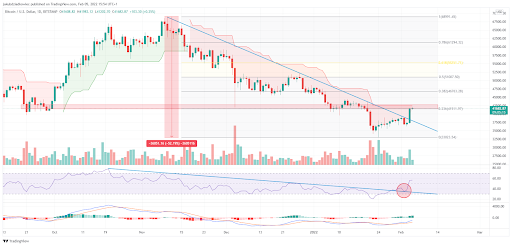
However, after recording a bottom, Bitcoin made another, this time successful, attempt to break out above the descending resistance line. Yesterday, it generated a large green candle with a body size of 11.41% and successfully broke out above the resistance. The breakout was confirmed by an increase in volume. The price reached the $41,500 area where it is currently trading.
The rising price action goes hand in hand with bullish signals from technical indicators. The RSI broke out of the declining trend line, then validated it as support (red circle) and continues to rise. It is currently above the 50 line, which is a sign of a bullish trend.
MACD is in positive territory and is generating increasing bars of positive momentum. However, the signal line is still below 0.
Despite these bullish signals, BTC has just reached a long-term resistance level at the 0.236 Fib retracement, counting for the entire downward movement. This area is in confluence with both the horizontal resistance level (red area) and the resistance of the super trend indicator.
As long as the $41,500 – $42,500 range is not broken through and confirmed as support, the trend cannot be considered upward.
How was the Market Reversal Indicator created?
In the perspective of this complex Bitcoin price action, the Market Reversal Indicator presented yesterday for the first time is interesting. Its author @TheRealPlanC claims to have been working on it for 3 months, experimenting with multiple combinations of on-chain indicators from Glassnode T3 data.
Moreover, the analyst claims that the Market Reversal Indicator has strong performance on multiple time frames from the previous 10 years:
“I have been working on this Market Reversal Indicator for 3 months. Happy to finally share it. Look out for more posts today showing it better over all the time frames for the last 10 years.”
In the comment, he adds that he analyzed different combinations for more than 50 indicators. However, he doesn’t reveal on Twitter which 3 indicators eventually made it into his new tool. In any case, the original Market Reversal Indicator first published yesterday looks as follows:
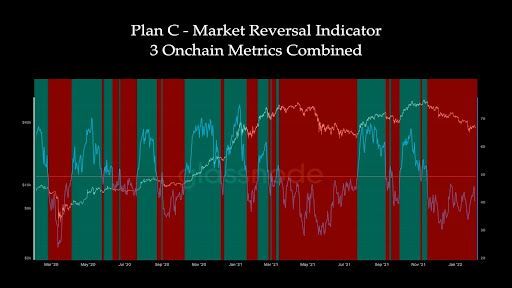
Its interpretation is very simple. If the indicator line breaks above 50, it signals the beginning of an uptrend. If it breaks below 50, it is a sign of the beginning of a downtrend. In other words, it suggests to join the market, i.e. take a long position, once it passes above the 50 line. If it goes below the 50 line it suggests to exit the market, i.e. take a short position.
Trend reversal indicator – the beginning of uptrend?
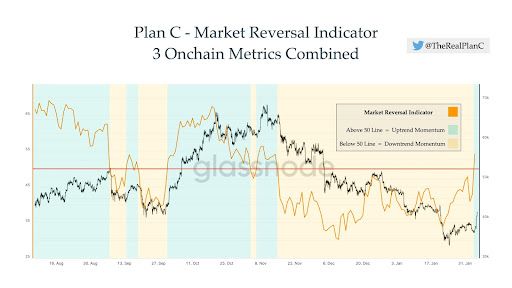
This morning @TheRealPlanC published the first update of his indicator. It appeared in a slightly different layout, as users pointed out that the previous one was unreadable. It is interesting that just today the indicator gave a signal of the beginning of the uptrend and turned green.
The author admits that this happened while the Bitcoin price was still at $36,575 level. However, the delay in publishing the tweet was due to lack of confirmation, as one of the indicators included in the tool was not updated until the morning hours.
The strange coincidence between months of work on the indicator, the date of its publication and the movement of the Bitcoin price @TheRealPlanC comments as follows:
“The day after I posted my Market Reversal Indicator we crossed the 50 line after being below it for 82 days. I had been working on it for about 80-90 days, funny how that played out.”
Bitcoin’s Recent Rise
At the end of last week, Bitcoin’s rise to just over $40,000 allowed for the cryptocurrency to finally break from its long-term descending trendline, and technical indicators are giving signals of the beginning of an uptrend. Additional confirmation of the bullish scenario is the freshly published Market Reversal Indicator, based on on-chain data.
Despite this, there are still many resistance levels ahead of BTC, and without breaking through them it is impossible to talk about resumption of the long-term uptrend.
“I am by no means saying we are out of the woods. I am also not fully sold on this move, yet. It’s just an exciting start, and the first real momentum shift we have seen in a while. However, we still got a lot of work to do. > 46k = More Confident,” said @TheRealPlanC.
For BeInCrypto’s latest Bitcoin (BTC) analysis, click here.
What do you think about this subject? Write to us and tell us!


