
The price of Chainlink (LINK) demonstrates positive long-term bias as it successfully avoided a breakdown from a significant horizontal support area. It is attempting to confirm that same area as a support level.
Although the long-term outlook remains bullish, short-term readings suggest that the price has initiated a retracement. Nevertheless, there is potential for the LINK price to resume its upward movement and reach new highs after establishing a higher low.
Read More: 9 Best Crypto Demo Accounts For Trading
Chainlink Price Reclaims Critical Long-Term Level
According to the weekly analysis, the price of LINK has been trading slightly above the $5.80 support level since April 2022. During this time, it encountered resistance at $8.90. However, in early June 2023, the price dropped below $5.80, initially indicating a breakdown from the long-term support. But, the price subsequently rebounded and has since risen, reclaiming the $5.80 area.
Therefore, what previously seemed like a breakdown is considered a deviation (green circle). This is considered a bullish sign, often followed by a notable upward movement.
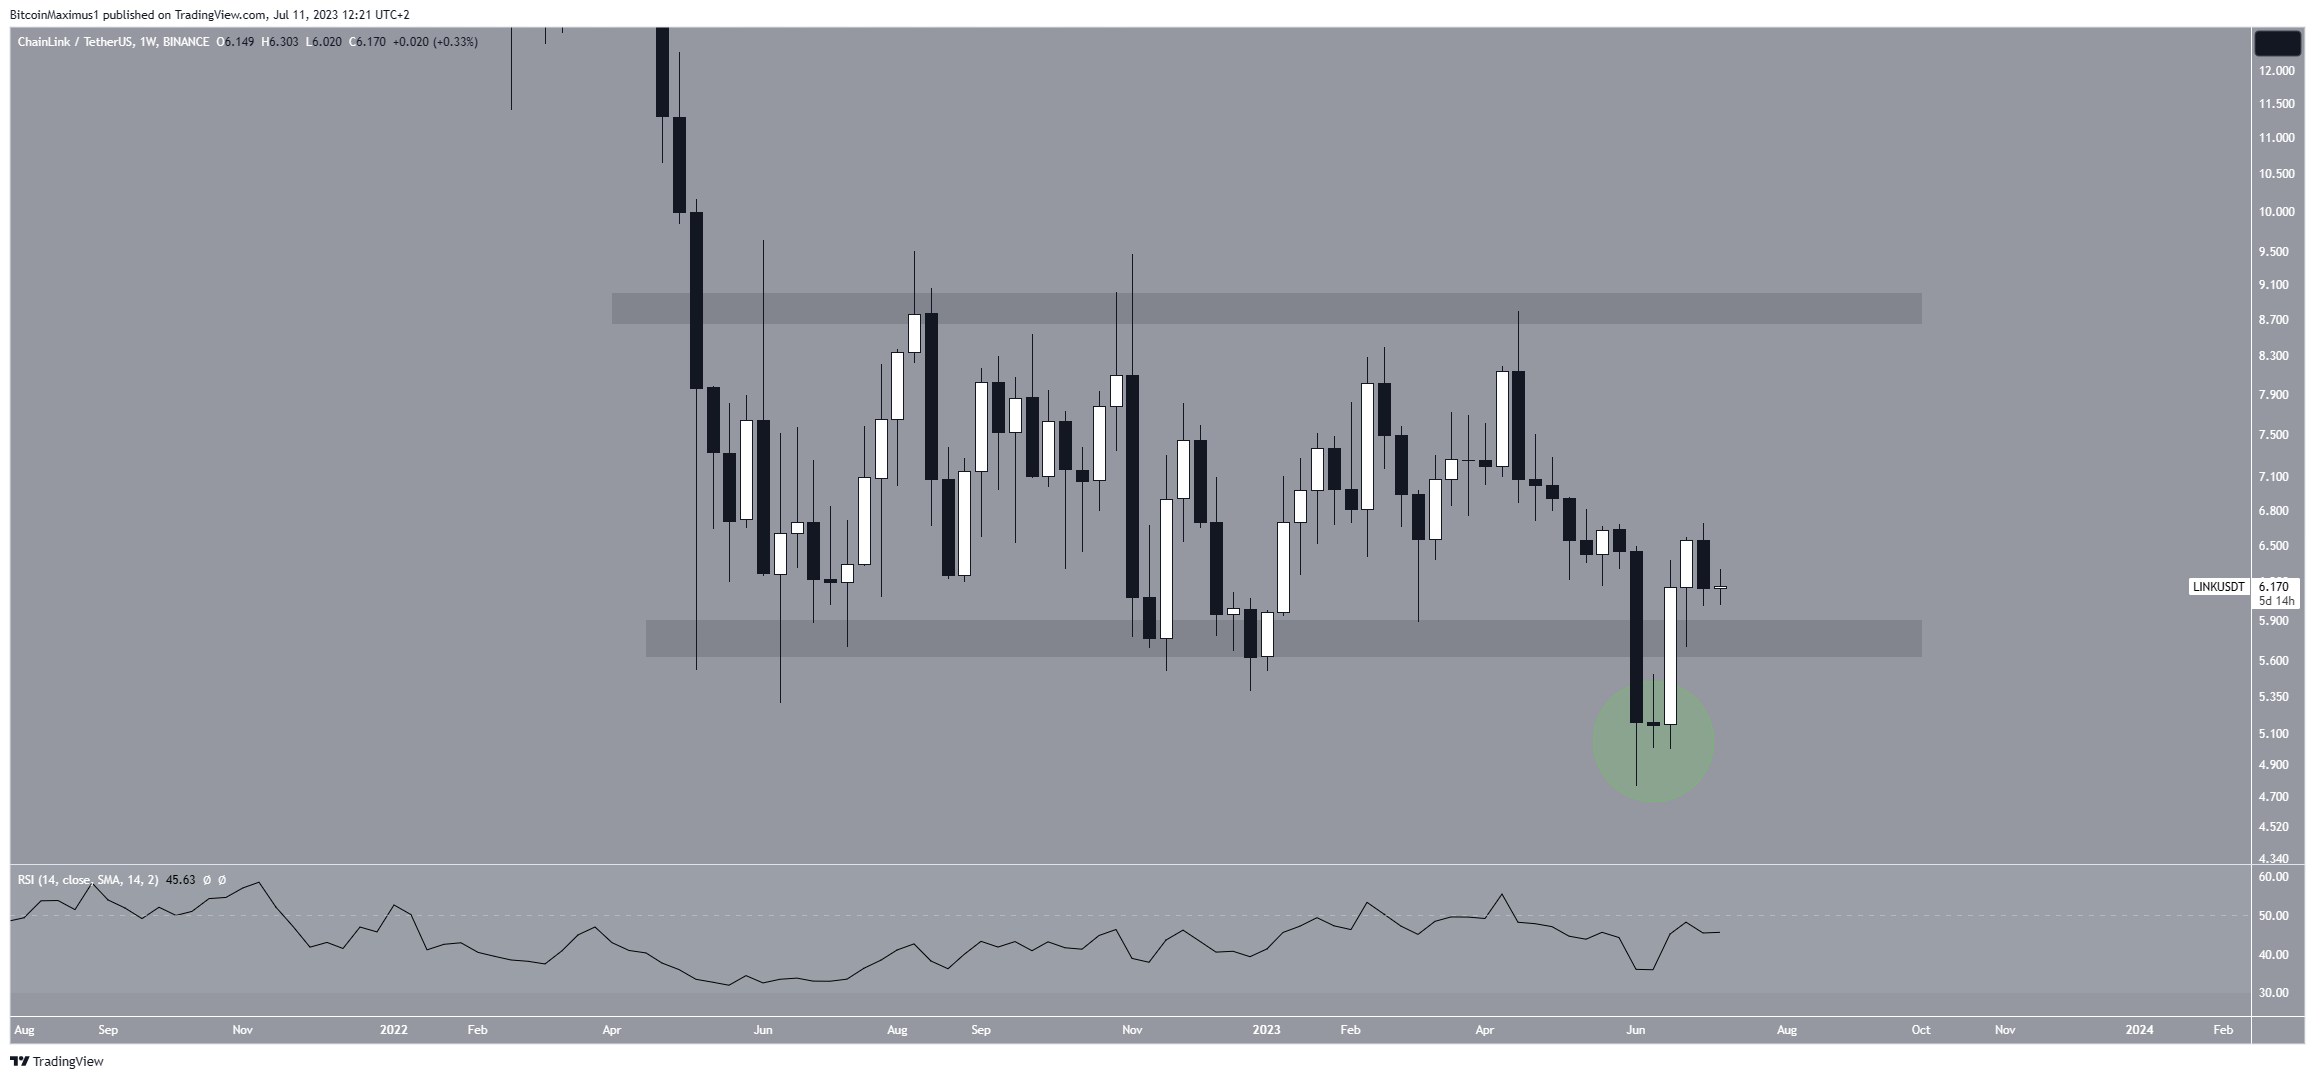
Although the price has recovered, the weekly RSI (Relative Strength Index) shows a neutral reading. RSI is a momentum indicator used by traders to assess whether a market is overbought or oversold and to determine whether to buy or sell an asset. Readings above 50 and an upward trend suggest that bulls still hold an advantage.
The opposite is true for readings below 50. Currently, the RSI is increasing but remains above 50. These mixed signals imply that the trend’s direction is uncertain.
Read More: Best Upcoming Airdrops in 2023
LINK Price Prediction: Wave Counts Supports Increase to Double Digits
While the overall trend on the weekly chart is only leaning bullish, the daily technical analysis provides a more decisively clear bullish perspective. The wave count and the RSI both support this prediction.
After the June 10 low, the LINK price has completed a five-wave increase (shown in black), suggesting a potential bullish trend reversal. However, it is currently undergoing a corrective phase within an A-B-C structure.
The most probable level for the correction to conclude is at the $5.73 support level. This represents a 0.5 Fibonacci retracement of the previous increase.
Elliott Wave theory analyzes recurring long-term price patterns and investor psychology to determine trend directions.
The most likely wave count indicates that the current increase is just the initial wave of a larger five-wave upward movement (white). If this holds true, the price will eventually surpass the resistance level at $9 and move into double-digit territory.
A potential target for the top of the third wave is at $9.80, created by the 2.61 extension of wave one.
Furthermore, the daily RSI rises above 50, indicating a bullish trend.
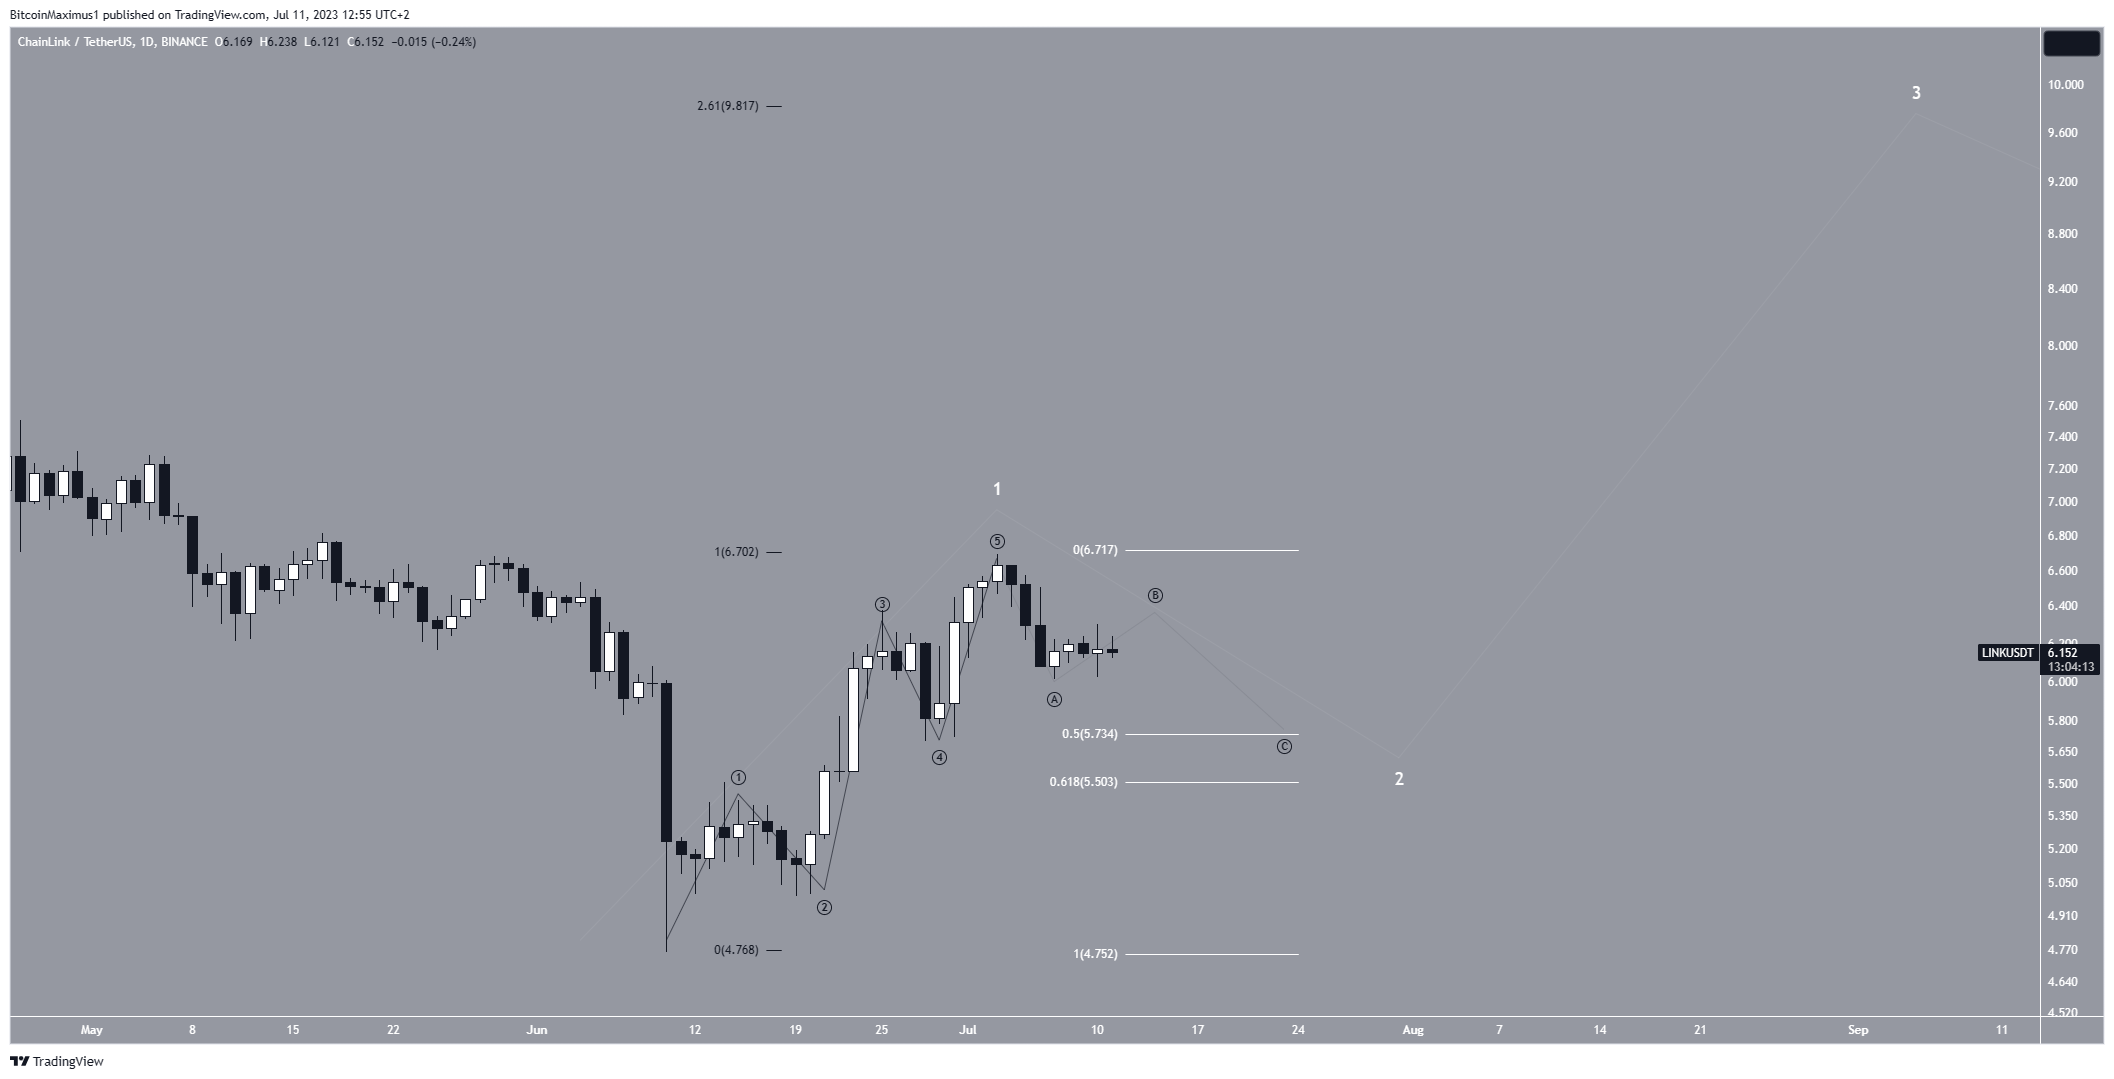
However, it is important to note that if the price falls below the June 10 low of $4.69, it will indicate a continuing bearish trend.
In such a scenario, a decrease to $4 becomes the most likely outcome.
Read More: Best Crypto Sign-Up Bonuses in 2023
