


The price of Chainlink (LINK) is showing promising long-term bullish signals. It has managed to reclaim a significant horizontal level and is currently attempting to overcome a long-term diagonal resistance level.
Long-term indicators suggest that LINK will eventually break out from the resistance line. However, short-term indicators are causing some uncertainty about this possibility due to a breakdown from an ascending support line.
Chainlink Price Makes Another Attempt at Breaking Out
The technical analysis from the weekly time frame shows that the price of LINK has declined below a descending resistance line since May 2021. This decline led to a low of $4.75 in June 2023. Initially, it appeared to cause a breakdown from the $6 horizontal area, which had been established since May 2022.
However, there was a rapid recovery, and the price returned to the $6 area. Then, it confirmed it as a strong support level. This recovery invalidated the previous breakdown, which often leads to significant reversals, as has been the case with LINK.
The LINK price again attempts to break out from the same descending resistance line. The most recent rejection occurred two weeks ago (red icons). During this time, Chainlink launched a cross-chain interoperability protocol. The resistance line has been in place for an extended period of 826 days and is currently at $7.90.
A successful breakout and close above this line would indicate that the correction is complete and a new upward trend has commenced.
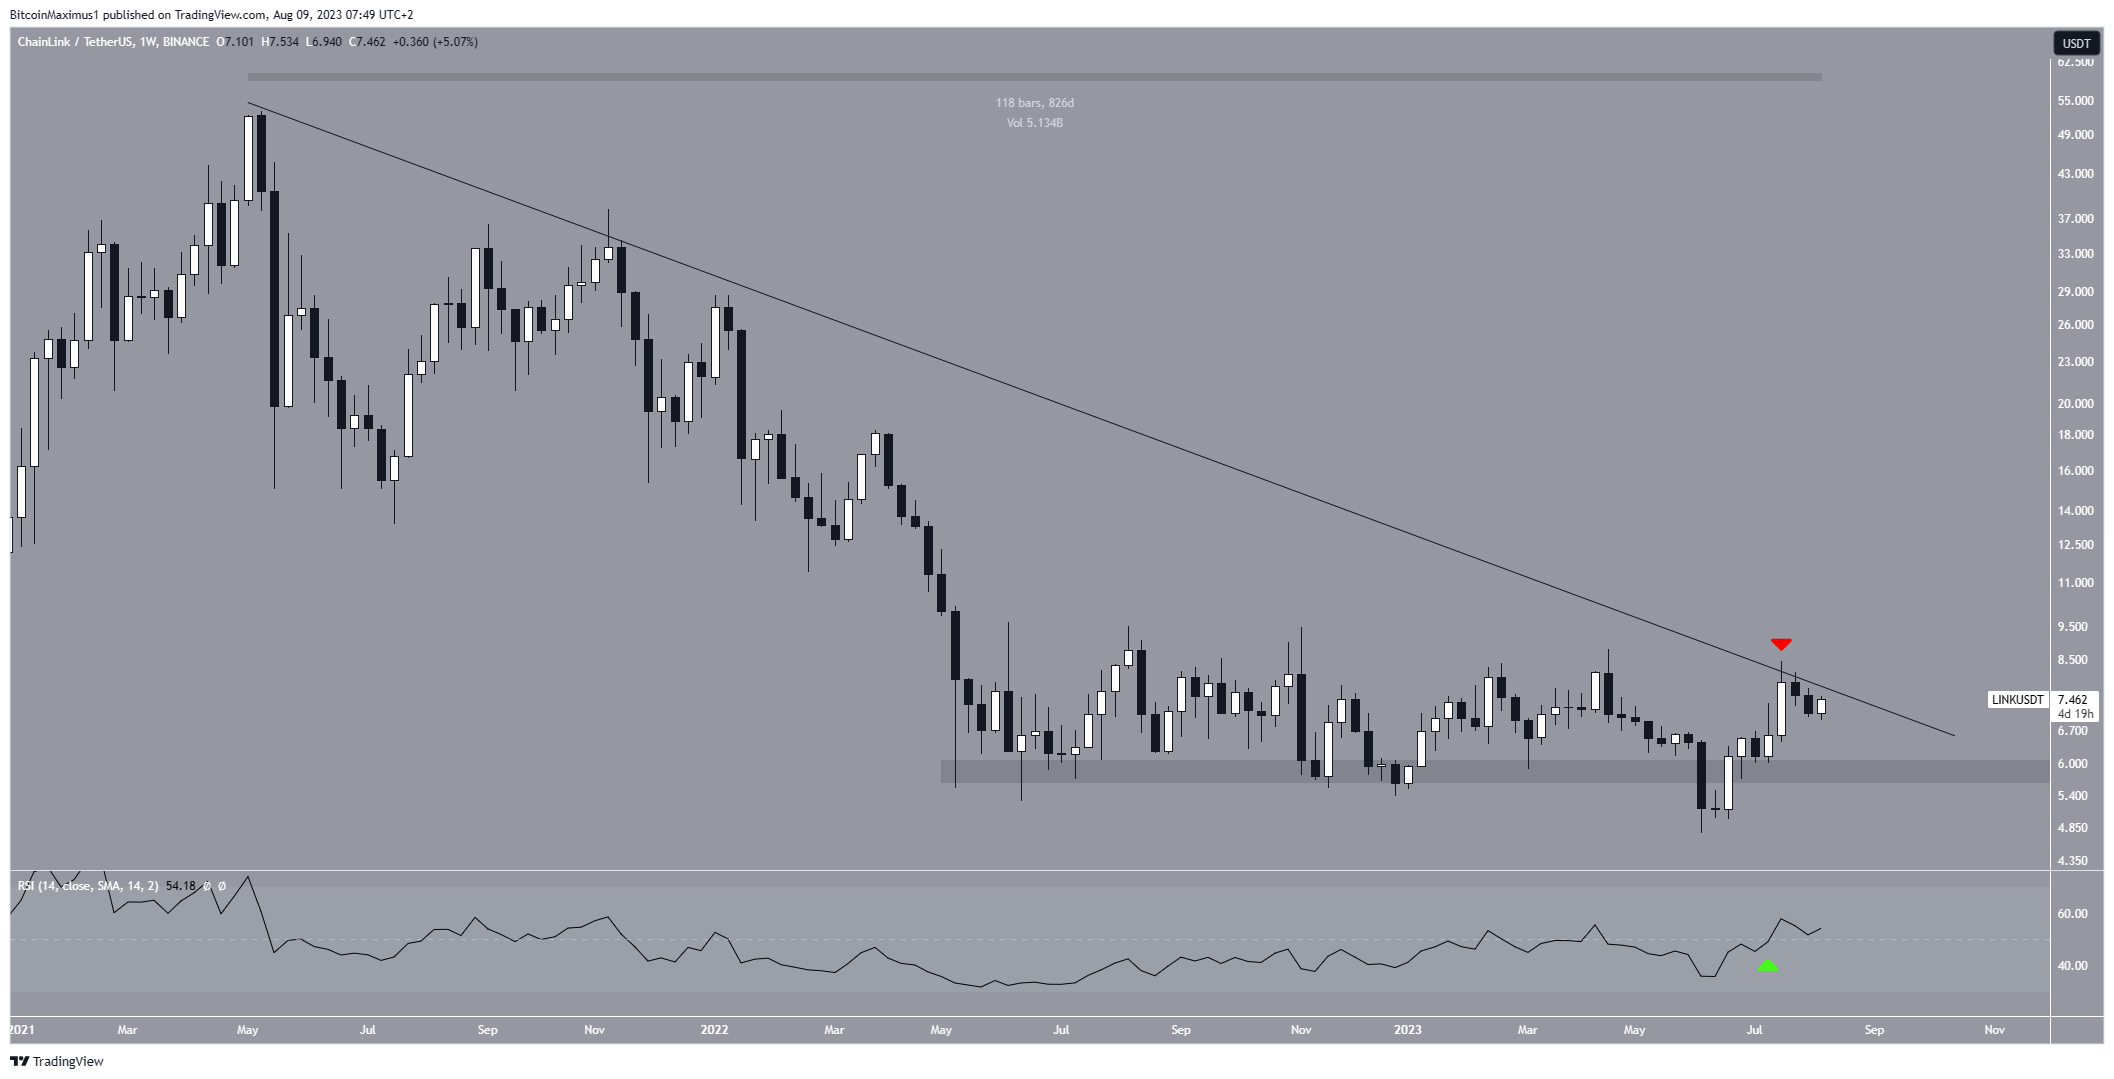
The weekly Relative Strength Index (RSI) supports the upward movement. The RSI is a momentum indicator used by traders to assess whether a market is overbought or oversold, aiding in their decisions about accumulating or selling an asset.
When the RSI reading is above 50 and trending upward, it suggests that bulls still have an advantage. Conversely, if the reading is below 50, the opposite is true. Currently, the RSI is increasing and above 50. Moreover, it has closed above 50 for the first time since September 2021.
Read More: 6 Best Copy Trading Platforms in 2023
LINK Price Prediction: Is Breakdown the Beginning of the Correction?
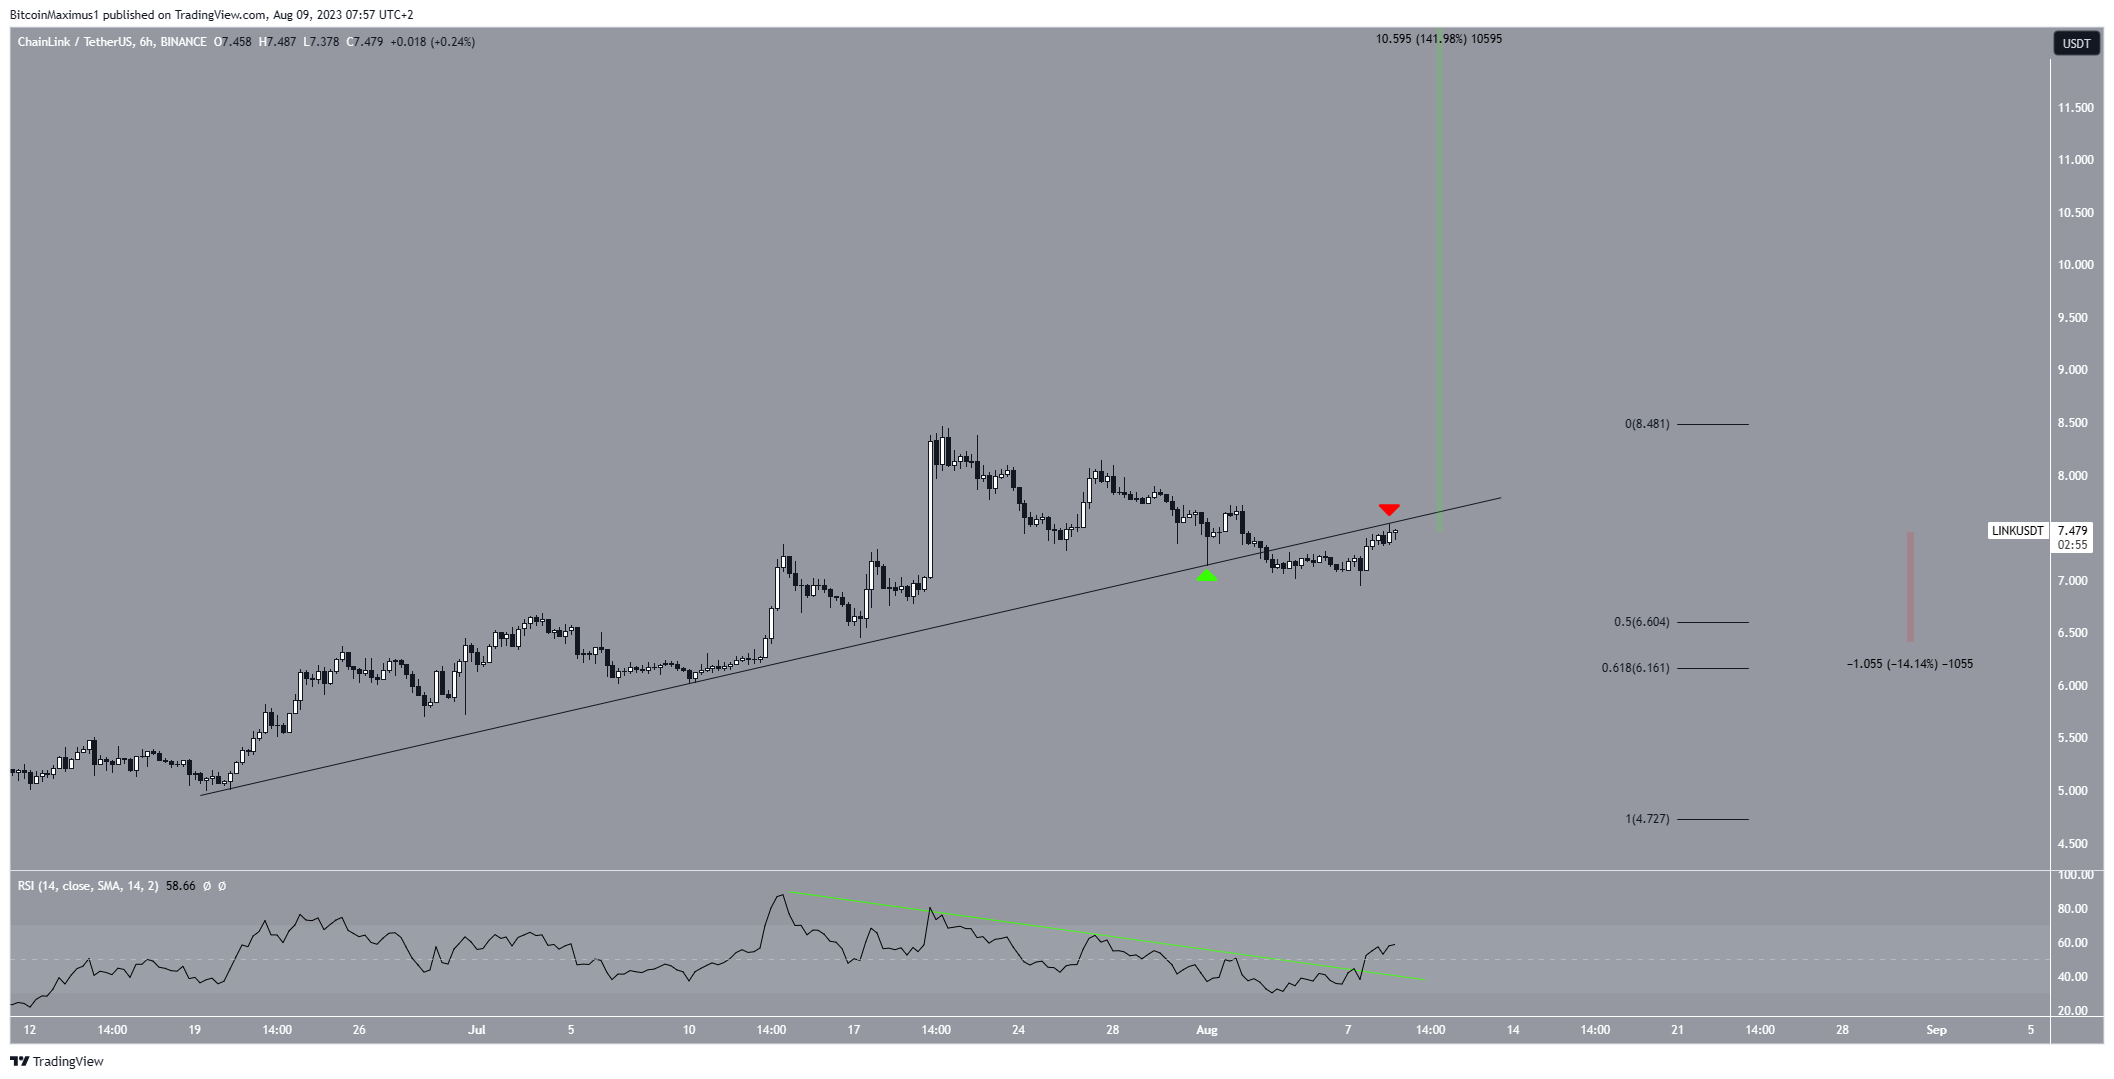
Unlike the weekly timeframe, the six-hour time frame analysis is bearish.
Since first creating a higher low on June 20, the LINK price has increased alongside a very steep ascending support line. On Aug.1, LINK bounced at this support line, creating a bullish hammer candlestick (green icon).
This is a type of bullish candlestick characterized by a long lower wick and a bullish close. It means that buyers took over during the decrease and caused the period’s closing price to be higher than the opening one.
However, the price broke down from the line two days later and is currently in the process of validating it as resistance (red icon). This is a common movement after breakdowns, usually followed by another decrease.
Despite the breakdown, the six-hour RSI supports the continuing increase. The indicator is above 50 and increasing, both signs of a bullish trend. Moreover, it broke out from a descending resistance line, suggesting that the previous bearish trend is over.
If the LINK price continues to increase, it will reclaim the ascending support line and could break out from the aforementioned long-term descending resistance line. Then, a 140% increase to the next resistance at $18 could transpire.
Conversely, a rejection could lead to a drop to the 0.5-0.618 Fibonacci retracement support area at $6.20 – $6.60. This would be a 14% decrease from the current price.
Therefore, the long-term LINK price prediction is bullish, and a breakout from the long-term resistance line is expected.
However, failure to reclaim the short-term ascending support line will delay this eventual breakout and could lead to an initial retracement before an upward movement. The line is currently at $7.60.
Read More: How To Make Money in a Bear Market


