


The Chainlink (LINK) price shows bearish long-term signs, the daily time frame readings suggest that an upward bounce could occur before the final capitulation.
The indicator readings and the daily time frame price action support the increase, while the weekly time frame suggests that the long-term trend is bearish.
Chainlink Price Falls After Rejection
The weekly time frame outlook shows that the LINK price has decreased under a descending resistance line since May 2021. At the time, the price had just reached a new all-time high of $53.
The decrease led to a low of $5.30 in June 2022. While the price has bounced several times since then, it has traded very close to the $5.60 horizontal support area.
Learn more about Chainlink:
At the end of April, LINK was rejected by the descending resistance line (red icon), catalyzing the current downward movement.
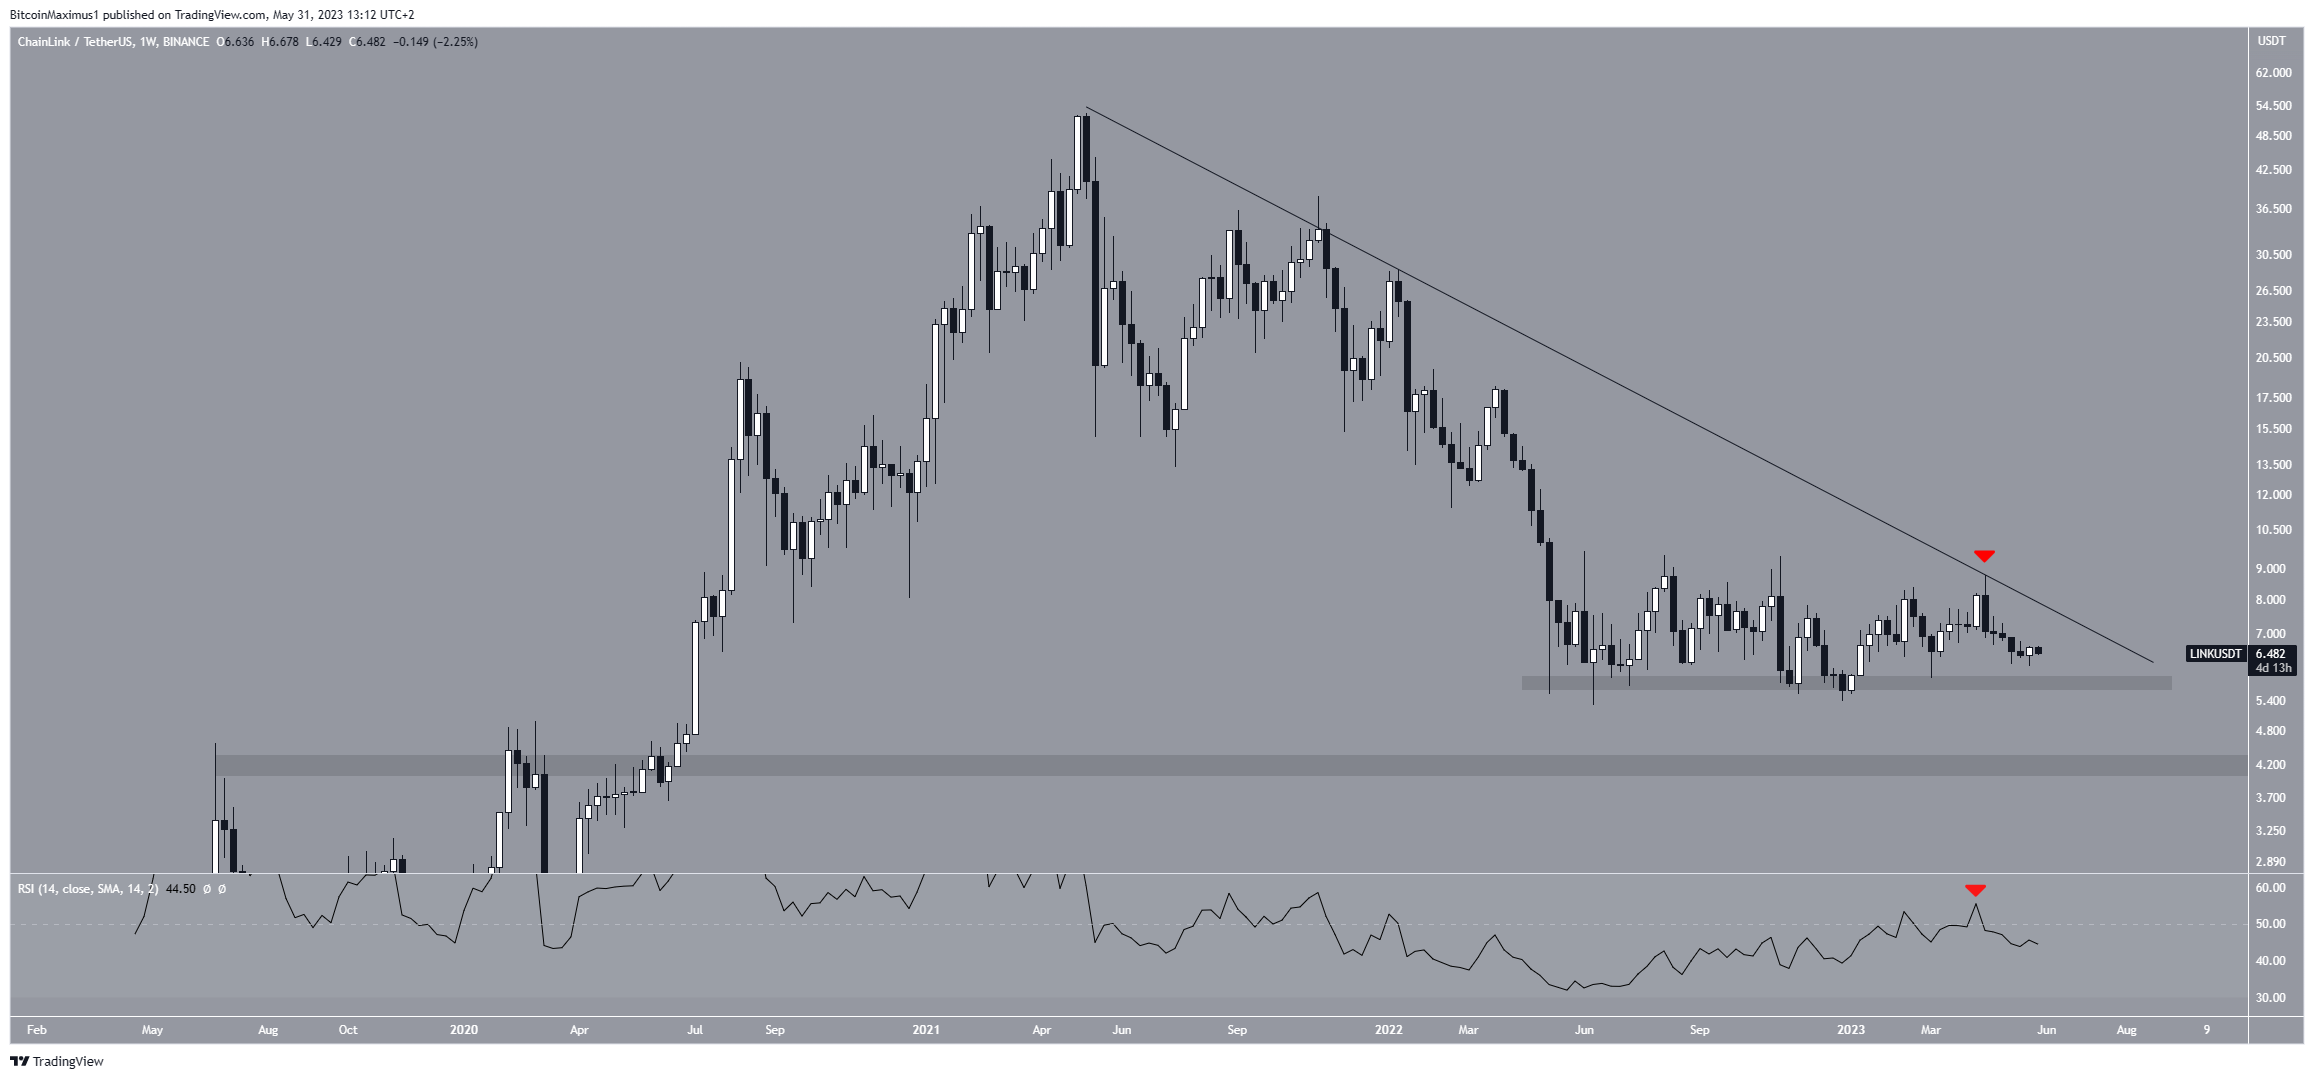
The weekly RSI provides a bearish outlook. The RSI is a momentum indicator used by traders to evaluate whether a market is overbought or oversold and to determine whether to accumulate or sell an asset.
Readings above 50 and an upward trend suggest that bulls still have an advantage, while readings below 50 indicate the opposite. The RSI was also rejected by the 50 line at the same time the descending resistance line rejected the price.
LINK Price Prediction: Is a Bounce on the Cards?
Unlike the long-term outlook, the technical analysis from the daily time frame provides a more bullish outlook. The main reason for this is the RSI.
The indicator has generated bullish divergence (green line) since May 9, while the price has completed a double bottom pattern. A bullish divergence occurs when a momentum decrease does not support a price decrease.
It often leads to significant upward movements.
Where could Chainlink (LINK) price be in the coming years?
Checkout BeInCrypto’s in depth price prediction article below:
If an upward movement occurs as a result of the divergence, the price could move to the 0.5-0.618 Fib retracement resistance levels at $7.44 and $7.76.
This area also coincides with the long-term descending resistance line. As a result, it will likely be difficult for the price to break out from it.
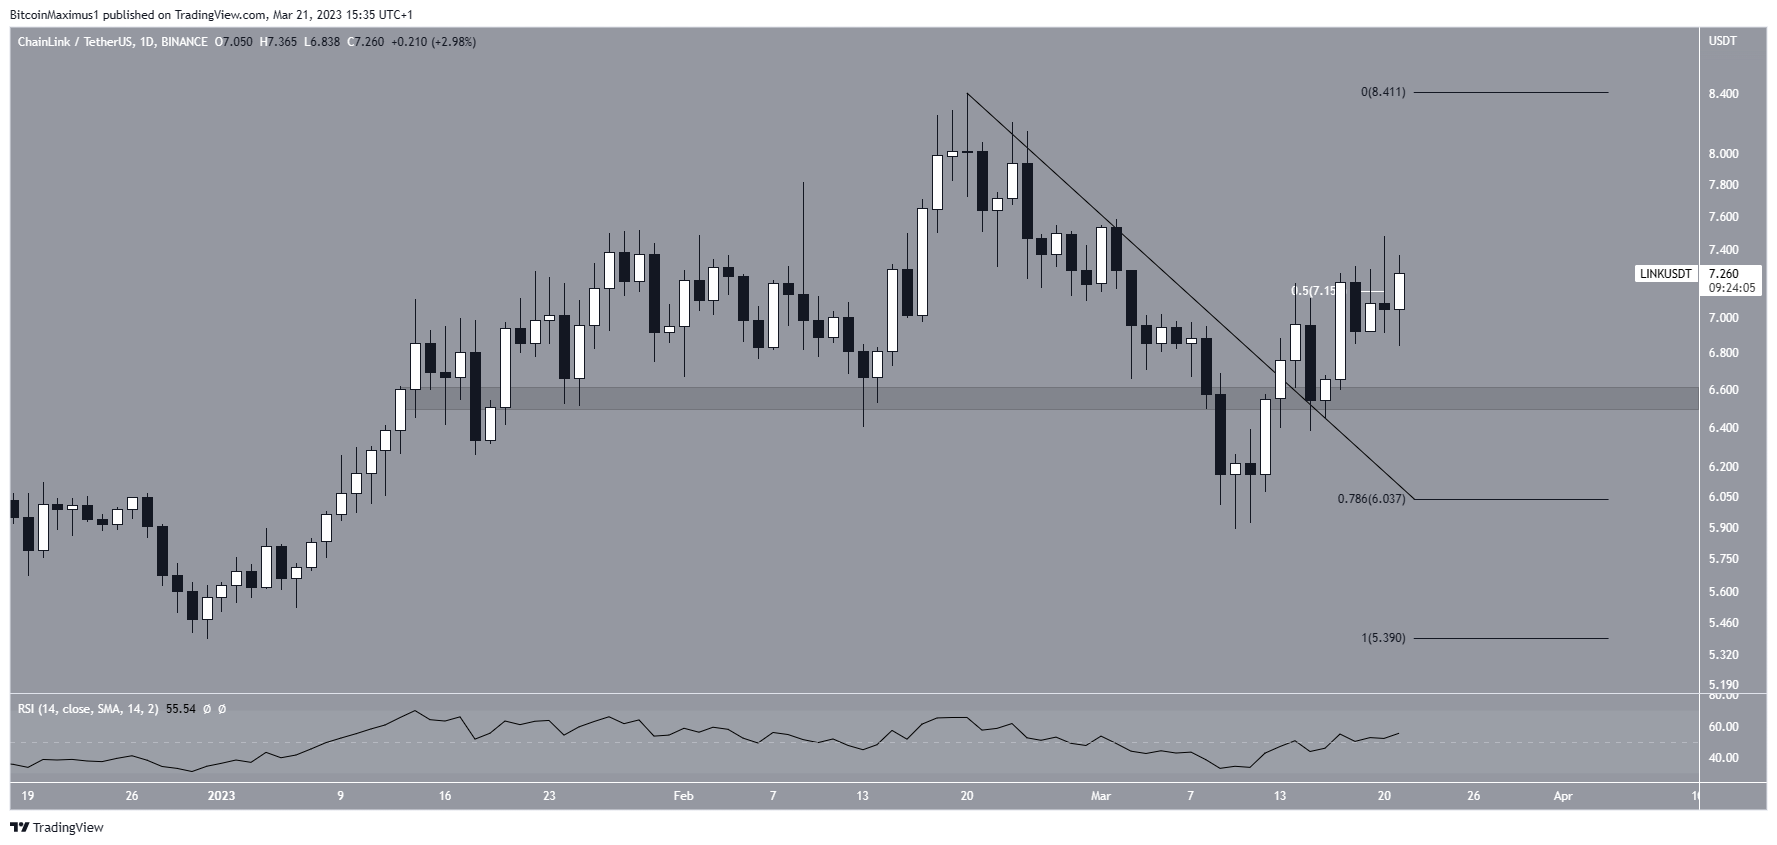
Despite this bullish short-term LINK price prediction, a daily decrease below $6.20 will mean that even the short-term trend is bearish.
In that case, the price could fall to the long-term $5.60 horizontal support area.



