Oracles are vital cogs in the web3 wheel. However, singular data oracles that feed information into blockchains aren’t always open to disputes and challenges. UMA — the protagonist of this UMA price prediction model — aims to change that with an Optimistic Oracle setup. With this innovation, UMA plans to make the Oracle data more transparent and error-free — all while helping build a diverse web3 ecosystem. And the project’s native cryptocurrency — the UMA token — looks to be a good investment option courtesy of the mentioned ingenuity. So, what is the potential future price of UMA? Let’s take a look.
NOTE: This article contains out of date figures and information. It will be updated with fresh analysis for 2025 and beyond in the New Year. In the meantime, please see our UMA price prediction tool for the most recent, data-informed projections.
- Is UMA a good investment, fundamentally?
- The price of UMA and its tokenomics
- UMA price prediction and the on-chain metrics (2022 insights)
- UMA price prediction using technical analysis
- UMA (UMA) price prediction 2023
- UMA (UMA) price prediction 2024
- UMA (UMA) price prediction 2025
- UMA (UMA) price prediction 2030
- UMA (UMA’s) long-term price prediction until the year 2035
- Is the UMA price prediction accurate?
- Frequently asked questions
This article may be outdated, we suggest you visit our new UMA Price Prediction tool.
Is UMA a good investment, fundamentally?
UMA is an acronym, standing for Universal Market Access. But is UMA — seemingly one of the better options for delivering real-world information to blockchains — fundamentally a good project? To answer this question, we will need to see more of what is achievable with the Optimistic Oracle setup.
Did you know? UMA facilitates communication between blockchain and real-world data by making the Oracle approach open to disputes. Therefore, if incorrect data is being served, UMA network participants can intervene and fix it. This approach makes the ecosystem open to building data-driven web3 products.
But that’s not all that makes UMA desirable:
- It brings promotes the concept of priceless financial contracts. Here, smart contracts handle DeFi activities like liquidation and issue resolution without an over-dependence on Oracles.
- With UMA, parties and individuals can create Ethereum-specific synthetic assets.
- As oracles are open to disputes, UMA brings forth the concept of decentralized oracles.
- Real-world assets like stocks are open to usage as synthetic assets on UMA. This works via trustless tokenization and an open DVM (Data Verification Mechanism).
Overall, the trustless nature of priceless financial contracts and a transparent and open verification method allows users to create synthetic assets in the UMA ecosystem. If adoption grows, UMA could become the go-to chain for someone looking to experience real-world assets on the blockchain.
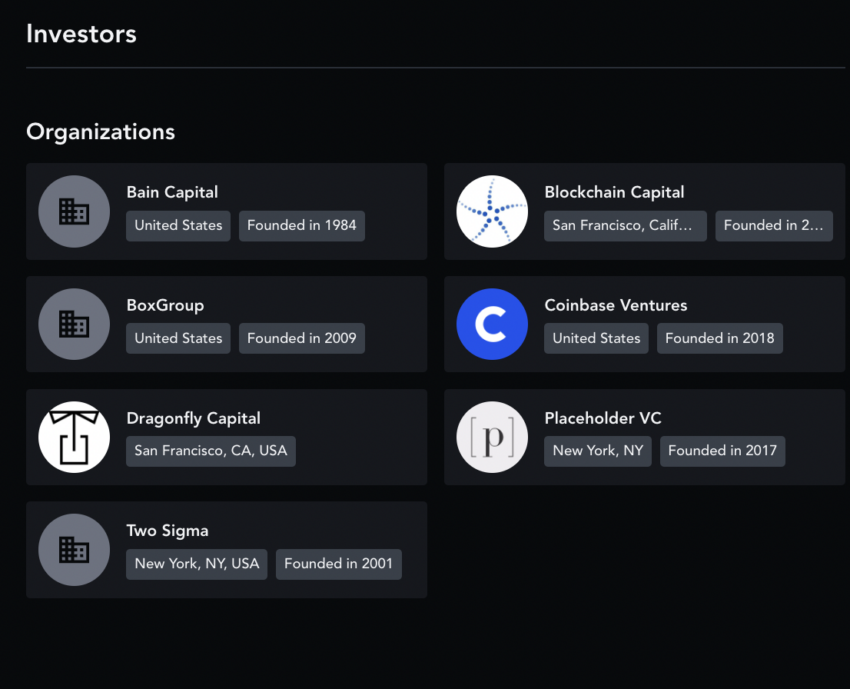
The project looks innovative fundamentally, opening a new avenue to web3 exploration. Coinbase Ventures is one of the leading investors in UMA, which we will take as a positive sign.
The price of UMA and its tokenomics
Before we go deep into tokenomics, it’s important to touch on the utility of the UMA token. Firstly, it is a means of reward to holders who actively participate in data verification. Therefore, more UMA will come into circulation if the number of disputes increases.
The UMA token is also linked to network governance, making its role even more important in shaping the ecosystem’s future.
Yet, there is a dispute resolution reward, which makes UMA a tad inflationary — 0.05% inflation per vote if issues require resolving. It will be interesting to see what happens to this inflation rate when 100% of the tokens get unlocked.
However, there are some causes for concern when the holding patterns are considered. The top 100 UMA holders, as of December 2022, managed 95.92% of the overall supply, which might backfire if there is a market-wide sell-off.
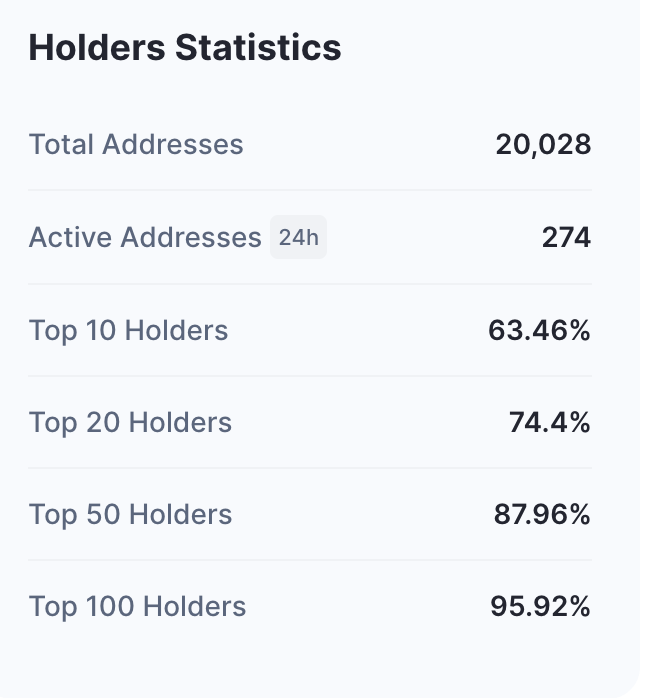
Analytics platform Intotheblock shows that the overall signal for UMA is bearish, followed by negative network growth.

UMA price prediction and the on-chain metrics (2022 insights)
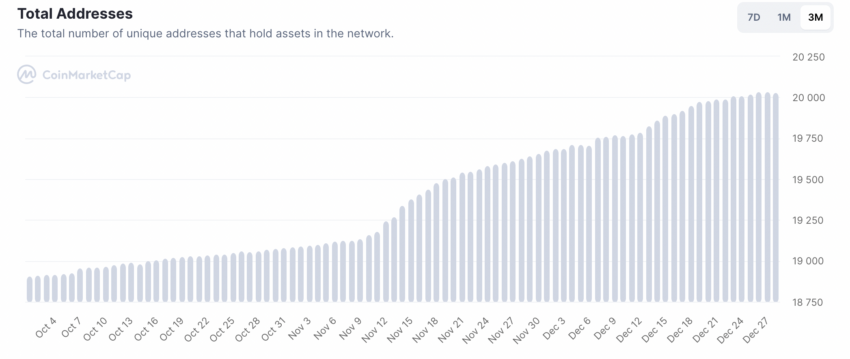
A good thing about UMA is that unique addresses increased in the final quarter of 2022. While this might be UMA whales taking positions, we are optimistic that it’s an ecosystem-wide holding pattern.
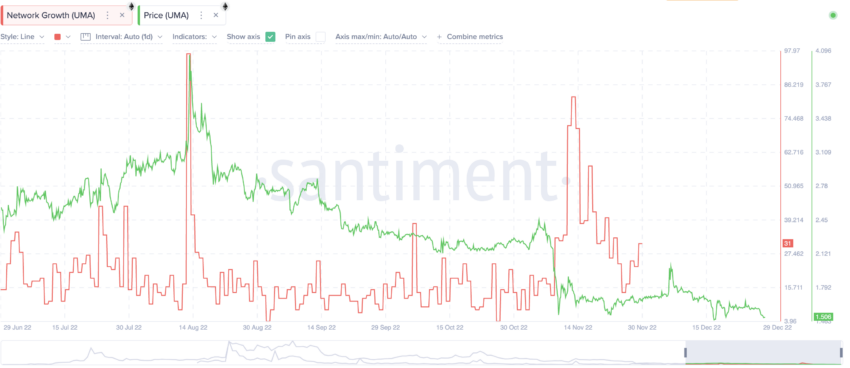
The network growth has been steady, with the peak visible somewhere around mid-November 2022. Looking at the network growth chart closely, it’s clear that prices dropped after the peaks (even the August one). Sustained growth in network activity might be required to push the price of UMA up.
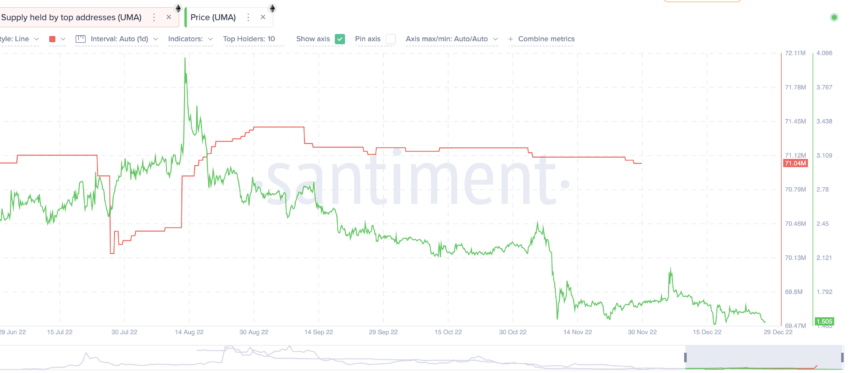
We mentioned earlier that the top 100 UMA holders hoard most of the supply. Here is a chart from 2022 that shows that while they haven’t been dumping, the price of UMA tokens is still nosediving. Also, it was in late July 2022 when the top address supply dropped, and the prices responded positively. Hence, we can expect additional price surges if the supply held by top addresses drops.
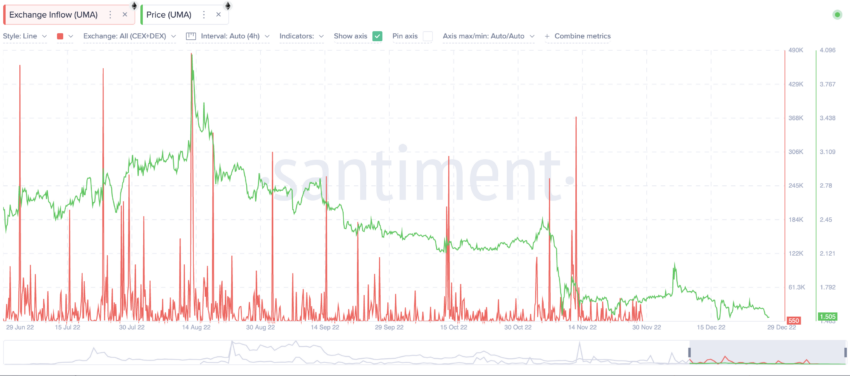
However, there were no near-term exchange inflows in 2022 to show that top addresses are considering dumping UMA. Hence, we expected the prices to trade range-bound for a while before exploding and it did explode.
UMA price prediction using technical analysis
We have looked at the fundamentals, tokenomics, and on-chain insights for UMA. We can now check for patterns while gauging UMA price movements.
Here is the daily chart showing a very clear pattern:
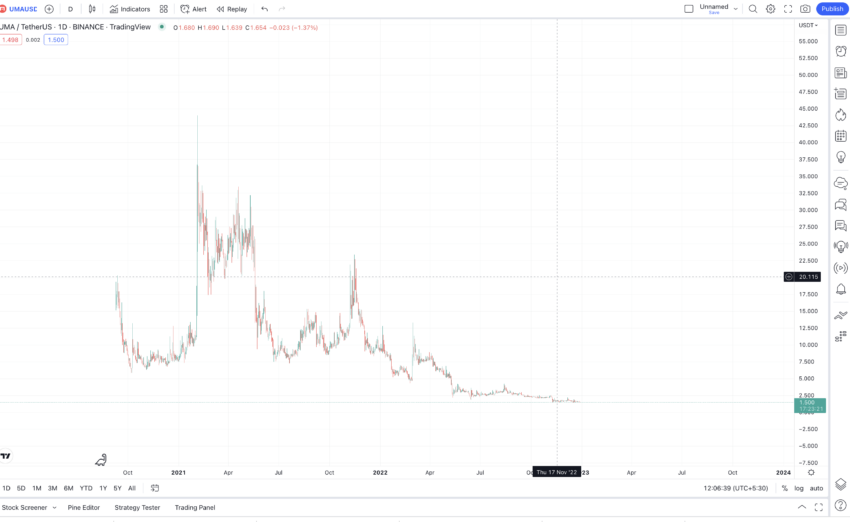
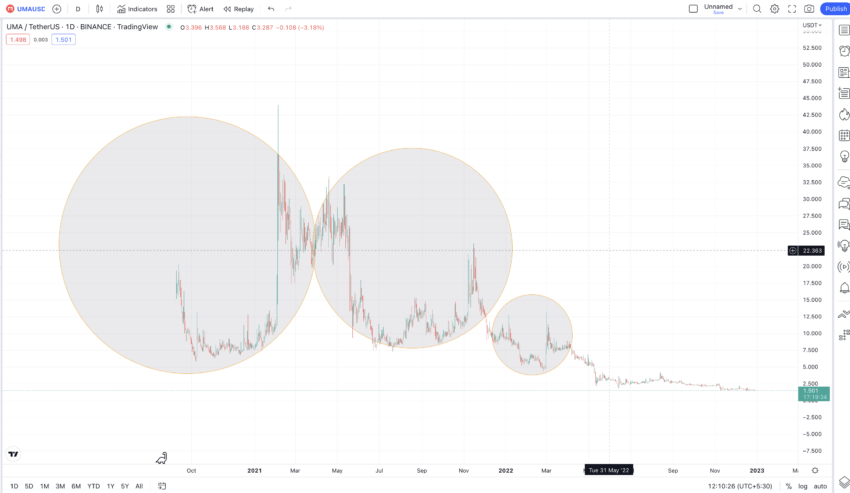
UMA makes a high and then forms a bottom to make another high. Three such isolated patterns are visible, as shown by the areas in circles.
Price changes (Inter-pattern)
We must take each pattern and find the distance between the first and second high. We must also locate the bottom and average the same to find the next possible pattern and subsequent price points.
Pattern 1 (data set 1): (Points include A, M, and B)
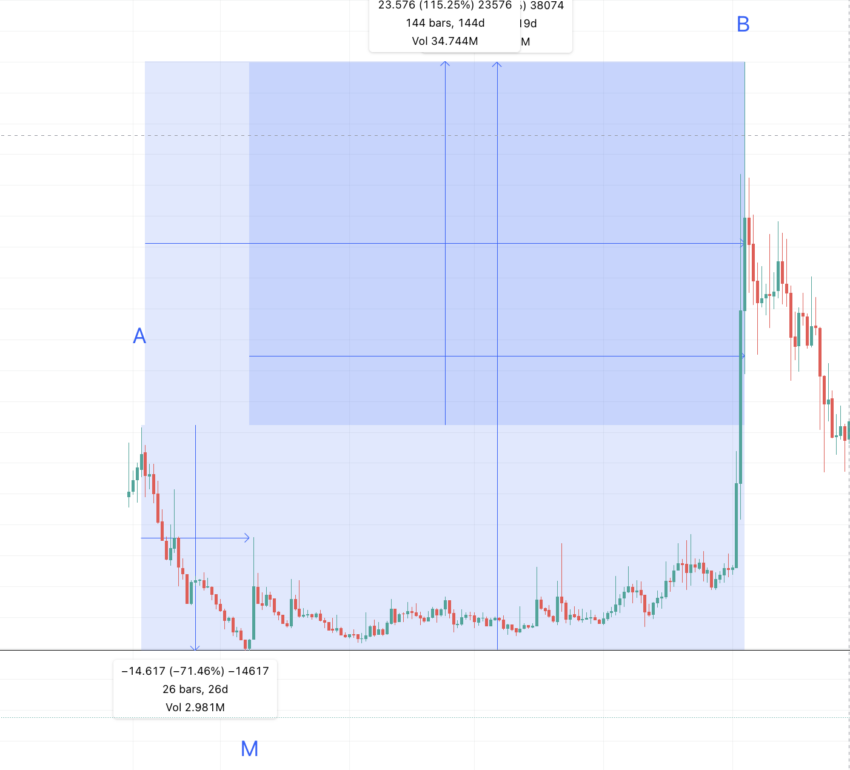
A to M = 26 days and -71.46% price change; M to B = 119 days and 645.60 price change; A to B = 145 days and 115.25% price change.
Pattern 2 (data set 2): (Keeping points as A, M, and B for the sake of symmetry)
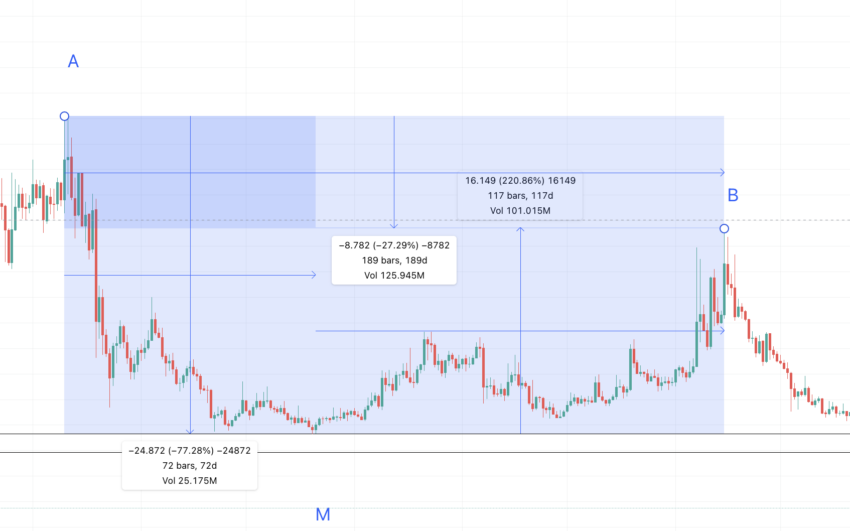
A to M = 72 days and -77.28% price change; M to B = 117 days and 220.86% price change; A to B = 189 days and -27.29% price change.
Pattern 3 (data set 3) : (Keeping points as A, M, and B for the sake of symmetry)
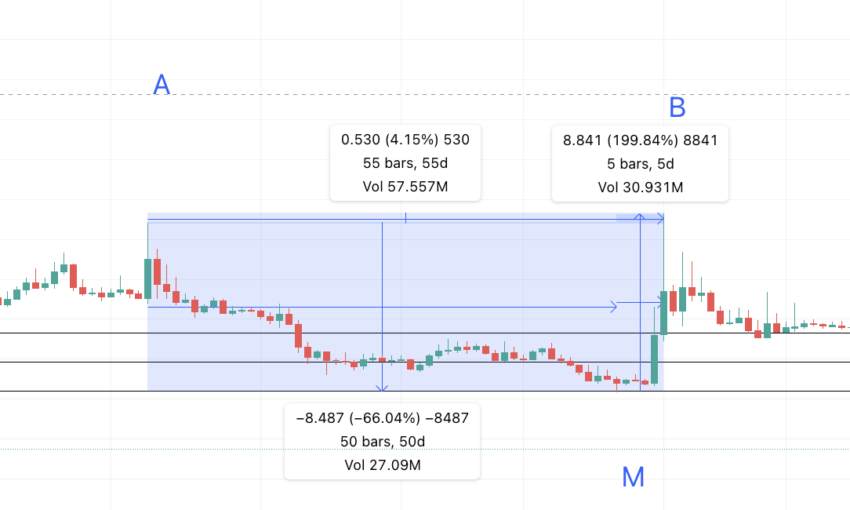
A to M = 50 days and -66.04% price change; M to B = 5 days and 199.84% price change; A to B = 55 days and 4.15% price change.
Price changes (Inter-pattern)
The distance between the first pattern’s B and the second pattern’s A; and the second pattern’s B and the third pattern’s A; is important to locate the next high.
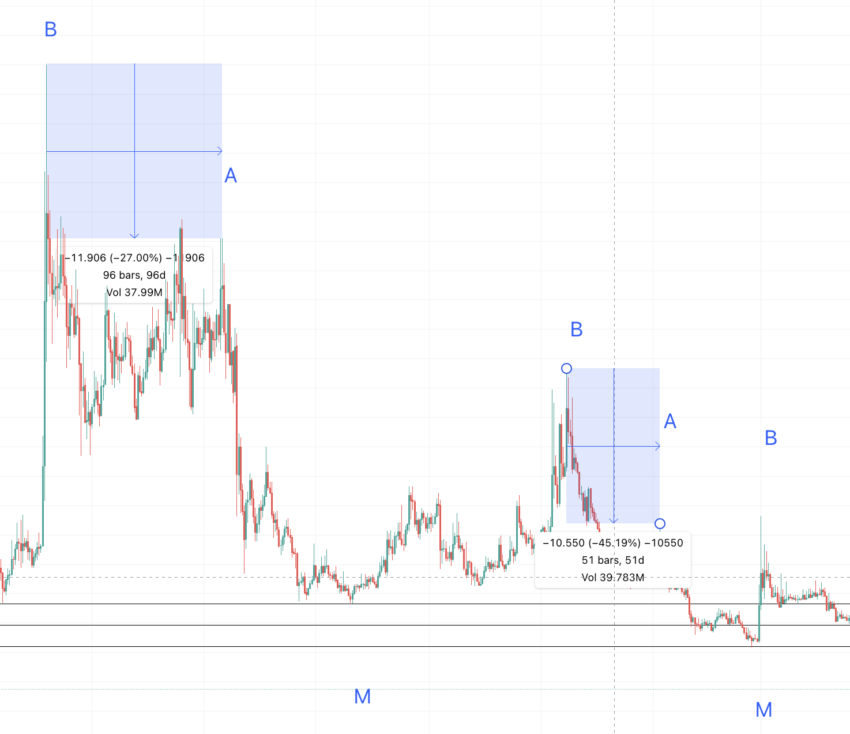
Pattern 1’s B to Pattern 2’s A: 96 days and -27.00%
Pattern 2’s B to Pattern 3’s A: 51 days and -45.19%
So the next B to A could be in 74 days and at a dip of 36.09% from the B of the third pattern. Drawing the forecast line puts the level at $6.92, which looks like a high and is in the average range.
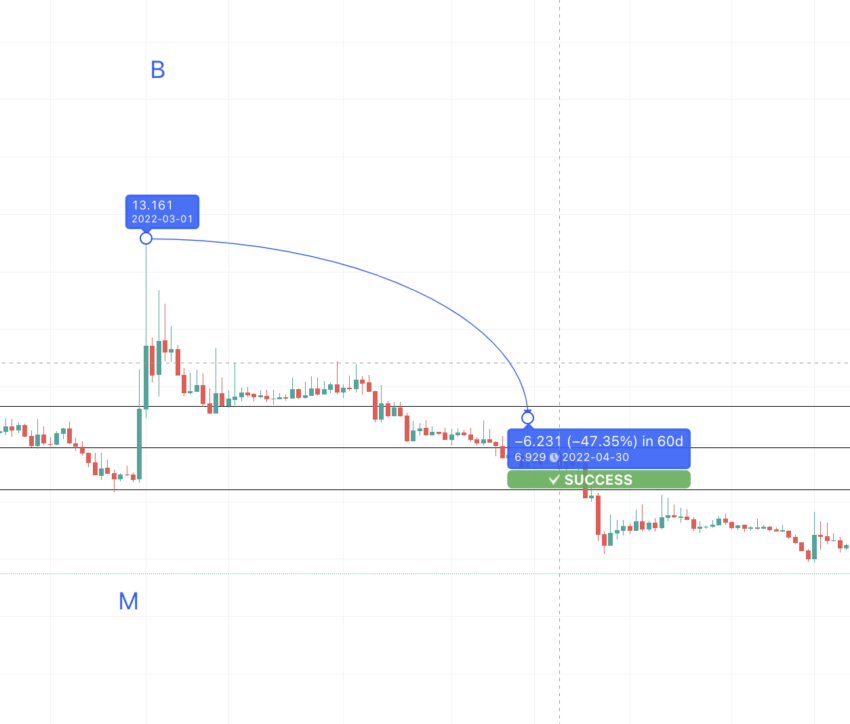
This shows our price analysis is following the correct path thus far. If this point is the new A, we can visually locate the M and B.
So pattern 3’s B to Pattern 4’s A: 60 days and -47.35%.
The average dip from Pattern 4’s B to Pattern 5’s A can be around 40%. The distance will depend on the crypto market conditions. We may have successfully located another A at $2.52 around early November.
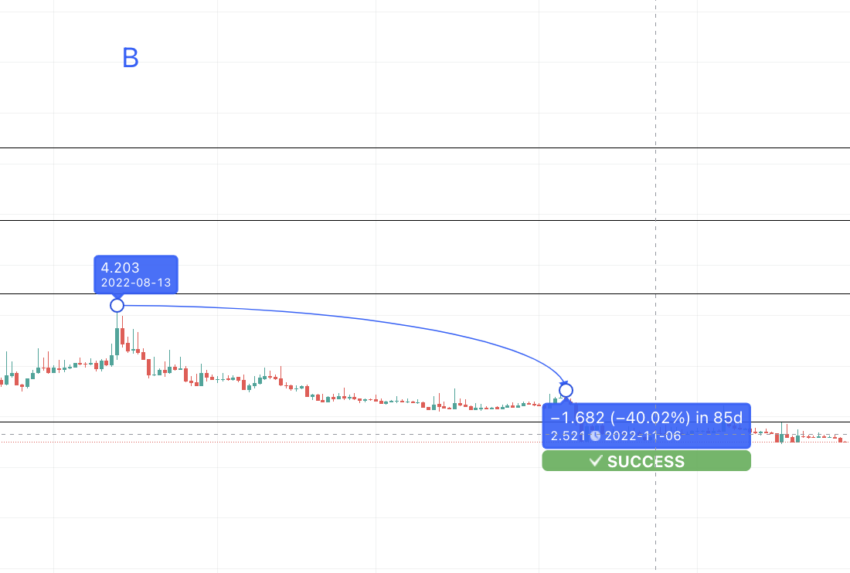
Now, if we take the average data of all the A to M levels using the tables above, we get the price change and distance as 49 days (max 72 days) and a drop of 71.59%. The level surfaces at $0.713. Therefore, in 2023, we can expect a quick correction at UMA’s counter.

UMA (UMA) price prediction 2023
Notably, UMA did move according to our price prediction for 2023. However, the surge came a tad late, in January 2024, which is normal in the cryptocurrency space. Here is how we analyzed:
We do not expect UMA to drop below the early 2023 low at $0.713. The next task is to take the average of the M to B values using the tables above.
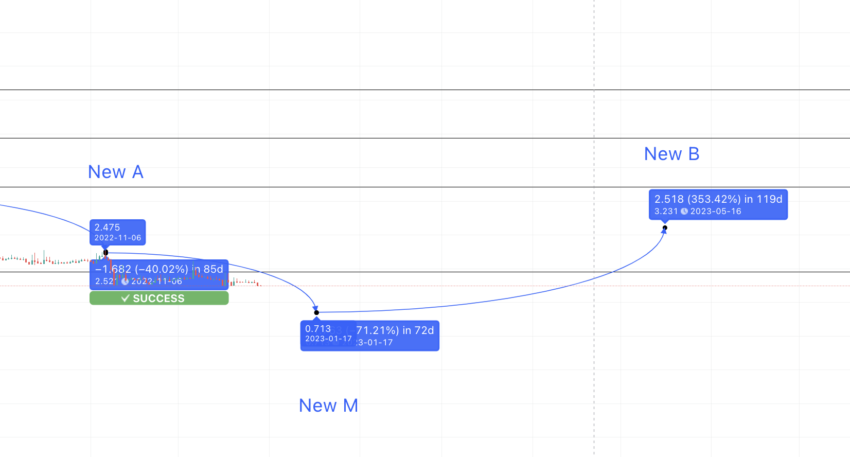
The average price change comes out to be: 355.43% from the last low or new M. The distance can be as high as 119 days as we are still in a bear market. Now, if we draw the path from the New M or $0.713, the New B can surface at $3.21 in mid-2023.
UMA (UMA) price prediction 2024
Outlook: Bullish
We will assume UMA continues to follow the same pattern. If so, we can find the next low or another A, at a nearly 40% drop from the last B. This level shows by late 2023 and surfaces at $1.93.
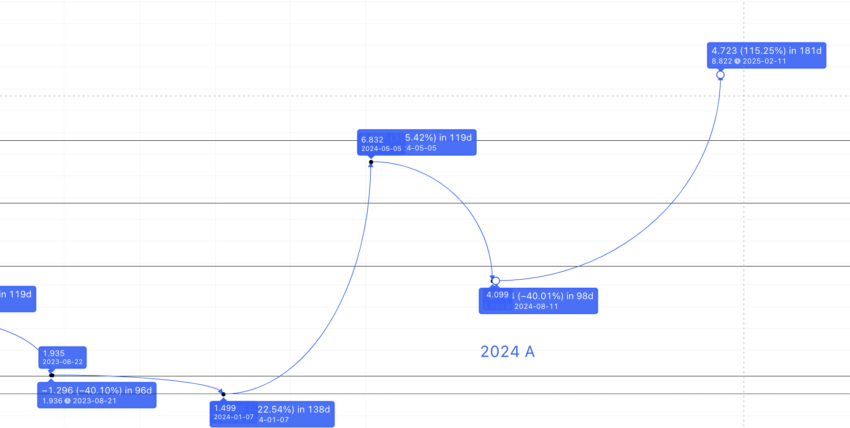
This can be the price reference for the UMA price prediction 2024 model. The minimum price of UMA by late 2023 or early 2024 can surface at $1.499. This aligns with a strong support zone. The high in 2024 can therefore be at 355.43% from the M or from $1.499.
The level shows at $6.826 in 2024. However, the clear low in 2024 can drop 40% from the high of $6.826 and within 96 days max. Hence, we plot the low at $4.09. Let us mark this as the 2024 A.
Projected ROI from the current level: 60%
UMA (UMA) price prediction 2025
Outlook: Bullish
Now, head over to the data sets above to find the distance and price change percentage between A and B.
This surfaces in 130 days (max 189 days) and at a percentage growth of 30.70% (max 115.25%). Therefore, the 2025 high surfaces at $8.82 in 2025. We can mark this as 2025 B. According to the UMA price prediction model for 2025, the low can surface at $5.876, which coincides with a strong support level.
Projected ROI from the current level: 105%
UMA (UMA) price prediction 2030
Outlook: Very bullish
Now that we have the high for UMA tokens in 2025 and even the minimum price in 2024, we can connect the points using the Fib levels. Connecting the 2024 A and the 2025 B extrapolates the UMA token prices to $52.45 by mid-2030.
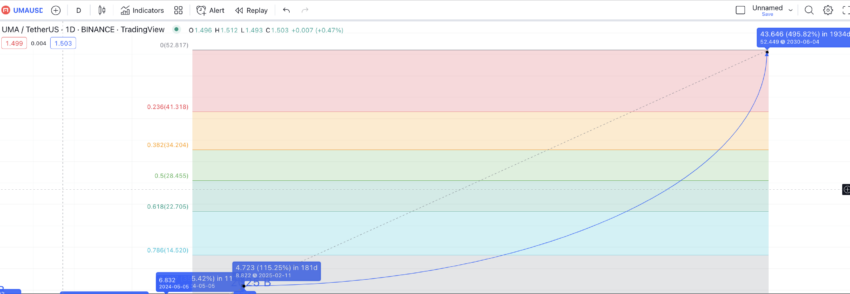
For the price of UMA to reach these levels and thus become a good investment decision, UMA should be able to cross $35 by 2029. If we keep this growth curve in mind, by early 2030, UMA should breach its previous all-time high price of $43.37. This was previously reached on Feb. 4, 2021. This level can act as a support for the low in 2030.
Therefore, it will take this Synthetic asset and real-world data platform nine years to make a new all-time high.
Projected ROI from the current level: 1119%
UMA (UMA’s) long-term price prediction until the year 2035
Outlook: Very bullish
Our UMA price prediction puts the UMA coin price at a new high by 2030. However, if you are a HODLer interested in UMA beyond 2030, here is a table to refer to.
You can easily convert your UMA to USD
| Year | Maximum price of UMA | Minimum price of UMA |
| 2024 | $6.826 | $4.09 |
| 2025 | $8.82 | $5.876 |
| 2026 | $13.23 | $8.20 |
| 2027 | $18.52 | $11.48 |
| 2028 | $31.48 | $19.51 |
| 2029 | $37.77 | $29.46 |
| 2030 | $52.45 | $43.37 |
| 2031 | $68.18 | $53.18 |
| 2032 | $88.64 | $69.13 |
| 2033 | $106.36 | $82.96 |
| 2034 | $127.64 | $99.55 |
| 2035 | $159.55 | $124.44 |
Do note the highs and lows for any given year can vary depending on the state of the crypto market. Therefore, the technical analysis for UMA (Universal Market Access) tokens might change accordingly.
Is the UMA price prediction accurate?
UMA, a decentralized ecosystem where smart contracts take center stage, thrives on users’ willingness to create synthetic assets. With enterprises planning to bring stocks, commodities, and other real-world assets into the blockchain, this UMA price prediction model makes sense. It doesn’t only track the technical analysis but also aligns the price predictions with fundamentals and on-chain insights. Therefore, considering general economic and crypto market volatility, we are confident that this UMA price prediction piece is as accurate as possible.
Frequently asked questions
Is Uma a good investment?
How high can UMA go?
What will UMA be worth in 2030?
Who owns UMA?
What is UMA used for?
Disclaimer
In line with the Trust Project guidelines, the educational content on this website is offered in good faith and for general information purposes only. BeInCrypto prioritizes providing high-quality information, taking the time to research and create informative content for readers. While partners may reward the company with commissions for placements in articles, these commissions do not influence the unbiased, honest, and helpful content creation process. Any action taken by the reader based on this information is strictly at their own risk. Please note that our Terms and Conditions, Privacy Policy, and Disclaimers have been updated.


