

In a world where centralized exchanges are causing seemingly endless problems, DEXs look to be the future. This is good news for SushiSwap — a decentralized exchange where smart contracts manage buying and selling assets. While SushiSwap is functional on its own, its native crypto, the Sushi token, comes with several ecosystem-specific use cases. But is the token a savvy investment? This SushiSwap price prediction will consider the merits of buying SUSHI and track the token’s likely future price path.
Most importantly, SUSHI, the native token of the ecosystem, managed to climb as high as $1.55 in 2023, aligned rather well with our generous price prediction levels. Let us now explore everything there is to know about 2024 and its future!
Want to get SUSHI price prediction weekly? Join BeInCrypto Trading Community on Telegram: read SUSHI price prediction and technical analysis on the coin, ask and get answers to all your questions from PRO traders! Join now
- Sushi price prediction and the role of fundamental analysis
- Tokenomics and the price of SUSHI
- SUSHI price forecast and other key metrics
- Sushi price prediction and technical analysis
- SushiSwap (SUSHI) price prediction 2023
- SushiSwap (SUSHI) price prediction 2024
- SushiSwap (SUSHI) price prediction 2025
- SushiSwap (SUSHI) price prediction 2030
- SushiSwap (SUSHI’s) long-term price prediction until 2035
- Is this SushiSwap price prediction model accurate?
- Frequently asked questions
This article may be outdated, we suggest you visit our new SushiSwap Price Prediction tool.
Sushi price prediction and the role of fundamental analysis
Before we move into the technical analysis, we must look at the important fundamental pointers relevant to SushiSwap:
- SushiSwap has a token vault, letting users store tokens and generate passive income.
- You can swap any ERC-20 crypto with another on the SushiSwap exchange.
- Kashi, a DApp on SushiSwap, lets users borrow and lend crypto easily.
- Sushibar — an exclusive product on SushiSwap — lets users stake crypto.
- SushiSwap was launched by Chef Nomi — a pseudonymous entity with absolutely no social presence.
- Apart from Chef Nomi, SushiSwap is associated with other pseudonymous bodies, including Maki.
As of January 2023, Sushi ranked 18th in terms of DeFi TVL. The network was initially envisioned as a hard fork of UniSwap but with better functionality courtesy of its native token, SUSHI.
Did you know? SushiSwap isn’t just a DEX but also boasts a community-driven platform called BentoBox — acting as a DeFi vault.
At that time, SushiSwap was exposed to more than 20 chains and had $450.59 million of total value locked.
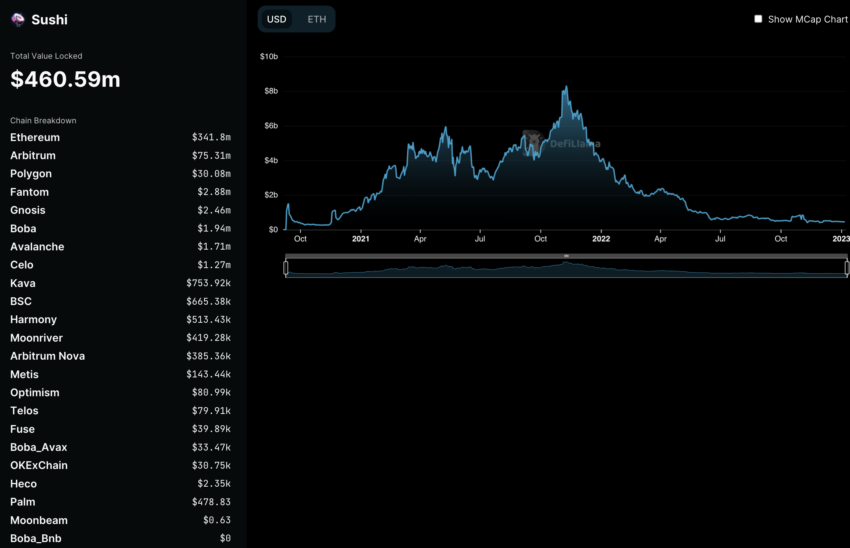
Let us now compare with things in December 2023:

As of today, Sushi is ranked 35 and has a TVL value of $502.95 million. Even though the TVL has marginally increased, what’s heartening is the exposure to 32 chains instead of 20. This kind of steady growth could be good news for the price action.
Tokenomics and the price of SUSHI
Firstly, SUSHI works as the governance token of the SushiSwap network. Holding the token can offer access to the development table. Plus, it supports staking and holds relevance as the network usage reward.
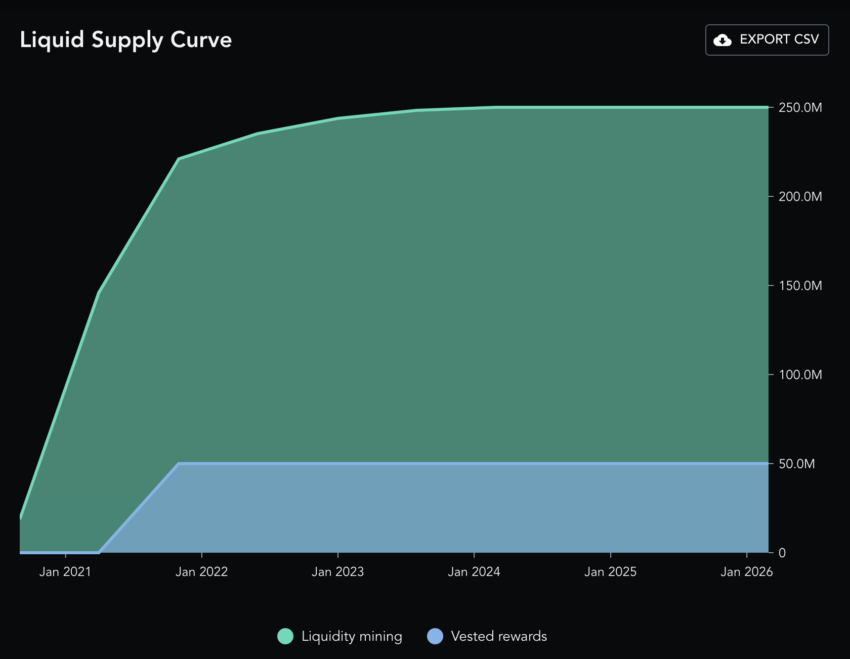
However, the token model is inflationary, albeit with decreasing overall issuance. The total supply is 250 million, with 89% making the current circulating supply. The fixed supply model could help push prices higher post-2026 when the entire supply is expected to be unlocked.
SUSHI price forecast and other key metrics
Projecting the future price of Sushi tokens is possible if we can track the standard network growth metrics. The first metric is the active address count. The 90-day chart, as of early 2023, shows that the addresses peaked in November and resulted in a price drop. This development could have been due to the increased selling pressure.
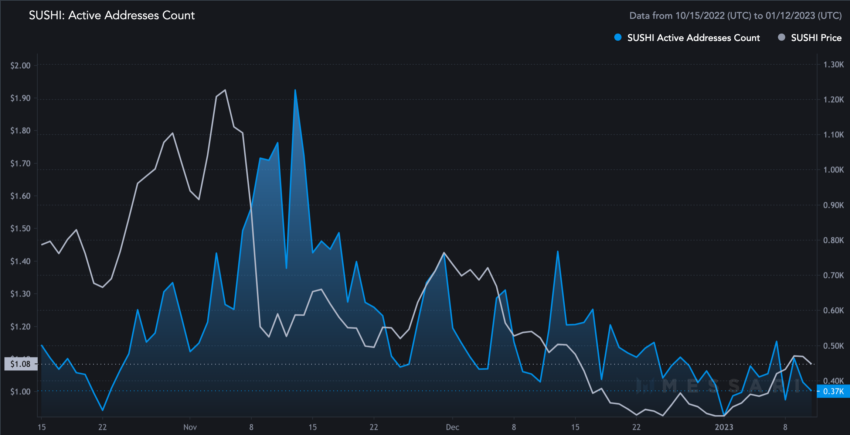
If we compare this stat with that of December 2023, there has been a steady increase in the number of active addresses but with a surge in prices. This shows a holding pattern.
Even the SushiSwap analytics show that only 55.86% of the total supply is controlled by whales, and almost 74% of the addresses are HODLers — showing an anti-offloading trend.

“I hope that SushiSwap continues to evolve. Don’t let my mistake deter it from being a 100% community-run AMM. The success of SushiSwap will set a precedent for many more community-run projects.”
Chef Nomi: Founder of SushiSwap
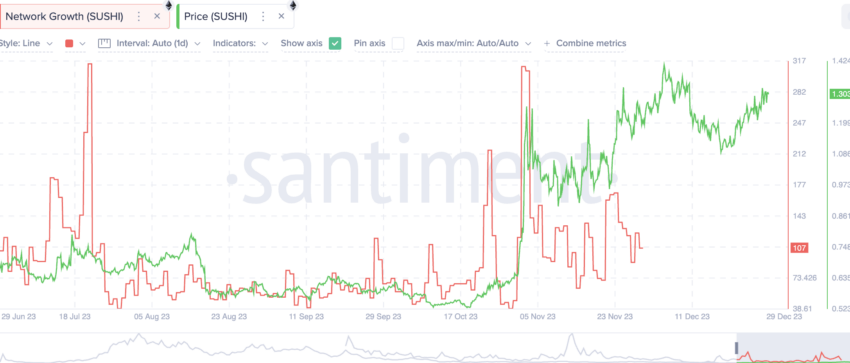
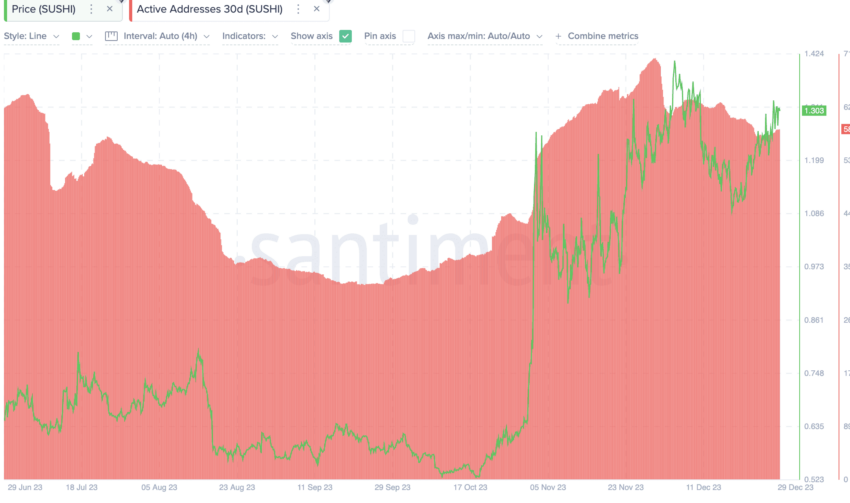
Network activity preceded the price rise in November 2023 but quickly fizzled out. However, price surges during network activity peaks are clear. This could be positive for the long-term future price of SUSHI.
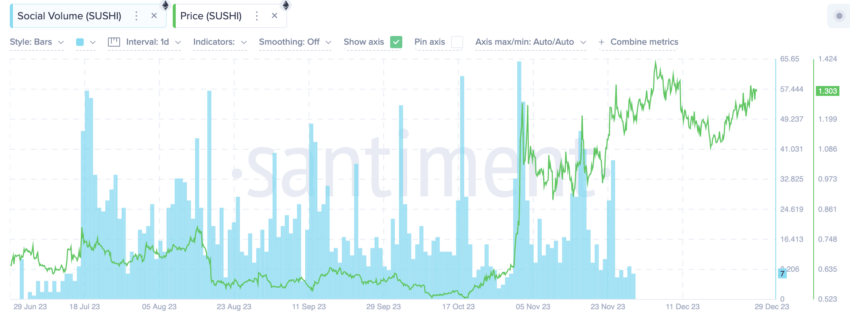
The social volume chart hints at a significant development pattern. The price of SUSHI increases often with the social chatter peaks. Therefore, it would be advisable to keep an eye on the social volume of Sushi tokens to predict a possible price surge.
Sushi price prediction and technical analysis
Before we get to the price of SUSHI, especially the price action, here are a few insights to keep in mind:
- SUSHI reached an all-time high price of $23.38 on March 13, 2021.
- The minimum price was recorded at $0.4737 on Nov. 4, 2020.
- SushiSwap’s market cap peaked on March 14, 2021, a day after reaching the maximum price. $2.91 billion was the recorded market capitalization at the peak.
- The trading volume during the maximum market cap was $654.69 day-on-day.
- As of December 29, 2023, the recorded market cap and trading volume were $302 million and $76.25 million, respectively.

The turnover ratio (trading volume to market cap) was higher at the current levels, showing that the volatility at SUSHI’s counter might decrease. This is optimistic for the token’s short-term price action.
Short-term price chart of SUSHI: Early 2023 analysis
In 2023, we predicted a crucial resistance of $1.49, and SUSHI only managed to breach it with minimal conviction. Here is what the early 2023 analysis comprised:
The daily price chart of SUSHI reveals an interesting pattern. The price is moving inside a descending triangle formation. However, SUSHI, like every other digital asset in this crypto market, is in a downtrend. So, the upper trendline of the mentioned pattern might kickstart a trend reversal of sorts.
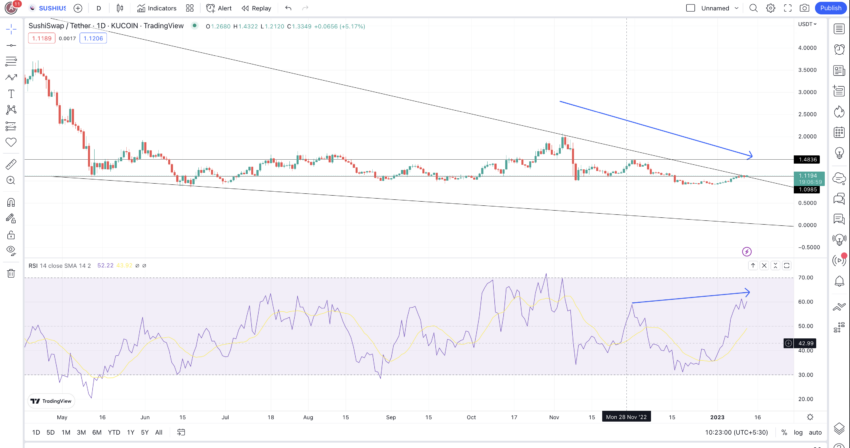
For that, SUSHI would need to keep trading at the current levels and first breach the $1.49 levels with high volumes. The RSI (Relative Strength Index), or the momentum indicator, is trading above its 14-day moving average line (yellow). Plus, there is a clear bullish divergence, with the RSI making higher highs and the price of SUSHI making lower highs.
Hence, in the short term, the price action of SUSHI looks investor-friendly. And the prices did surge. But the bulls couldn’t keep up.
Our December 2023 analysis
If we delve deeper into the December 2023 chart, the flag-and-pole pattern formation is pretty clear. SUSHI tried to breach past the upper trendline and scale higher but was restricted by the waning RSI or momentum and low volume levels. A breach past the $1.50 mark should propel SUSHI higher. But for that, RSI needs to cross above the previous high.

Now let us move to the weekly charts:
Pattern identification
The raw weekly chart shows a clear pattern, visible even without the markings. There is a clear periodic high and a lower high formation with a rounded bottom in between. The determining factor for the SUSHI token is the formation of a rounding bottom before the next high arises.
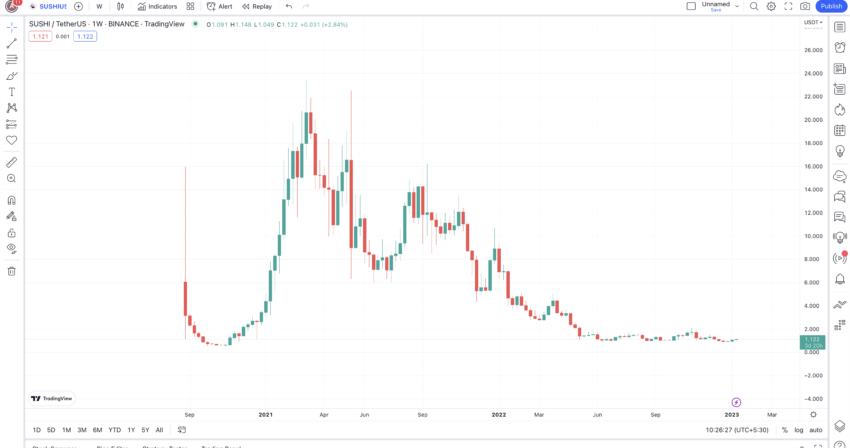
Now, we can divide the chart into two parts. Pattern 1 shows a single rounded bottom formation with a higher high. Pattern 2 looks like the extended mirror image of the same — only with multiple rounded bottom formations.
Let us now revisit the chart after marking the crucial points.
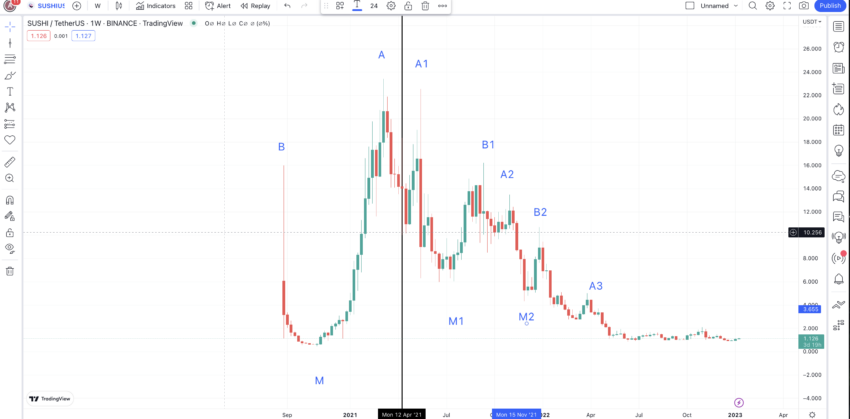
Our task is now to find the M3 (the lowest point of the next bottom) and the subsequent high B3. Now, if B3 surfaces higher than A3, we can consider a pattern reversal — the formation is similar to the left side of the vertical line. However, if B3 surfaces lower than A3, we can expect the pattern to continue.
Price changes
We can identify the distance and price change percentage between all the As, Ms, and Bs on the weekly chart.
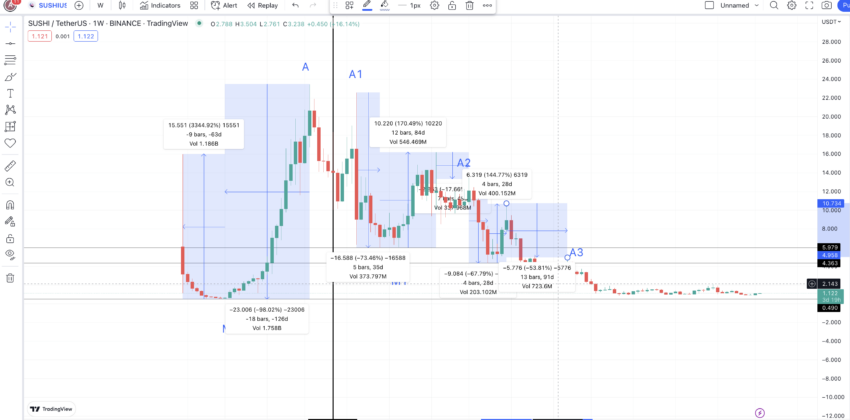
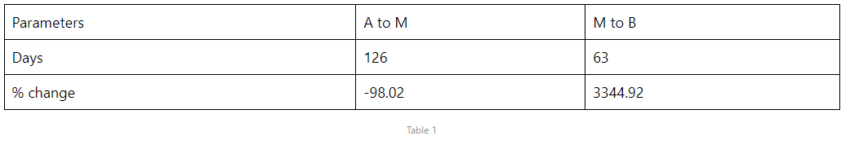
Path 1: B to A (taking in reverse as it looks like a mirror-image of the current pattern)
Path 2: A1 to A3
We’ve considered the B to A points in our analysis, as the current pattern indicates the formation of lower highs on the weekly chart.
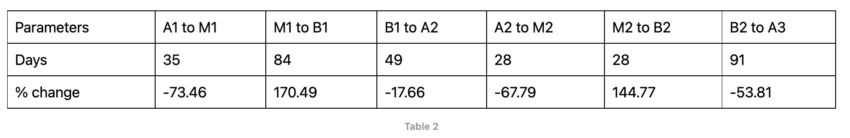
Using the data in the tables above, we can calculate the average time and percentage change between all A to M points and M to B points. The average duration from A to M is 52 days (with a maximum of 126 days), and the average price drop is -79.75% (with a minimum decrease of -67.79%).
For the M to B segment, the average time frame is 58 days (with a maximum of 84 days), and the average percentage growth is 1220.06% (with a minimum increase of 144.77%).
Note: Every calculation is based on the datasets procured from the tables above.
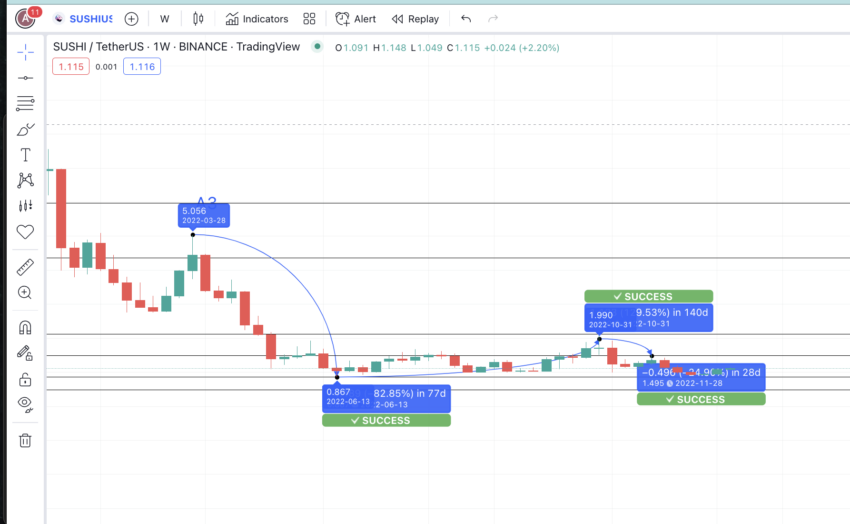
We can plot the next bottom from A3 using the A to M average. The level surfaces at $0.867 — a drop of 82.85% — almost equal to our average drop. This shows our SushiSwap price prediction is moving in the right direction. We can mark this M3.
SushiSwap (SUSHI) price prediction 2023
SUSHI is 2023 came pretty close to our predicted levels at $1.55. Here is how we approached the same:
Now we have identified M3, we can plot the path to B3 using the data from the tables above. The minimum growth from the lows is 144.77% — from Table 2. Considering the current state of the crypto market, we can expect the price of SUSHI to surface at almost $2.
Notice that SUSHI did touch this level in October 2022, when the price peaked at $1.99, breaking the important resistance of $1.62. Therefore, this point can be marked B3.
Calculation
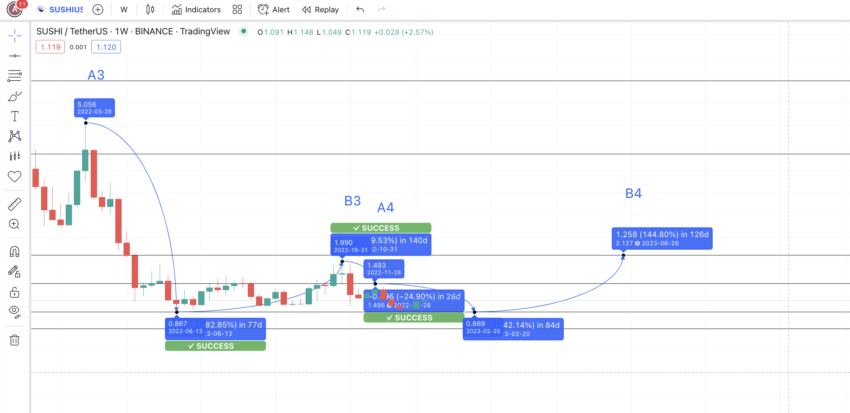
So our target shifts. We now have first to find A4, using the average distance between the Bs and As. Using the table above, the B to A distance and price change comes at 70 days and 35.74%. Also, A4 is expected to surface lower than B3 as the crypto market is still in the bearish phase, and there is no up-trending trigger as of yet.
From B3, a max drop of 35.74% and a max distance of 49 days put A4 at $1.495 — another successful level on the chart.
From A4, the drop to M4 could surface in 84 days max and at a drop of 67.79%. This expected level might be at $0.86 — which is also a strong support line and coincides with a low M3. This could also be the SushiSwap price prediction low for 2023.
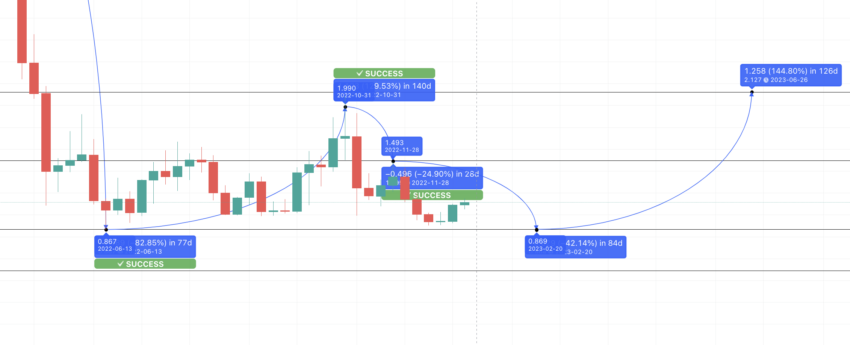
If this becomes M4, we can plot the next high or B4 at a distance of 84 days (maximum) and at a price growth of 144.77% — we have taken the minimum growth percentage due to the bearish nature of the crypto market. B4, therefore, surfaces at $2.127. This could be the maximum price prediction for SushiSwap in 2023.
SushiSwap (SUSHI) price prediction 2024
Outlook: Bullish
Note that B4, or the maximum price of SUSHI in 2023, is higher than both B3 and A4. This might start an uptrend at SUSHI’s counter.
We can consider that the next low after B4 arrives is 2023 only as A5. And after A5, we also need to consider the drop to M5. In case of an uptrend, the cumulative drop can take support at $1.495. This level might appear in (126 + 91) or 217 days — data from table 2. We can plot the same to 2024, considering the cumulative distance of B4 to M5.
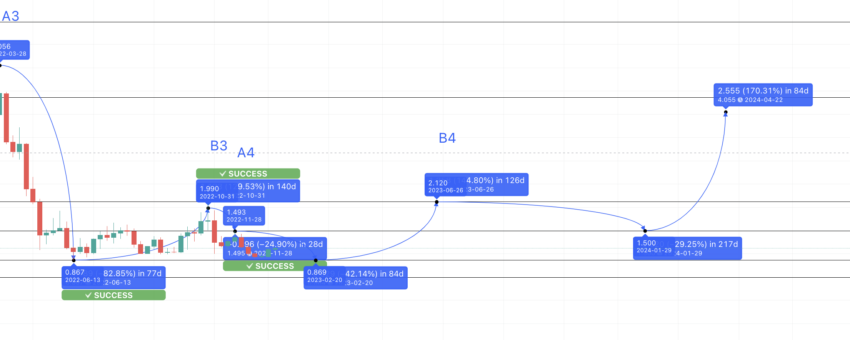
Now, from this point, M5, the next high or B5, could surface within 84 days and at a high of 170.49% — the second highest percentage change using Table 2. We have not taken the minimum price growth as, by this time, SUSHI should be in an uptrend. The level, therefore, might surface at $4.05 by early 2024.
Projected ROI from the current level: 211%
SushiSwap (SUSHI) price prediction 2025
Outlook: Bullish
The next low, M6, could take support at $2.12 — which coincides with B4. The level can surface at 217 days, which is the maximum distance between any B and the next M. From this level, the next high could be in 84 days and at a growth percentage of 170.49 — as mentioned previously. Therefore, the maximum SushiSwap price prediction for 2025 might be $5.74.
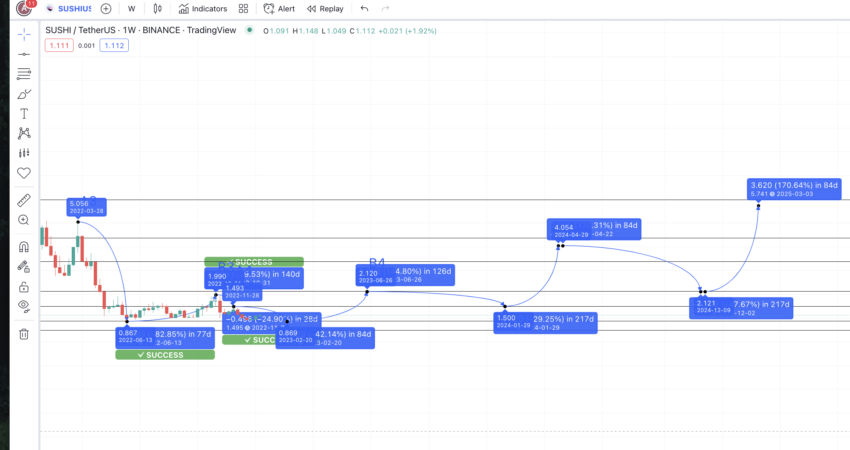
The minimum SUSHI price prediction for 2025 might surface at an important support level of $4.054 — which coincides with B5.
Projected ROI from the current level: 341%
SushiSwap (SUSHI) price prediction 2030
Outlook: Bullish
Now we have the high for 2025 and the low for 2024. So, we can connect the Fib levels to plot the distance for the SushiSwap price prediction 2030 model.
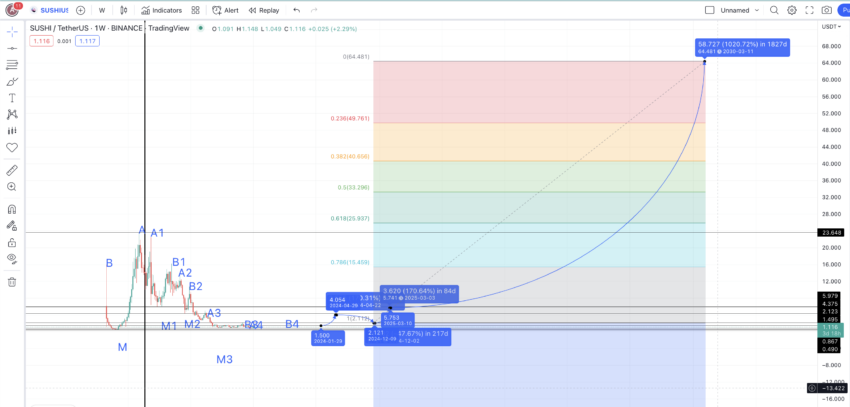
Following the same growth path puts the SUSHI 2030 high at $64.481. However, for this price forecast to hold, the price of SUSHI must cross the previous all-time high of $23.38 by 2028.
Projected ROI from the current level: 4860%
SushiSwap (SUSHI’s) long-term price prediction until 2035
Outlook: Bullish
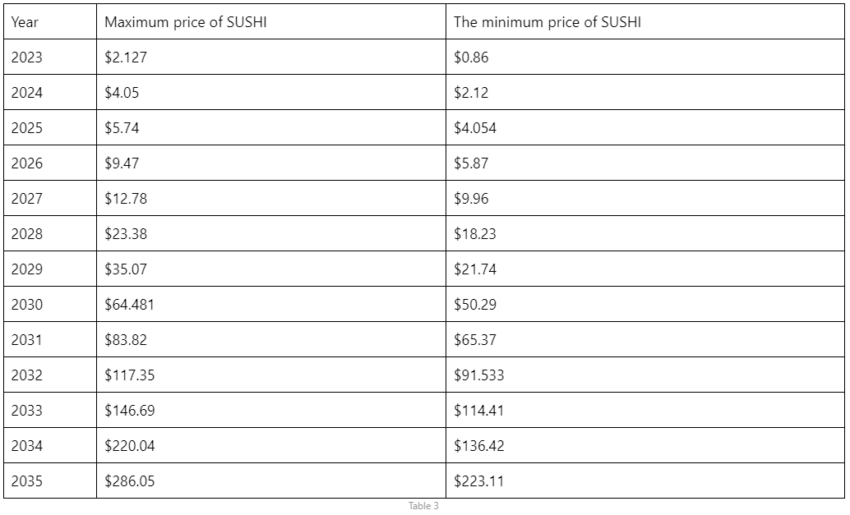
If you plan to hold SUSHI longer than 2030, here is a table that lets you trace the path until 2035. Note that a Sushi token’s price growth each year will depend on the growth of liquidity pools, user adoption, market cap, and other metrics.
You can easily convert your SUSHI to USD here
Is this SushiSwap price prediction model accurate?
This SushiSwap price prediction model utilizes significant chunks of data to conduct a descriptive and thorough technical analysis. Plus, we have also taken the short-term and long-term price action of SUSHI to forecast the future price till 2035. This SUSHI price prediction also considers the long-term potential of the ecosystem, including the room for DeFi growth and the project’s tokenomics. As such, this is a well-rounded and attainable price prediction model. Moreover, the crypto market is volatile, and it is always wise to consider annual averages instead of highs and lows.
Frequently asked questions
Can SushiSwap reach $100?
Is SushiSwap a good investment?
How much is SushiSwap worth in 2025?
Is SUSHI crypto safe?
What will SUSHI be worth in 2030?
Disclaimer
In line with the Trust Project guidelines, the educational content on this website is offered in good faith and for general information purposes only. BeInCrypto prioritizes providing high-quality information, taking the time to research and create informative content for readers. While partners may reward the company with commissions for placements in articles, these commissions do not influence the unbiased, honest, and helpful content creation process. Any action taken by the reader based on this information is strictly at their own risk. Please note that our Terms and Conditions, Privacy Policy, and Disclaimers have been updated.