Using blockchains for transactions and transfers has several benefits, including enhanced security and better record-keeping. Yet, higher transaction costs can make life difficult. Stellar, a decentralized peer-to-peer ecosystem, aims to eliminate this bottleneck. Throughout this Stellar price prediction piece, we shall see how and what that means for XLM — its native token.
We also assess the investment potential of XLM or Stellar Lumens — the native crypto of the Stellar network, which traced a high of over $0.50 in 2024, exceeding our 2024 price prediction. So, what does the future look like for Stellar? Let’s take a look. It would be interesting to see how the future turns out for this “Stellar” crypto project.
KEY TAKEAWAYS
➤ XLM’s trajectory in 2025 is expected to be relatively bearish, with a maximum price level of $0.44156 and a minimum of $0.24880
➤ By 2030, our fundamental and technical analysis-backed projection indicated that XLM could reach a high of $3.27.
➤ The future of XLM depends greatly on adoption of the Stellar network.
- Stellar (XLM’s) long-term price prediction until 2035
- Stellar price prediction and technical analysis
- Stellar (XLM) price prediction 2023 (concluded)
- Stellar (XLM) price prediction 2024 (successful)
- Stellar (XLM) price prediction 2025
- Stellar (XLM) price prediction 2026
- Stellar (XLM) price prediction 2030
- Stellar price prediction and the role of fundamentals
- XLM price prediction and key metrics
- Is the Stellar price prediction theory accurate?
- Frequently asked questions
Stellar (XLM’s) long-term price prediction until 2035
If the Stellar blockchain keeps growing till 2030, over time, we can see it getting listed on several other crypto exchanges. Therefore, long-term XLM coin holders might even want to stick with their Stellar Lumens through 2035. Here is a table to help them check the Stellar price forecasts through 2035, courtesy of extrapolated technical analysis and realistic price projections.
| Year | | Maximum price of XLM | | Minimum price of XLM |
| 2023 | $0.1632 | $0.071 |
| 2024 | $0.381 | $0.12339 to $0.214 |
| 2025 | $0.44156 | $0.24880 |
| 2026 | $0.766 | $0.431 |
| 2027 | $0.85 | $0.66 |
| 2028 | $1.27 | $0.78 |
| 2029 | $1.90 | $0.94 |
| 2030 | $3.27 | $2.55 |
| 2031 | $4.25 | $3.32 |
| 2032 | $6.37 | $4.96 |
| 2033 | $9.56 | $5.92 |
| 2034 | $12.43 | $7.70 |
| 2035 | $16.16 | $12.60 |
Stellar price prediction and technical analysis
Let us take a look at the broader patterns!
Pattern identification
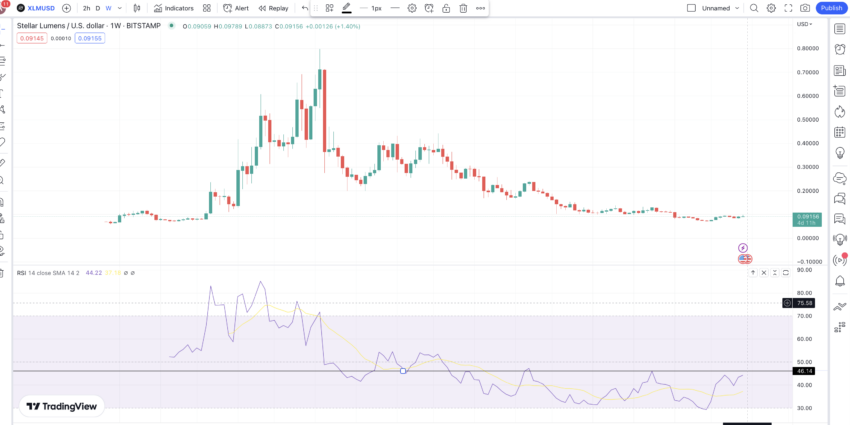
Looking at the weekly RSI from the long-term historical chart, if it breaches past the 46.14 mark, the current upward wave can start the next leg of higher highs at Stellar Lumens’ counter. Till then, prices could continue to move in a range. Do note that this pattern surfaced in 2023 and has been active since.
Now, let us prepare the chart by plotting the key highs and lows.
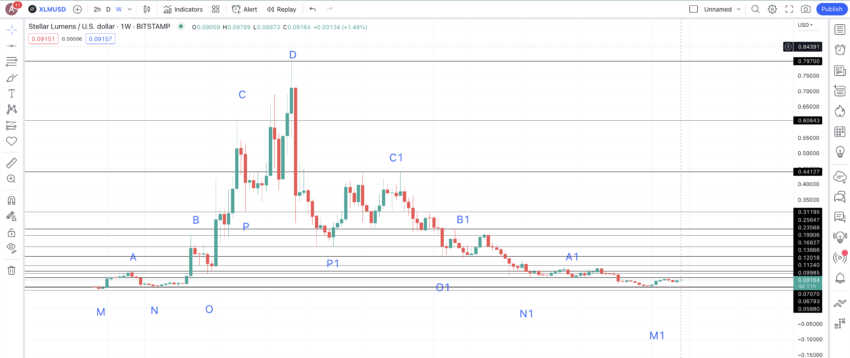
Notice that the chart itself has many higher and lower highs. However, we are only plotting the most significant levels to simplify calculations. Also, these highs and lows can serve as strong resistance and support levels during a market high or when the price of this Jed McCaleb-led enterprise drops.
Price changes
Let us start plotting the price percentages and distance between the key highs and lows for two separate paths: M to D and M1 to D. This will give us more data points for initiating a credible and robust technical analysis.
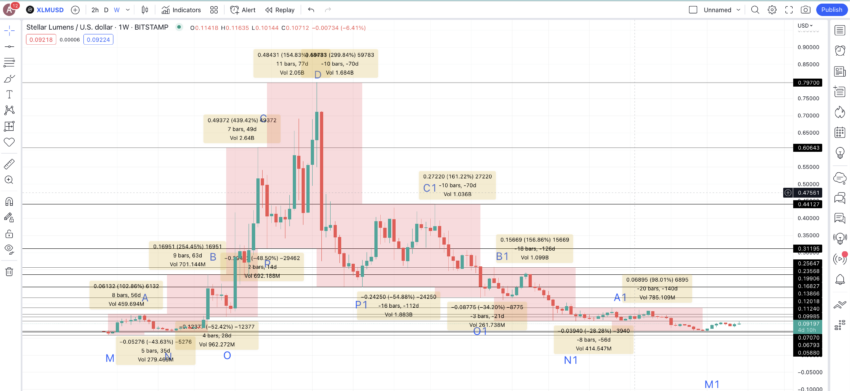
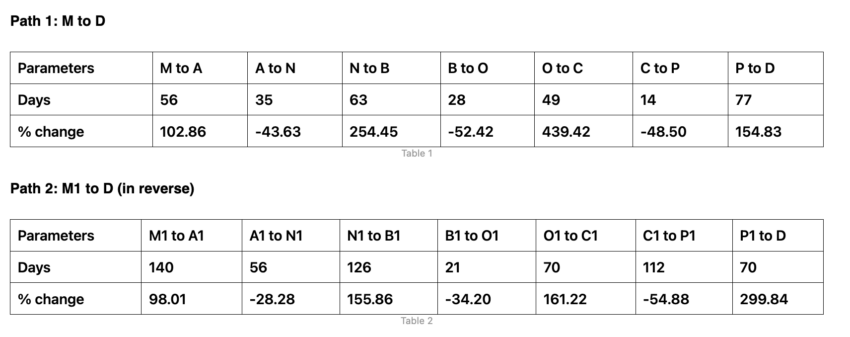
We can use the above data to locate the average price percentage for every low-to-high and high-to-low future price movement associated with Stellar Lumens (XLM).
Calculations
In analyzing the price movements of the Stellar blockchain, we use specific averages to forecast future price levels. The average increase is 208.31% for low-to-high movements using non-negative values.
The lowest expected price hike in weaker market scenarios could be around 98.01%. Conversely, the average decrease is -43.65% for high-to-low movements using negative values. During strong bull runs and robust market conditions, the lowest expected price drop could be -28.28%. Additionally, the timeline for these price movements varies.
The peak price timeline can range from 49 to 140 days, while the timeframe for a price drop can span from 14 to 112 days, as indicated by the data from the tables above. With these values in hand, we can now draw the future price forecast levels pertinent to the Stellar blockchain.
Stellar (XLM) price prediction 2023 (concluded)
XLM did peak in 2023. However, it fell short of our expected price level due to underwhelming fundamentals. Here is what we discussed during our XLM price prediction for 2023.
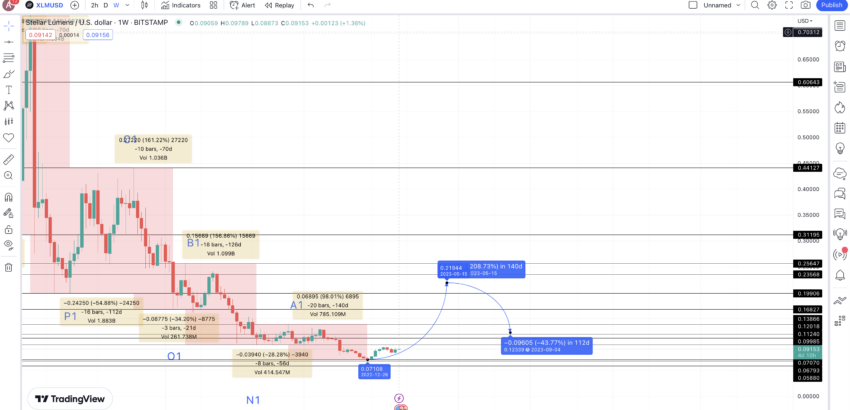
The last low on the weekly chart stood at M1. Considering the current market conditions and the active address growth, the next high, or A2, surfaced at the average price percentage peak of 208.31%.
This projection put Stellar Lumens price prediction high for 2023 at $0.21944.
Stellar (XLM) price prediction 2024 (successful)
Outlook: Bullish
The Stellar price predictions for 2023 set a good base for future Stellar price forecasts. The next high or B2 can, therefore, was expected to surface at close to $0.381 — a near 208.31% price hike (using the average price growth calculation from earlier).
And the prediction was successful as in November 2024, XLM was trading a notch above $0.5.
Stellar (XLM) price prediction 2025
Outlook: Bearish
We can expect another growth surge from the low in 2024 or O2. And while the chart might place it by late 2024, we expect the same in 2025, as the previous peaks will also lead to sell-offs. This might extend the price peak timeline a little. Hence, the Stellar price prediction for 2025 could see the price settling close to $0.44127, considering it to be a strong resistance level.
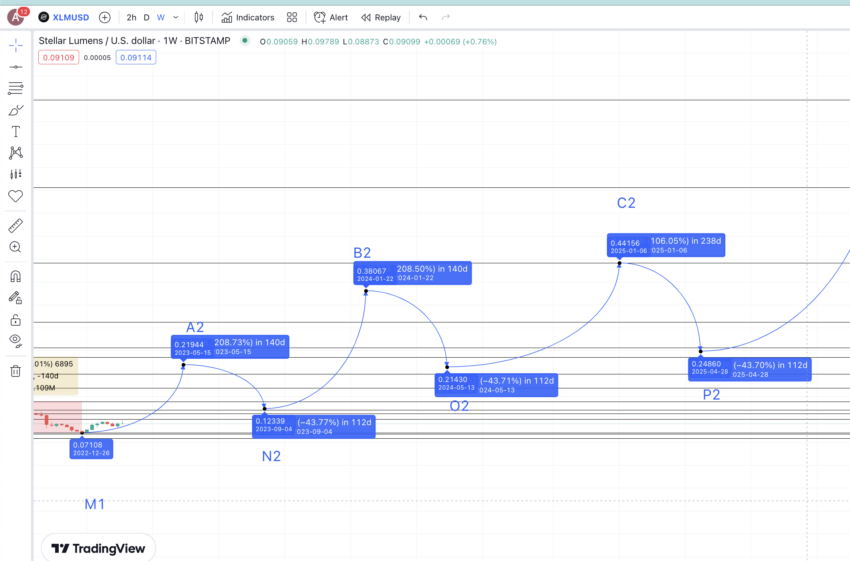
It would be surprising to know that this crucial resistance level coincides with C1 from the previous pattern. Hence, the Stellar price forecast for 2025 could find a quick high at $0.44156. Also, a drop of 43.65% from this level might place the low in 2025 at $0.24880.
Projected ROI from the current level: -15%
Stellar (XLM) price prediction 2026
Outlook: Very bullish
Despite the expected sell-off in 2025, P2 or the 2025 high will close higher than the 2024 low or O2. This makes us bullish about the XLM price, reading a new peak or D2 by 2026. Using the average price hike of 208.31% (from the earlier sections), we can expect the high in 2026 to surface at $0.766.
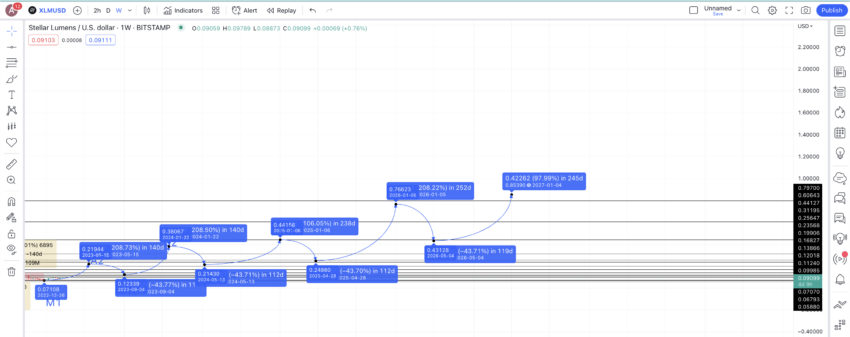
Notice that this could be the middle point of the current pattern. The next drop or the low in 2026 could surface at $0.431. At this point, an interesting trend might surface, keeping the price history of XLM into consideration.
Projected ROI from the current level: 47%
Stellar (XLM) price prediction 2030
Outlook: Bullish
Notice that the new low falls lower than the previous high of C2 — an important resistance level turned support level. A drop under C2 or $0.441 can weaken the prices, thereby kickstarting the lower-high part of the pattern.
Therefore, instead of the usual growth hike of 208.31%, we can expect XLM’s next high to settle at a growth level of 98.01% ( the minimum growth percentage from the tables above). This puts the next level, or C3, at $0.85. And this is where things get interesting.
Even with a lesser price hike figure, the next high still manages to breach the previous high. And this is when we get most optimistic about the price forecast of Stellar Lumens or XLM. And this might also kickstart a new pattern as opposed to the older “higher high-peak-lower high” pattern.
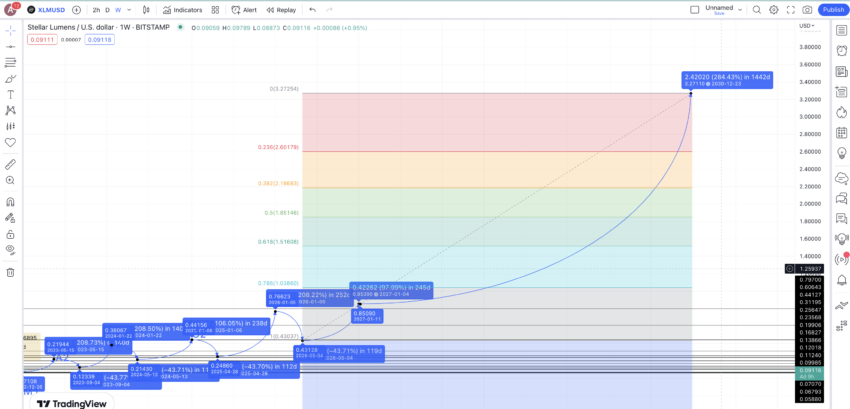
Using Fib extensions, we can also use the low in 2026 and 2027 high to project the price path of XLM till 2030. Keeping the same growth pattern in sight, you can expect the Stellar price prediction for 2030 to settle at $3.27.
Projected ROI from the current level: 528%
Stellar price prediction and the role of fundamentals
Before we conduct a technical analysis or consider tokenomics, let us first understand Stellar and its aims. Here are some quick pointers for reference:
- It is an open-source network with blockchain at its core. With the Stellar network, you can transfer assets and commodities to other parties at almost zero cost.
- Jed McCaleb, the co-founder of Stellar, was previously the co-founder of Ripple (XRP).
- The Stellar network boasts a novel consensus mechanism focusing on scalability, security, and affordability.
- Stellar Lumens (XLM) is meant to pay the network transaction fee and even serve as the bridge crypto for all cross-border transactions.
But these are just features; what about the utility? Here are some interesting points to consider:
- It aims to become a worthy alternative to traditional banking setups
- Supports micro-payments
- Enterprises can use it to issue new digital tokens
- It also serves as a decentralized crypto exchange
Did you know? XLM, the native cryptocurrency of the Stellar Lumens ecosystem was meant to facilitate speedy, cross-border transactions?
XLM price prediction and key metrics
The future of the Stellar network depends on its adoption. Let us look closer at the token trading volume and the XLM price chart.
This 90-day chart shows that every other significant peak in token trading volume resulted in a price surge, intensity notwithstanding.

Is the Stellar price prediction theory accurate?
This Stellar price prediction model is relatable and practical. It considers the price history and project fundamentals and employs a data-backed technical analysis. Plus, we also focus on key metrics like transaction volume and active address to paint a well-rounded picture of the Stellar network and the possible future of XLM.
Disclaimer: This price prediction is written for informational purposes only and should not be considered investment advice. Always DYOR.
Frequently asked questions
What will XLM be worth in 2025?
Can Stellar Lumen reach $1?
Is Stellar better than Cardano?
Disclaimer
In line with the Trust Project guidelines, the educational content on this website is offered in good faith and for general information purposes only. BeInCrypto prioritizes providing high-quality information, taking the time to research and create informative content for readers. While partners may reward the company with commissions for placements in articles, these commissions do not influence the unbiased, honest, and helpful content creation process. Any action taken by the reader based on this information is strictly at their own risk. Please note that our Terms and Conditions, Privacy Policy, and Disclaimers have been updated.


