
Seasoned crypto investors understand that tracking and keeping a constant watch on the market is an important way to make profits potentially. Unlike other financial markets, cryptocurrency transaction data is publicly available, making it easy to spot good projects worth investing in.
While fundamental and technical analyses provide insight into trends of various cryptocurrencies (btw, our three experienced traders and analysts share tech analysis in our BeInCrypto Trading Community on Telegram every day), the idea of extracting data such as trading activity from the public ledger is second to none. This concept, known as on-chain analysis, involves leveraging data discovered on the open-source blockchain to help traders make informed trading decisions. This guide will show everything you need to know about on-chain analysis.
Most popular on-chain analysis tools
IntoTheBlock
AI-powered price predictions & NFT Analytics
Glassnode
10+ years of data, 200+ metrics & customizable dashboards
What is on-chain data?

Transaction details, such as sending and receiving addresses, transferred funds, wallet addresses, transaction fees, and circulating funds for a certain address, are all on-chain data.
Since blockchains are immutable, all transactions stored and validated on the blockchain cannot be changed or removed. Immutability, security, and transparency are some features of on-chain data.
On-chain vs. off-chain data
To better understand what on-chain data entails, let’s compare it to off-chain. Off-chain data are transactions happening outside the blockchain network. It is information not recorded on a blockchain network. Instead of recording data on the blockchain, off-chain data exists in traditional databases and servers.
Blockchains feature decentralization, meaning they are not governed by any central body, which means there’s little to no risk of a third-party consensus breach. On the other hand, a third party handles off-chain data, making transactions more private because the data is not publicly displayed. Furthermore, since transactions are managed by an intermediary, information recorded can be altered, which makes the whole network susceptible to attack or fraudulent transactions.
Anyone can track on-chain transactions back to the original wallet address and explore its transaction history, enhancing transparency and security. In contrast to on-chain data, off-chain data suffers transparency and security. You cannot leverage transaction details since all data are made private.
While off-chain data offer fast transaction speed, on-chain data lacks speed. Once a large volume of data is stored on a blockchain, it becomes congested, making it slow and expensive. In contrast, off-chain data is validated quickly regardless of the number of data being recorded. Additionally, off-chain data don’t have to pass through different blockchain nodes to get validated, making the storage process even faster and less expensive.
What is on-chain analysis?
While fundamental and technical analysis involves utilizing market research and price analysis, the on-chain analysis combines indicators with technical and fundamental analysis to have better trading strategies.
On-chain analytics is the process of collecting data about a certain cryptocurrency by looking at transaction history, hashrates, and other details. It can also involve analyzing the market sentiment and ownership to identify hype and good projects while monitoring big players’ movements.
How does on-chain analysis work?
On-chain analysis works based on many metrics, which have been grouped into three classes featuring a cryptocurrency’s basis, present, and future state. These bits of info are market capitalization, HODL status, and the future potential of a certain cryptocurrency.
Total market capitalization
The total market capitalization is the total asset value of a cryptocurrency. It is usually calculated by multiplying an asset’s price and circulating supply.
It’s widely known that large-cap cryptocurrencies are safe crypto investments, and mid-cap cryptos are volatile with growth potential. In contrast, small-cap cryptocurrencies are highly volatile and considered risky to invest in.
Hold status
HODL waves are an on-chain indicator that shows a particular cryptocurrency’s market trend and age band. With this indicator, you can determine the holding period of a particular asset. For example, the HOLD wave indicates a yellow color within 6–12 months and purple for a period of more than 10 years.
Therefore, this indicator lets you know whether traders are holding the asset for a long-term or a short-term period. Ultimately, it reflects the behavior of traders and the future market move of a certain cryptocurrency.
Prospects of a cryptocurrency
Since on-chain analysis reflects the increasing number of investors engaging in a cryptocurrency, you can better predict the longevity of that crypto. Just like analyzing price volumes, market size, etc., you can analyze the future prospects of crypto. Usually, investing in assets that have similar price movements to Bitcoin is considered safer. This indicator also displays the total inflows and outflows of an asset.
Indicators that on-chain data provide
Beyond the above-mentioned on-chain metrics, on-chain data has several indicators for accurately analyzing a blockchain network. Some common on-chain indicators, such as the hash rate and circulating supply, are pretty well known to an average crypto investor.
Price action
On-chain data allows traders to make trade decisions based on price movements over a period, as displayed on the chart. Price action essentially forms the basis of all on-chain analysis since it uses price patterns and trends to predict future movements. You can employ price action and chart analysis to understand trends in market structure from which you can better strategize and forecast potential price direction.
Some price action tools you can use include:
Stock-to-flow ratio
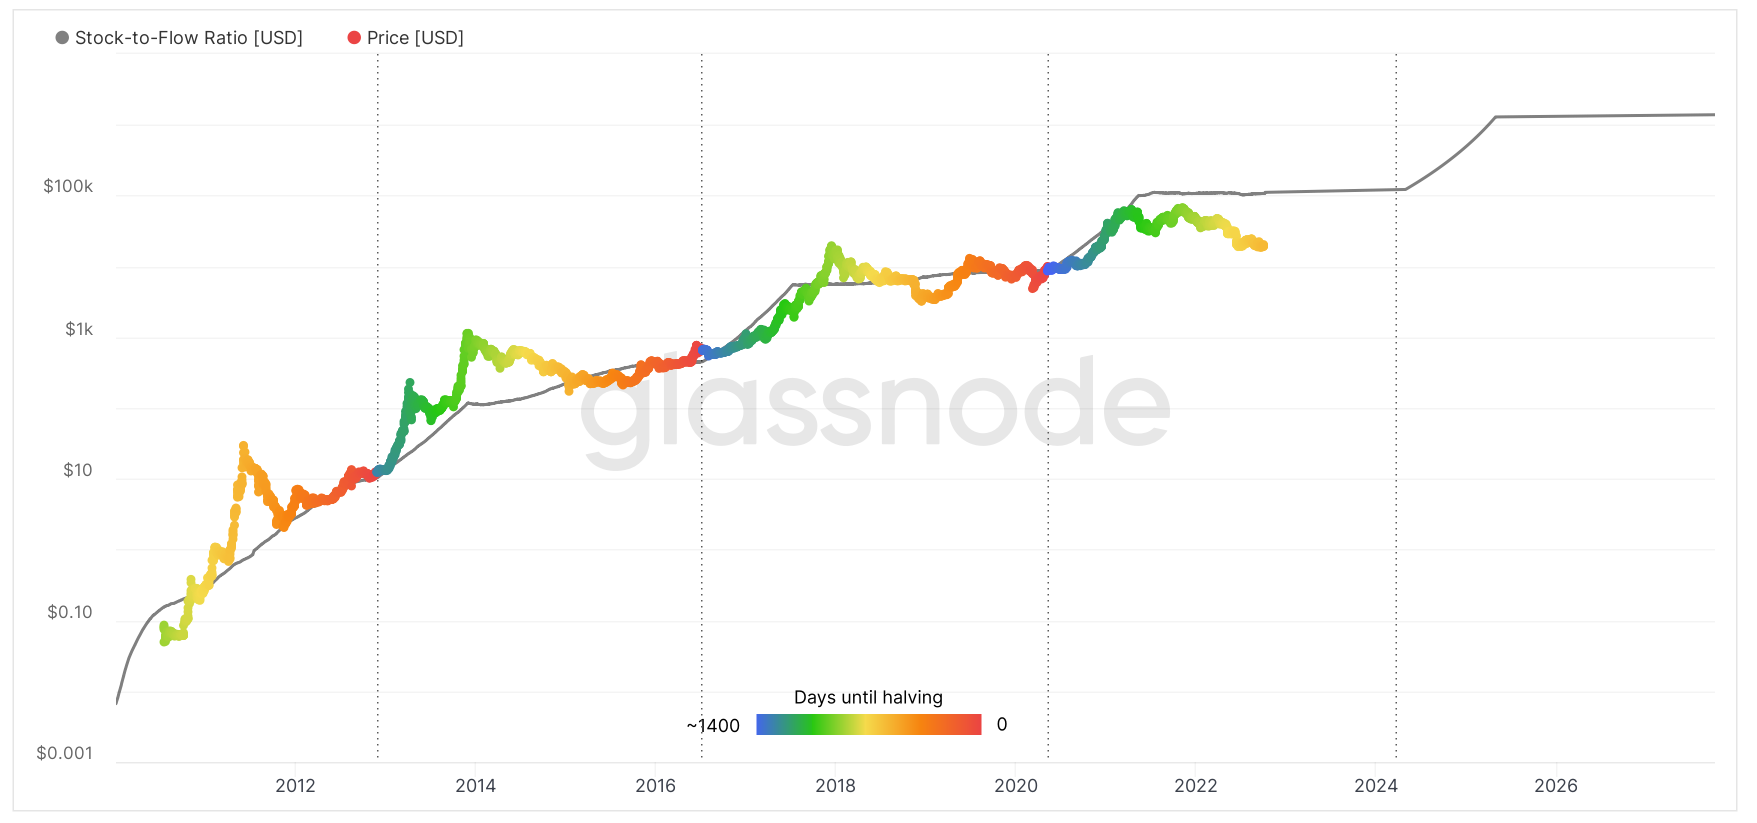
The stock-to-flow ratio (S/F) is the ratio of the circulating supply of a cryptocurrency to the newly supplied coins. The rule of thumb is the value of a cryptocurrency increases with its stock-to-flow ratio. As a result, you can use this ratio tool to determine the value of a particular crypto based on market scarcity and new assets supplied.
Typically, a high stock-to-flow ratio of 50 or more indicates extreme relative scarcity, meaning that the worth of the asset will also rise. This tool can affect your trading decision by selling a certain crypto at a high price and buying when the ratio is low but expecting a long-term increase.
Stablecoin supply ratio (SSR)
The significance of stablecoins goes beyond being an ideal asset on a crypto exchange. You can always swap to a stablecoin when the market movement is unstable. But on the other hand, stablecoins come in handy as an indicator when analyzing on-chain data.
An indicator called Stablecoin Supply Ratio (SSR) allows traders to understand BTC’s buying power over stablecoins.
Market value to realized value (MVRV)
The MVRV (Market Value to Realized Value) ratio is an on-chain analysis tool described as the ratio of an asset’s market capitalization to realized capitalization.
Evaluating the MVRV of a cryptocurrency shows the average profit and loss of the asset in circulation. An MVRV ratio of 3.7 or more shows a potential market top, and a ratio less than 1 depicts a possible market bottom.
Network strength

A blockchain network’s strength depends on several factors, including transaction volume, supply distribution, hash rate, and more.
Transaction volume
On-chain transaction volume is the total volume of crypto assets transferred from an external wallet. Using a blockchain explorer, you can easily view the transaction volume on the blockchain and employ it to improve your trading strategies.
Supply distribution
Understanding the supply model, such as maximum supply, total supply, and the circulating supply of a coin or token, can improve trading decisions.
While some investors might consider a flexible supply distribution wherein coins produced are reduced over time, other investors might see a fixed supply distribution as unfavorable in the long run. This tool also reflects if a coin significantly prioritizes early adopters more than new investors. So you can better spot a project worth putting money into.
Active addresses
An address is active when it becomes a direct participant in a successful transaction — either as a sender or a receiver.
Active addresses are the blockchain addresses that become active after a successful transaction has occurred over a certain period. As a result, active addresses can be a good on-chain indicator that shows the number of active users on a blockchain.
Evaluating the number of active addresses involves the count of both sender and receiver addresses over a given period. For example, monthly active addresses represent all the participants that either sent or received cryptocurrency over that particular month.
Hashrate
Hashrate is the total computational power used in mining and verifying transactions in proof-of-work consensus networks such as Bitcoin.
The hashrate is an important metric for evaluating a blockchain network’s security and overall health. This is because the hashrate rises with the increasing number of inputs devoted to finding the next block. As a result, it becomes really different from launching any attack on the network, boosting security.
In contrast, a decrease in hash rate means miner capitulation — a significant number of miners turning off machines for a certain period of time. This weakens the security of the network.
Buying and selling

Buying and selling extends to all forms of trades, including realized profits and losses, unrealized market gains, market value, supply in losses and profits, and more.
Realized profits and losses
Realized profits and losses are floating profits/losses achieved after cryptocurrency selling. As soon as you buy an asset with a fiat currency, there will be a profit/loss due to the price movements.
Realized profit and losses are determined by comparing the amount realized and realized income. Hence, if the results come out positive, realize profits; otherwise, if negative, it’s a loss.
Realized capitalization
This is a variation of market capitalization that values each UTXO based on its previous historical price change, unlike its present value. As a result, rather than the usual market value of coins, the realized cap reflects the realized value of all the available assets in a network.
The idea behind realized capitalization revolves around creating a metric that helps lessen the effect of lost coins and value coins according to the present state of an account chain. Usually, when a coin gets lost, the market cap does not account for it.
Realized is essentially different as it revalues each last moved coin to its current value. So if a coin is spent at a price higher than when it was previously moved, it will revalue to a higher price and have an equivalent increase in the realized cap.
Supply in profits and loss
Supply in profits and loss evaluates the sum of UTxO’s value. Profit amount focuses on the total sums of UTxO in profit by comparing the price between created and destroyed, while loss amount is the total sum of UTxO value in the loss by comparing the price between created and destroyed.
Top 8 on-chain analysis tools
1. IntoTheBlock
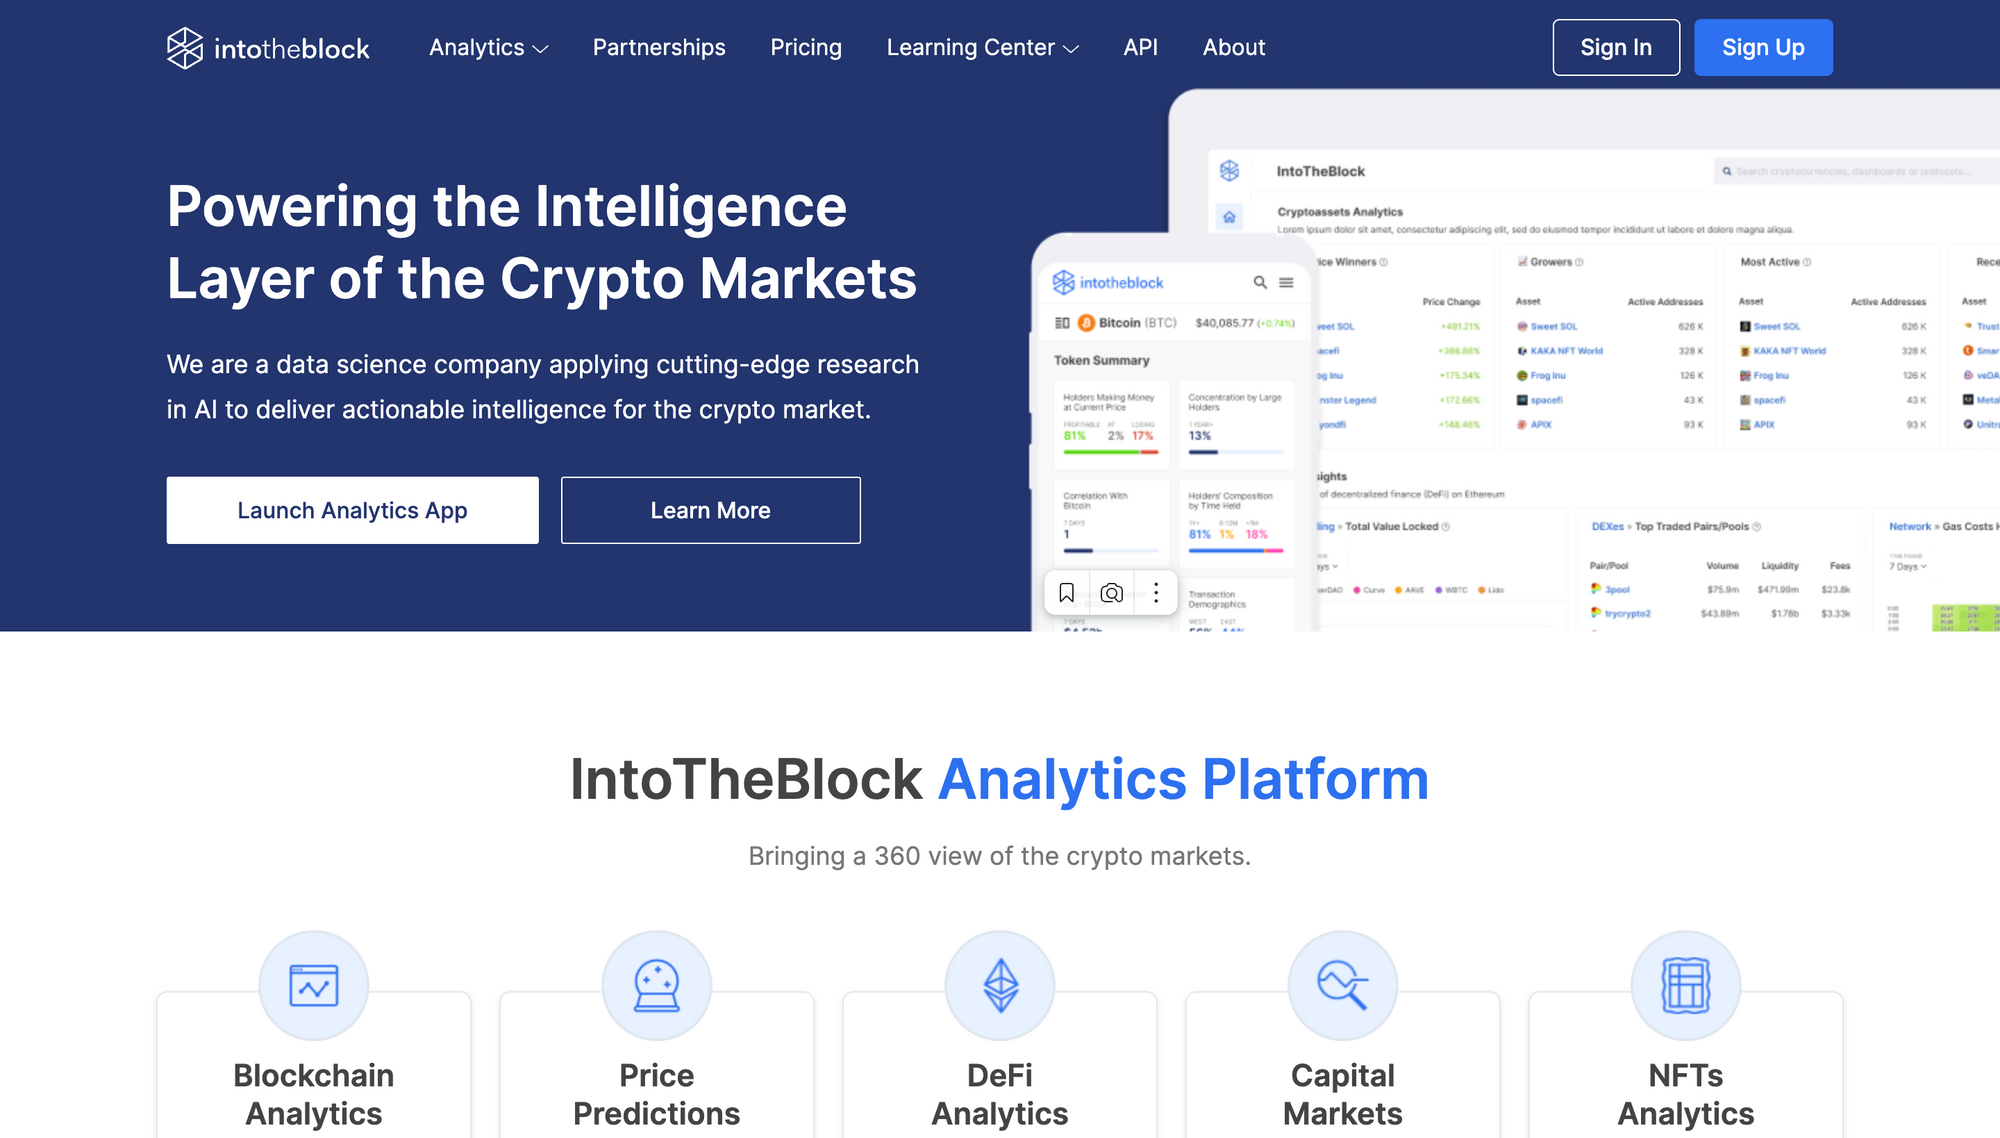
More than just an on-chain analytics platform, IntoTeBlock is a premier data science tech company that uses cutting-edge AI research to provide useful intelligence for the cryptocurrency industry. IntoTheBlock makes on-chain analysis simple for both the novice and expert trader. On top of this, all features are available at a very reasonable price.
Jesus Rodriguez founded the Miami-based tech company in 2018. It is a group of data scientists, cryptocurrency experts, and AI enthusiasts who have set out on a journey to unravel the mysteries of crypto assets and provide investors with relevant market intelligence. They had too many unanswered questions about cryptocurrency markets. As a result, they created a platform that allows us to use machine learning to generate new insights about this fascinating asset class.
Features:
- Artificial intelligence-powered price predictions
- Over 900 assets with different metrics like price, market cap, change, and more
- Sophisticated analytics in the DeFi space for general market data and specific DeFi protocols
- Capital markets (indices, stocks, ETFs, commodities, spot, and derivatives) trading data
- NFT Analytics
Pricing:
You will be happy to know that IntoTheBlock has a free 7-day trial, with no credit card required. You can subscribe to this premier service for as little as $10 monthly. In the true spirit of crypto, you can fund your subscription in either fiat or cryptocurrency.
2. Glassnode
Glassnode is an on-chain analysis tool that provides crypto market insights via on-chain indicators. Founded in 2018, Glassnode focuses on helping the research journey of crypto traders with market intelligence and other relevant on-chain data to improve users’ crypto trading decisions.
Widely known for its in-depth reports of market indicators for several cryptocurrencies, Glassnode has offered several applications that offer new ways of staying up to date with market fluctuations. The platform’s live data opens you into several charts and dashboards with detailed insights on address activity, balances, growth, supply, hodlers, etc.
Features:
- Many on-chain market indicators for several cryptocurrencies
- More than 200 metrics
- Customizable dashboards that allow you to add your favorite metrics for certain coins
- More than 10+ years of data
- Weighing different metrics for different coins
- TradingView integration
- Comprehensive resources on famous blockchains and cryptocurrency
Glassnode offers three-tier packages with a free, advanced, and professional plan. The advanced plan goes for $29/month (annual payment) and $39 on a monthly payment. The professional plan costs $799/month (annual payment).
3. Nansen
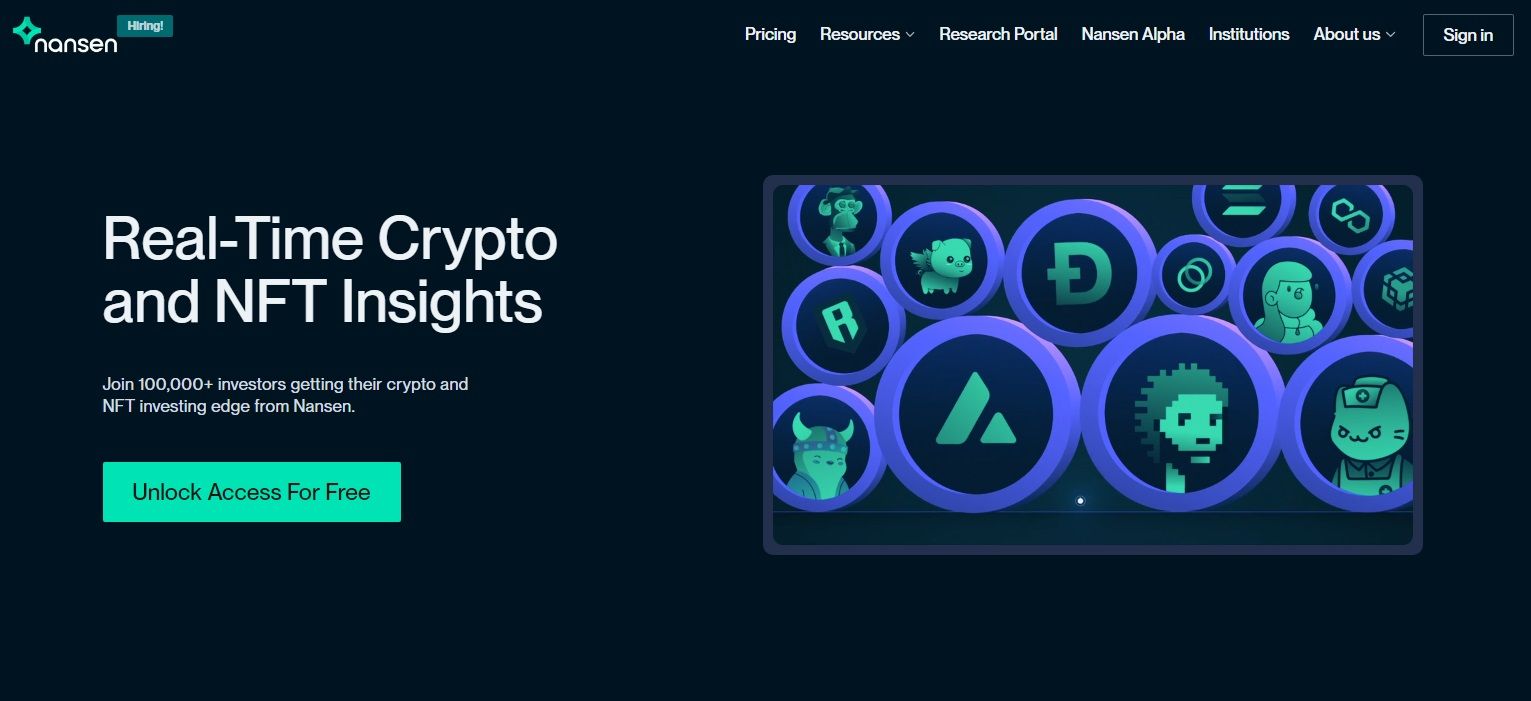
Nansen is one of the most popular blockchain analytics platforms that combines on-chain data with many wallet labels. Through its real-time dashboards and alerts, users can gain an improved insight into the crypto market.
While Nansen is best known for crypto experts seeking deep research into on-chain data, new crypto investors can leverage the tool to learn more about crypto. Here are some key features of Nansen:
Features:
- Some in-demand features include Wallet Profiler, ETH tracker, DEX trades, CSV data, and more.
- Using Nansen analytics, you can easily spot patterns and forecast the price movements
- Modifiable smart alerts
- Discover new trends with the platform’s custom reports
- Real-time on-chain data for populating blockchains, including Ethereum, BSC (Binance Smart Chain), etc.
- Millions of wallet labels provide insights into several crypto assets
- With detailed dashboards, you can easily discover new trends in NFTs, DeFi, and DAOs
- Discover tools for new projects, tokens, and new NFTs
- Spot emerging trends supporting multiple blockchains
Nansen offers a free plan for users. It offers three packages, including Standard, VIP, and Alpha. The Standard plan varies between $100/month and $150/month, depending on the billing period. The VIP plan costs $1000/month (billed annually), and Alpha goes $2000 (billed annually)
4. Dune
Dune is an essential blockchain analytics tool for querying Ethereum data using simple SQL queries from premade databases. Instead of a whole new script, you can query the database to collect virtually any information hosted on the blockchain.
Popularly known for gaining insights into the Ethereum blockchain research, you can easily view on-chain data using query codes. Ultimately, Dune offers all the needed tools to query, extract, and display massive volumes of blockchain data.
Features:
- Breaking down complex data into easy-to-understand information offers simple data collection and visualization (charts, graphs, etc.)
- Access to many metrics for on-chain data analysis
- Dune extracts blockchain data and arranges it into SQL databases that can be queried.
Dune offers a free package with custom dashboards, chart sharing, a maximum of three queries, and more. The pro tier costs $390/user/month with instant query access, about six query options, and much more.
5. Etherscan
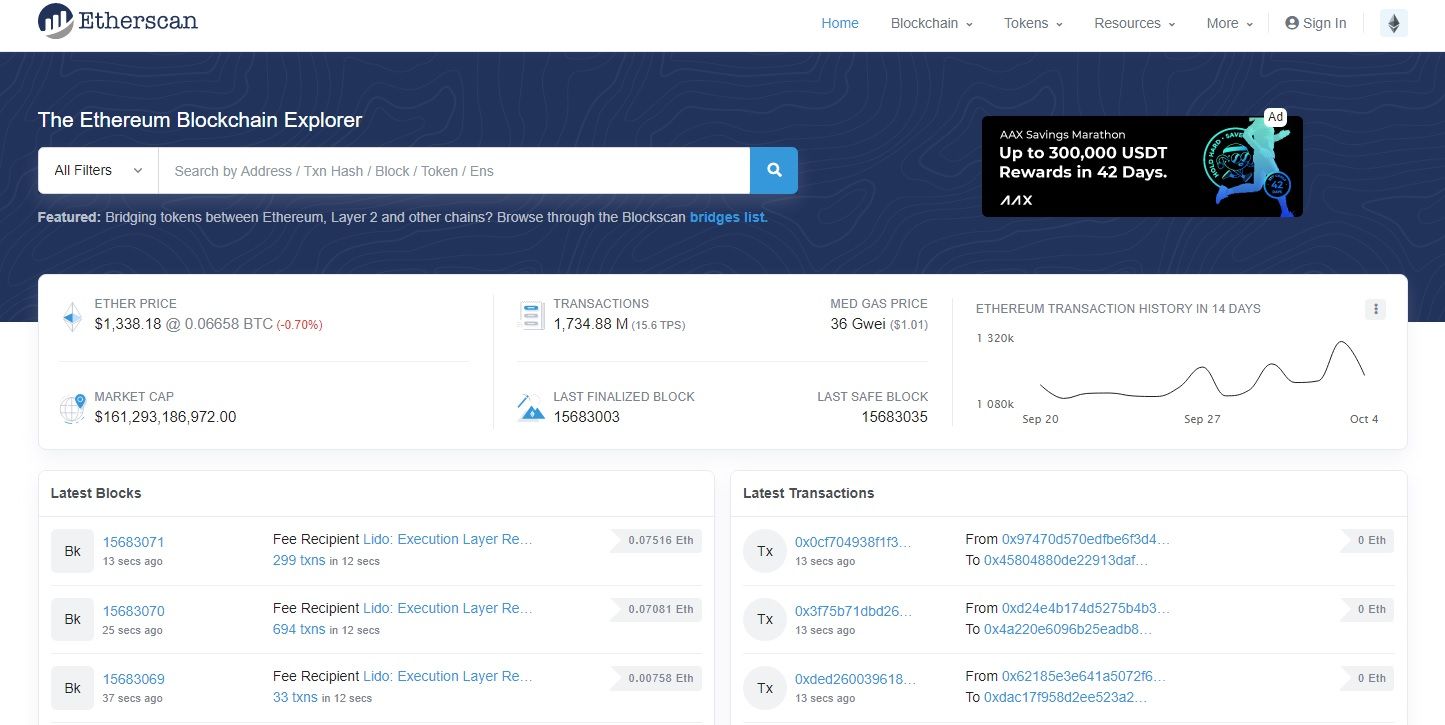
As the name suggests, Etherscan is a blockchain explorer and analytics tool for the Ethereum blockchain. It offers easy access to real-world data and transaction details, such as pending and approved transactions.
Best known for accessing and leveraging transaction activities on Ethereum, Etherscan allows users to spot fraudulent activity easily. Here are some features of Etherscan:
Features:
- Spot early trends, such as airdrops on the Ethereum blockchain
- Comprehensive technical reports from Ethereum developers
- Track gas fee
- Custom alerts for transactions and any big activity
- Check details of any public ETH wallet address
- Analyze transaction blocks, tokens, and more
Etherscan has three plans, excluding a free plan. You can choose to go for the Standard package, which costs $199/month, $299/month for the Advanced plan, or $399/month for the Professional plan.
6. Santiment
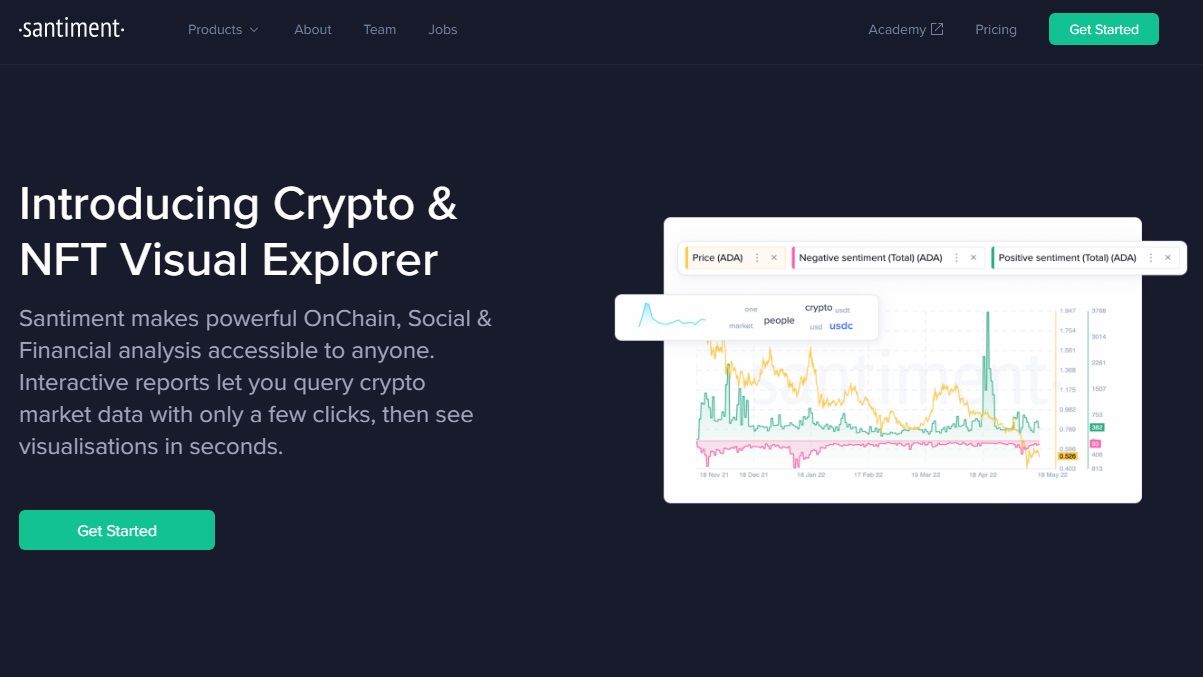
This is a detailed market analytics tool that provides accurate data feeds, low-latency signals, custom market watches, alerts, chart layouts, and other tools to improve your trading journey.
Santiment is widely known for sending its users newsletters, reviews, and market reports. Offering various on-chain analysis tools like Sandbase, you can view and analyze charts of all coins.
Features:
- Leverage on-chain, social, and development metrics
- Spot emerging social trends
- Customized alerts for trading activities wherein you can easily spot any malicious act
- Social crypto trends
- Personalized watchlist for weekly coin updates
- Insights and behavioral reports from Santiment’s crypto analysts
Santiment offers a free plan and paid plans (pro and pro+). The pro package offers advanced crypto metrics and market insights, costing $44/month (annual subscription). The pro+ offers even more features, and it goes for $225/month (annual payment)
7. Messari
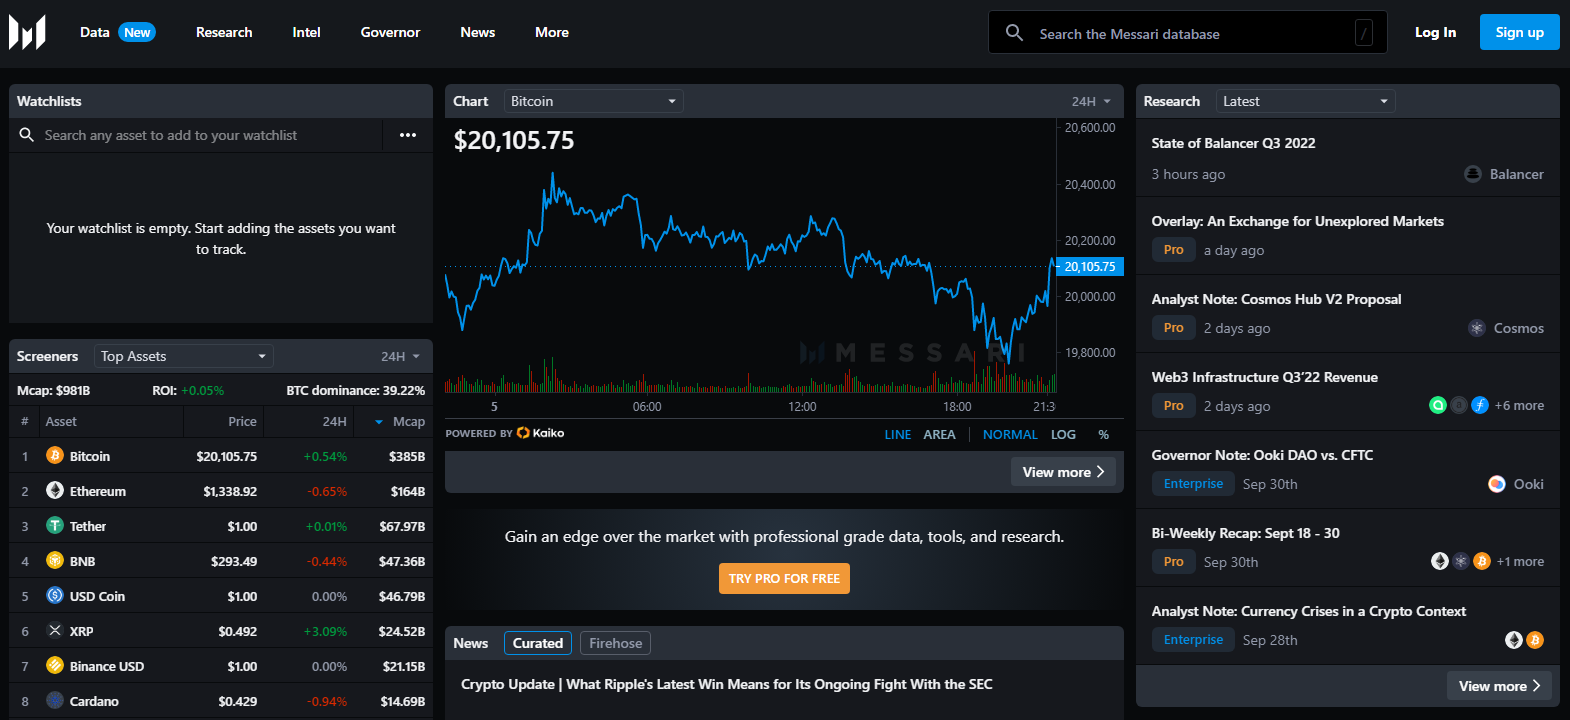
This is a decent tool for exploring the crypto space, more specifically, providing free charting services, long-form weekly reports, downloadable CSV data, and more. Messari is widely known for daily insights covering the main sectors in crypto, ranging from DeFi, Metaverse, and Web3 to NFTs.
Features:
- Access to different charts, screeners, watchlists, and reports
- Helpful tools to analyze charts and reviews
- Access to stats such as volume, liquidity, on-chain, staking, supply, and market cap, etc.
Messari Pro costs $24.99/month if billed on an annual basis.
8. CryptoQuant
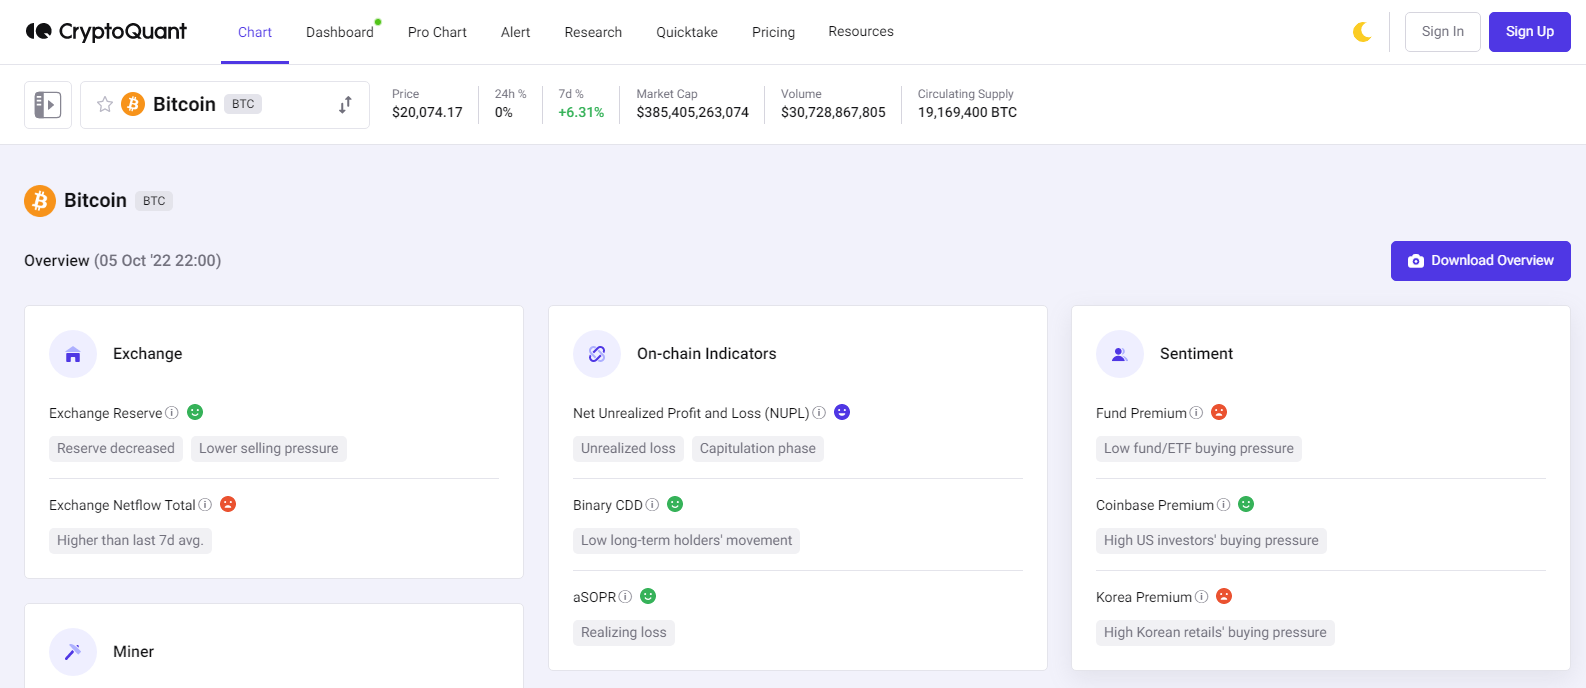
CryptoQuant provides market data and on-chain data via API or any data analytics tool. In addition, the platform offers inclusive data such as on-chain data and short/long-term indicators for popular crypto assets, including Bitcoin, Ethereum, Stablecoins, and ERC20 tokens.
Features
- Access to charts overview, exchange overflows, pro chart, alerts, and more
- Select different metrics like Flow Indicator, Miner Flow, and more
- Get notified when there’s any scam
CryptoQuant offers a free plan with many metrics. Then it offers three plans, including Advanced, Professional, and Premium, going for $29/month, $99/month, and $799/month, respectively.
Mastering market trends through on-chain analysis
On-chain data provides numerous advantages, such as deepening your understanding of market structures and investor behavior and enhancing your trading strategies. This data also offers comprehensive insights into the operations of a project or network, aiding in more informed decision-making. We recommend incorporating these platforms into your investment approach. With time, integrating on-chain analysis into your regular investment practices is significantly beneficial.
