The crypto space is replete with several price forecasting tools. Some rely on historical price movement (in other words, technical analysis that is published daily in our BeInCrypto Trading Community on Telegram), some rely on market dominance, and some even rely on scarcity. Yes, you read that right! Scarcity of supply is a reliable long-term price foreshadowing method. And the stock-to-flow (S2F) bitcoin model is one such resource.
With stock-to-flow, bitcoin tries to set a supply limitation narrative. And if something valuable is low on supply, the prices end up moving, with increasing or even flattening demand. But stock-to-flow isn’t just a concept. It’s a full-fledged indicator that is positively correlated with BTC prices. Here, we will discuss everything about the Bitcoin S2F model: its history, concept, calculation, benefits, limitations, and more.
In this guide:
- Understanding the stock-to-flow (S2F) model
- Unpacking the stock-to-flow ratio calculation
- Why 463 days for S2F Calculation?
- Stock-to-flow model: benefits
- Stock-to-flow model: limitations
- Bitcoin price prediction using stock-to-flow
- Gold vs. bitcoin S2F models: how do they differ?
- What is the bitcoin stock-to-flow cross-asset model?
- Price prediction using the bitcoin S2F model
- Bitcoin S2F model: a useful tool
- Frequently asked questions
Understanding the stock-to-flow (S2F) model
The bitcoin stock-to-flow model is a reliable and statistically vetted quantitative tool that ties up BTC’s limited supply and periodically dropping inflation rate with its price action. Stock-to-flow is primarily a ratio that states that BTC prices might grow steadily as it is significantly difficult to increase the supply of the cryptocurrency.
We will soon mathematically discuss this ratio and the calculations behind it.
Stock-to-flow puts bitcoin on the same pedestal as precious metals/commodities like gold and silver, which also have supply scarcities. The tool also lends a commodity tag to bitcoin and that much-debated intrinsic value.
Bitcoin stock-to-flow (S2F) model: the history
Plan B — a pseudonymous Twitterati — came up with the S2F model in March 2019. He discussed this model at length in his hugely popular Medium post: “Modeling Bitcoin Value with Scarcity.” The model considers 5-year sprints. Plus, it has been fairly accurate since its inception.
Unpacking the stock-to-flow ratio calculation
The stock-to-flow comprises two terms: stock and flow. For bitcoin, the stock here means 19.19 million — the current circulating supply. Flow here means the year inflation — the number of bitcoin introduced each year into the supply pile.
Therefore, the ratio looks like this: SF Ratio = Stock/Flow
Presently, bitcoin stock = 19.19 million.
BTC mined per year/ Flow of bitcoin = 356029 (Almost 975 BTC mined per day)
In the Bitcoin network, approximately 160 blocks (between 150–156 usually) are created daily. For one successful block, miners receive 6.25 BTC as per the current reward cycle. Therefore, the Flow comes out to be: 156 x 6.25 = 975 BTCs
Hence, the SF Ratio comes out to be: 53.9. This number means that it would take 53.9 years to produce the current BTC stock.
Do note that flow keeps changing due to the following reasons:
- Changing mining difficulty
- Network congestion in the Bitcoin network
- Changing the cost of mining hardware
- Halving events
Pairing the ratio with bitcoin’s Price
But that’s just the ratio. How do we pair the SF ratio with the bitcoin prices?
For that, we have another formula for calculating the fair price of BTC as per the SF model.
Model Price = exp(-1.84). SF^3.36
Using the current SF ratio, the Model Price, as of today, comes out to be: $104480 approximately.
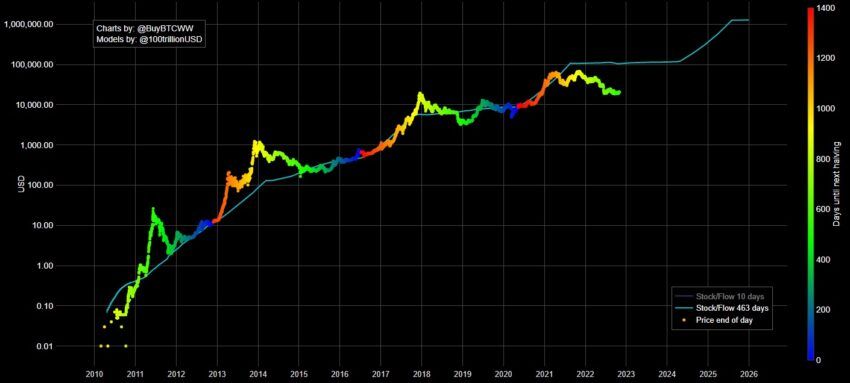
The model price is what the stock-to-Fflow line illustrates. The indicator overlays the current BTC price atop the model price line to show the difference between the model and actual prices.
There is another way to arrive at the SF ratio. We can use the following formula:
SF ratio = 1/supply growth rate
The supply growth rate is also the bitcoin inflation we have discussed. For BTC, the current inflation rate is close to 1.80%. Therefore, the SF ratio comes out to be almost 55, which is close to the value we arrived at using the formula mentioned above.
Why 463 days for S2F Calculation?
If we look at the chart above, we see that the stock-to-flow line is pretty smooth and in a flat trajectory for the most part. This is because we use the stock-to-flow model spanning over 463 days. And there is a reason for it!
A good aspect of bitcoin is that it has an inflation-handling mechanism built as part of the source code. Such an event happens every four years or less and is termed halving. Each halving cycle ideally happens after 210,000 blocks. And during each cycle, BTC’s price action usually goes through three phases: Bull run, correction, and Mean reversion (returning to the average asset price).
And as per the current daily inflation, 151 blocks are produced daily. Therefore, the timeline creation formula is as follows:
Span = (Blocks per halving cycle/ 3) / blocks per day
= 463 approximately!
This calculation was proposed by Preston Pysh —a Central Bank and Stock researcher — and is meant to increase the sample size and smooth out the SF-powered BTC price model.
Stock-to-flow model: benefits
Now that we are through the hard part (mathematics), here are some of the benefits of using the stock-to-flow bitcoin price forecasting model:
- Helps track the price moves using fundamental drivers like token economics.
- Offers an optimistic viewpoint to the long-term BTC hodler
- Have been in line with price forecasts during the halving events
- It shows that bitcoin has a low price elasticity of supply, i.e., an increase in price doesn’t increase supply. All thanks to the auto difficulty adjustment functionality.
- One of the few indicators to use new supply, which is nearly constant, as a parameter.
Stock-to-flow model: limitations
The bitcoin stock-to-flow model has its set of drawbacks. Here are a few that you, as a trader/investor, should be mindful of:
- It doesn’t account for the market volatility, especially the massive price swings that happen during key events.
- The model extrapolates data as per some overoptimistic projects that might not hold in a bear market.
- It doesn’t consider the black swan economic events.
- It considers BTC demand to be constant and doesn’t account for a “demand” fall.
In June 2022, Vitalik Buterin came down strongly on the stock-to-flow model. Here is what he tweeted:
Bitcoin price prediction using stock-to-flow
We come bearing good news! The stock-to-flow of bitcoin can be used to forecast trading and investing plans. Here are the ways to go about it:
Identifying price zones
The stock-to-flow model helps with a normalized, fair price formulation for bitcoin. If the cryptocurrency’s price drops under the fair price line, the asset is considered to be oversold and might see a trend reversal of sorts. This can be a point for strategic investors to open long positions.
Similarly, price movement above the stock-to-flow line shows that the asset is overbought, and a correction might be in the offing.
Another way of checking the deviation from the model’s fair price is by looking at the model variance zone in the lower part of the stock-to-flow indicator. The green zones are the discount zones for strategic investors, whereas the peaking red zones beckon exit decisions.
Initiating event-based trading
The model reveals that the BTC prices have historically increased during halving events. This model helps track the subsequent halving events whilst showing the fair price projections during the event.
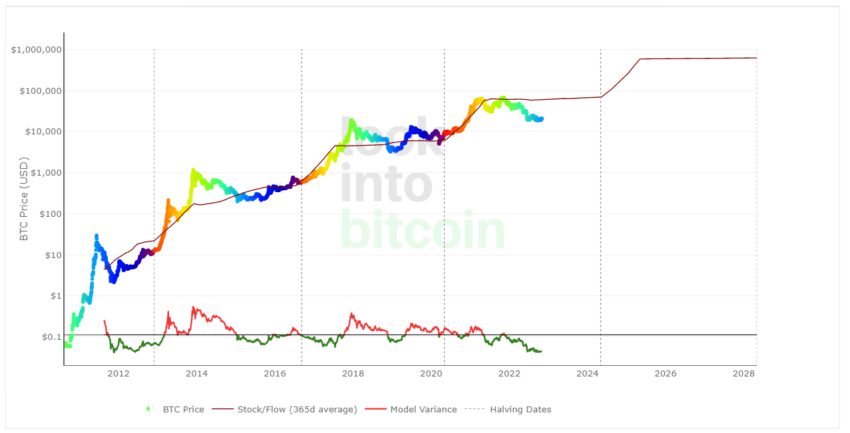
The dotted horizontal lines are the halving milestones. Check for the price surges post every halving event.
Gold vs. bitcoin S2F models: how do they differ?
Gold is one of the other commodities with a high stock-to-flow ratio. It is scarce and has a set maximum supply. Let us now look at gold’s stock-to-flow ratio:
The current stock of gold = 187,000 tons
Current flow (as of 2022) = 3,000 tons
SF ratio = Stock/flow = 62.3% approximately!
If you refer to the bitcoin stock-to-flow calculation segment above, you would know that currently, BTC has an SF ratio of almost 54.
Even though BTC’s SF ratio is lower, it comes with a distinct advantage over gold:
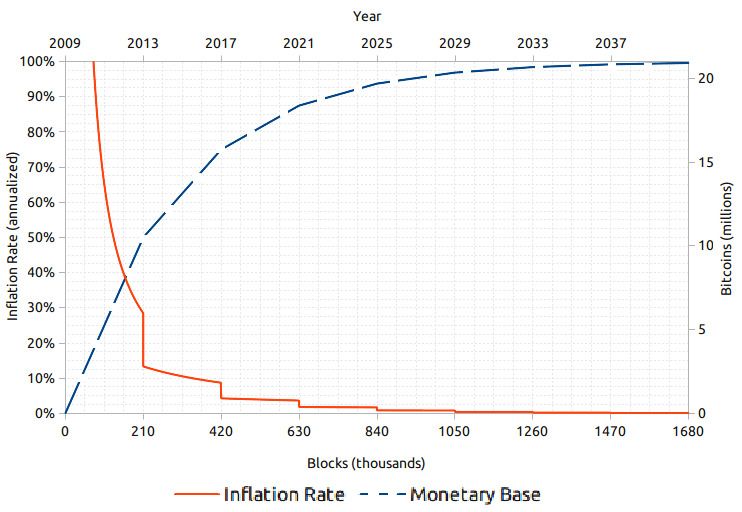
Bitcoin has the halving event by its side. This means BTC’s inflation rate decreases by half, roughly every four years. This means, unlike gold, bitcoin’s stock-to-flow is expected to increase at a clip in time. Furthermore, it is worth mentioning that even BTC has a maximum supply — 21 million bitcoins, to be exact.
Here is what the BTC supply curve looks like:
What is the bitcoin stock-to-flow cross-asset model?
Enough about the standalone bitcoin stock-to-flow model. It’s now time to shift our attention to a model that eliminates time from the chart and adds other assets to show a relative model. This model is termed the stock-to-flow cross-asset model.
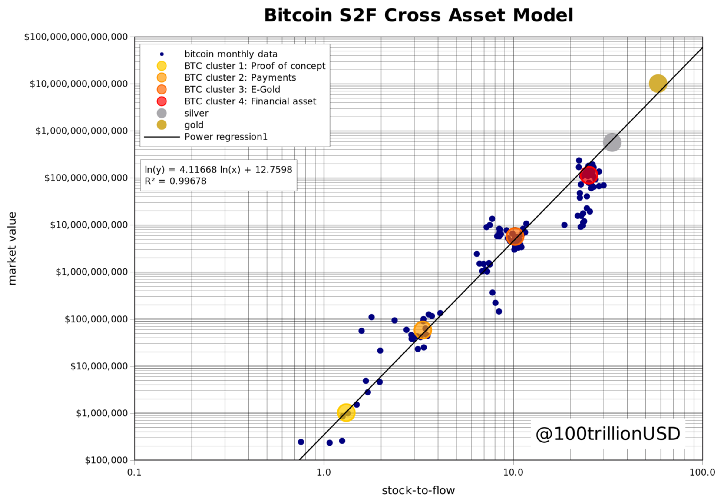
Simply put, one formula and chart for BTC, gold, and silver! This model is also termed S2FX and might use other assets depending on the finiteness of their supply.
In the S2FX model, even the BTC narrative changed during different periods. For instance, BTC’s proof-of-concept narrative, immediately after the whitepaper, was perceived differently using the S2F model. Something similar happened after the 1st halving when the E-Gold narrative started doing rounds. Each narrative phase had a different S2F ratio for BTC.
Overall, the S2FX model takes all these narratives into account, along with other assets.
Using the S2FX model, it would be easier to find BTC’s S2F ratio for the next few years. Multiple data points followed by regression analysis to help smoothen out the data points relevant to every asset played a major role in developing the cross-asset stock-to-flow model.
Price prediction using the bitcoin S2F model
By now, we should have realized that the bitcoin stock-to-flow model is directly correlated with its price. A higher S2F ratio — above 50 — shows higher scarcity, which triggers price growth. Furthermore, the indicator has the model variance index to show how far the prices are from the fair value. These data points can help traders make informed decisions.
Bitcoin S2F model: a useful tool
In summary, the stock-to-flow bitcoin model is one of the many reliable financial indicators around — though it has been questioned multiple times. It is useful because scarce metals like gold and silver have been using it for a while now.
And with bitcoin having by its side, it might soon become one of the more sought-after commodities, provided the adoption rises. And we wouldn’t be particularly worried about the demand. Crypto is the future, and the demand will keep rising with time.
Frequently asked questions
Is bitcoin stock-to-flow broken?
Does stock-to-flow work for ethereum?
What does stock-to-flow mean?
Is higher stock-to-flow better?
What is the bitcoin stock-to-flow?
Disclaimer
In line with the Trust Project guidelines, the educational content on this website is offered in good faith and for general information purposes only. BeInCrypto prioritizes providing high-quality information, taking the time to research and create informative content for readers. While partners may reward the company with commissions for placements in articles, these commissions do not influence the unbiased, honest, and helpful content creation process. Any action taken by the reader based on this information is strictly at their own risk. Please note that our Terms and Conditions, Privacy Policy, and Disclaimers have been updated.

