

It’s raining Ethereum scaling solutions. SKALE, Polygon, Arbitrum, and Optimism often occupy the limelight in this area. But OMG Network is slowly moving up the ranks as a scaling option focused on high transaction speeds. But is its utility reason enough to be bullish on OMG — the network’s native cryptocurrency? This OMG price prediction piece aims to answer just this, focusing on fundamentals, technical analysis, and market cap comparisons.
- The price of OMG Network (OMG) and fundamental analysis
- OMG, price prediction and tokenomics
- OMG price prediction using market insights
- On-chain metrics, holding patterns, and the price of OMG Network (OMG)
- OMG price prediction using technical analysis
- OMG Network (OMG) price prediction 2024
- OMG Network (OMG) price prediction 2025
- OMG Network (OMG) price prediction 2030
- OMG Network (OMG’s) long-term price prediction until 2035
- How accurate is the OMG price prediction model?
- Frequently asked questions
Want to get OMG price prediction weekly? Join BeInCrypto Trading Community on Telegram: read OMG price prediction and technical analysis on the coin, ask and get answers to all your questions from PRO traders! Join now
The price of OMG Network (OMG) and fundamental analysis
For starters, the OMG token is trading at a 97.24% discount to its all-time high price of $28.35 as of February 2024. But does OMG Network, as a project, have the potential to scale at par with the competitors? Could it ever reclaim its maximum price?
Did you know? The OMG network is a non-custodial layer-2 platform that relies on plasma sidechains for scaling Ethereum. Even though the focus is on the speed of transactions, OMG Network takes user experience and transaction fees into consideration.
And that’s not all. OMG Network partnered with Boba Network and rebranded itself in a crypto market where competitors were doing well. Currently, OMG Network is rechristened as the Boba Network — with the latter coming in to keep the original project alive. Do note that the base layer, aka Ethereum, still offers security and arbitration capabilities to the OMG network. With the Boba Network, the scaling technology now has an additional boost of Optimistic rollups, cross-chain bridges, and improved liquidity.
Here’s what you should know about the OMG Network from a fundamental perspective:
- It supports building smart contracts on top of Ethereum by creating child chains. The innovation adheres to the plasma protocol.
- The current consensus mechanism is proof-of-authority, but OMG Network plans to shift to PoS.
- A network of nodes (Watcher) is meant to keep an eye on the child chains.
- The plasma chains focus on lowering electricity consumption by almost 99%.
- Pantera Capital is an OMG Network investor.
- Even though the OMG tokens remain, they operate under the purview of the Boba Network.

Current state
The OMG Network has been renamed the OMG Foundation after partnering with Alan Chiu’s Boba Network. This means it continues as a bigger body, with the OMG Network working as the Boba network. OMG tokens still hold value for becoming a part of the OMG Foundation.
In 2021, Alan Chiu tweeted that nothing changed for the OMG token despite the superimposition of projects and a grand renaming.
The OMG Network’s success once depended on how widely the Plasma Protocol was used as a scaling solution. Now with Boba taking over and OMG holders getting BOBA airdrops, innovation has shifted from OMG to the Boba Network. For now, OMG token’s price surge can just be a pillion event to BOBA’s success.
OMG, price prediction and tokenomics
Before we move ahead with the OMG price prediction model, it is important to understand what the OMG token looks to achieve. It is simply a utility token, giving users the power to transact within the OMG Network.
While the Boba Network takes center stage at the moment, OMG tokens still trade and have a specific token model in play. The initial token supply model was investor-heavy, with them receiving 65.1% of the total supply.
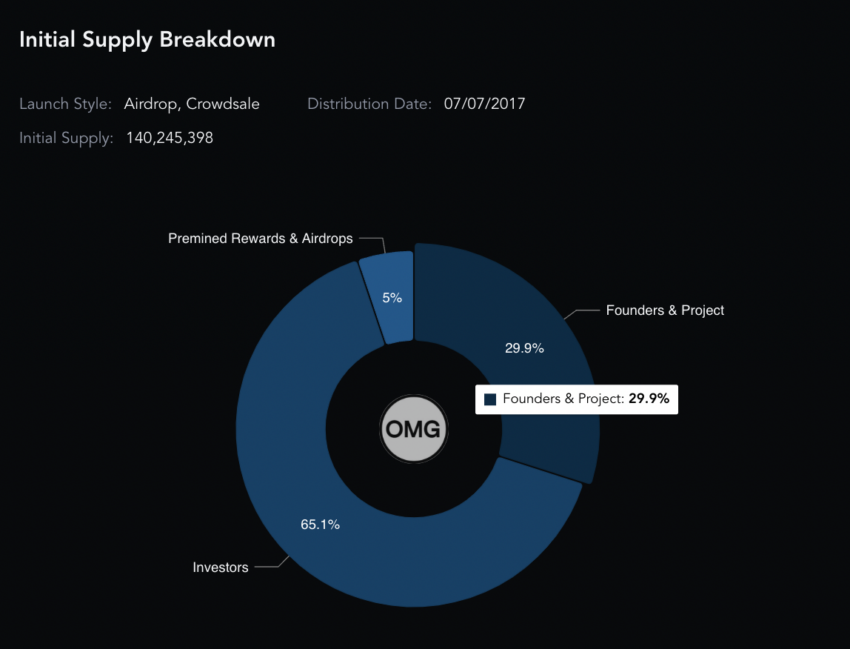
Also, OMG has a 140 million+ token supply, and 100% of the same is now the circulating supply.
While BOBA tokens have replaced OMG across wallets, some OMG trading activity still continues across exchanges. That might be positive for OMG’s price action.
OMG price prediction using market insights
OMG’s peak market cap and trading volume show the network surfaced back in January 2018. The trading volume was $74.20 million, and the market cap was $2.62 billion. This translates to a turn-over ratio of 0.028.
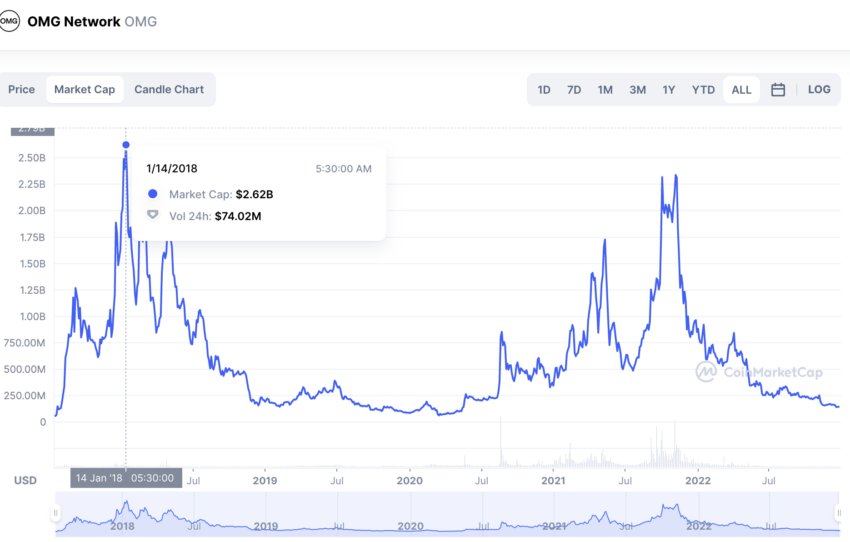
The market cap peaked again on Nov. 10, 2021, going all the way up to $2.32 billion. At that time, the trading volume was insanely high due to the exchange-specific popularity of the OMG tokens. The trading volume at that time was $1.86 billion. The turn-over ratio was 0.80. Hence, OMG was much less volatile in 2021 compared to 2018.
The market cap and trading volume figures in 2022 were $141.05 million and $15.86 million, respectively. This translates to a turn-over ratio of 0.11. Therefore, the volatility of OMG was at least seven times higher in 2022 compared to 2021.
More volatility means prices can go sideways. However, we need to keep track of the possible price analysis patterns before speculating anything.
On-chain metrics, holding patterns, and the price of OMG Network (OMG)
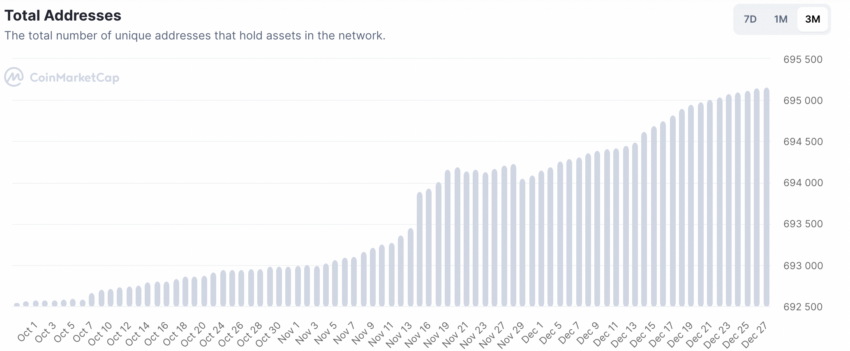
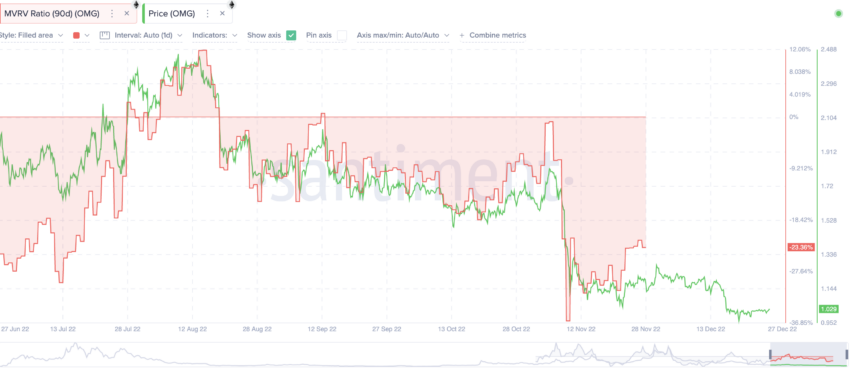
The number of unique addresses seems to have picked up over the past 90 days, as of December 2022. This might hint at a building holding pattern for OMG tokens despite the Boba takeover of sorts.
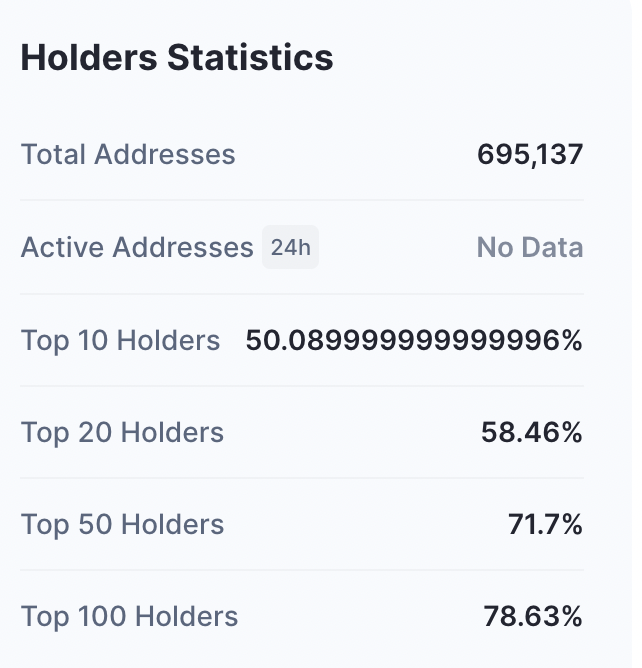
However, the only concern here is that the Top 100 OMG addresses hold over 76% of the tokens as of December 2022. This might backfire if they decide to dump the same.
A positive indication is a drop in the 90-day MVRV ratio in 2022. Low MVRV signifies a market bottom and often results in a rally of sorts. For OMG, the MVRV ratio in number seems to be the lowest since mid-July 2022.
OMG price prediction using technical analysis
If you look at the daily chart of OMG, there is a pattern in sight, per data extracted in 2022:
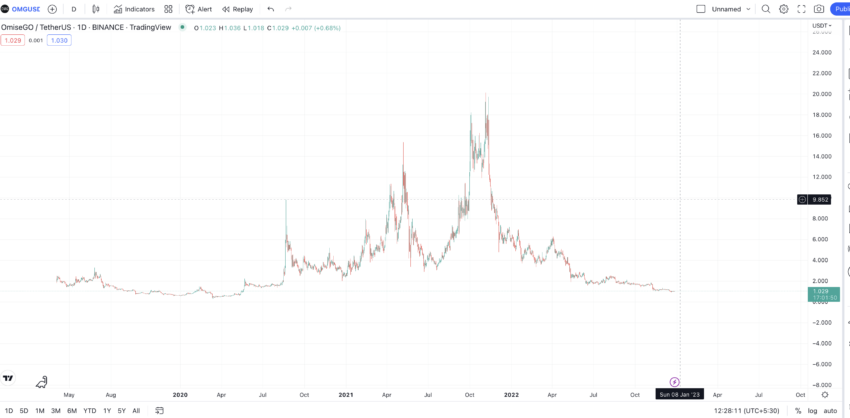
OMG makes a higher high formation, tracing three highs before resting at a peak. It starts making a swing-high pattern from the peak, with one lower high already surfacing.
Therefore, if you take OMG’s daily price chart as symmetrical, the foldback pattern shows there should be other highs on the horizon. Also, we have only considered the clear highs and not the smaller peaks that are scattered throughout the chart.
Price changes and pattern identification
Here is the daily chart again, but this time with all the highs and lows marked clearly:

Let’s take the distance and price changes from D to A, focusing on high-to-low and low-to-high charting. We can then find the distance and price difference between D and C1 via O1, locate the average points, and extrapolate as per requirements.
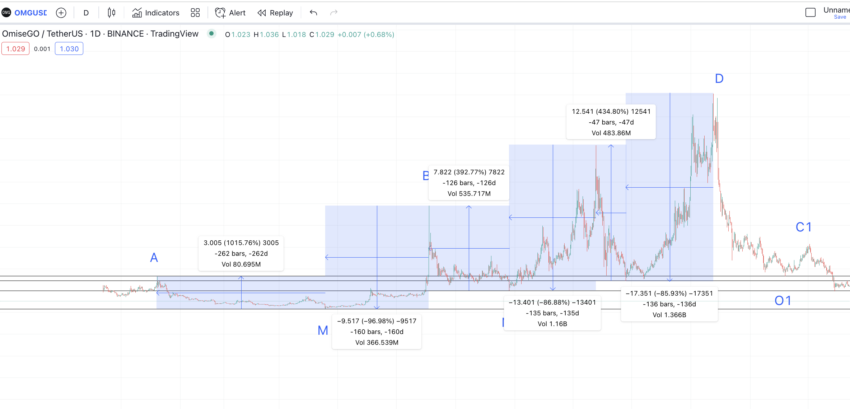
D to O = 136 days and -85.93% price change; O to C = 47 days and 434.80% price change; C to N = 135 days and -86.88% price change; N to B = 126 days and 392.77% price change; B to M = 160 days and -96.98 price change; M to A = 262 days and 1015.76% price change; D to O1 = 111 days and -83.50%
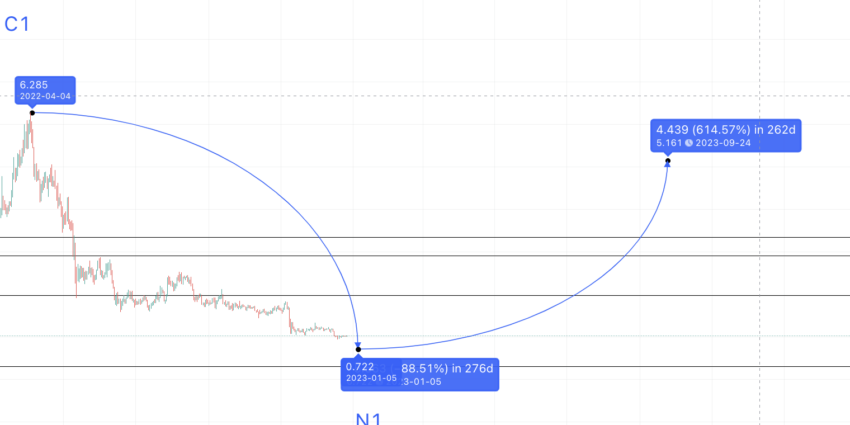
Now, we take the average of the high to low points, both distance and price change, to first locate the next low after C1. We shall name it N1.
The average distance, therefore, is 136 days, and the average percentage drop is 88.32%.
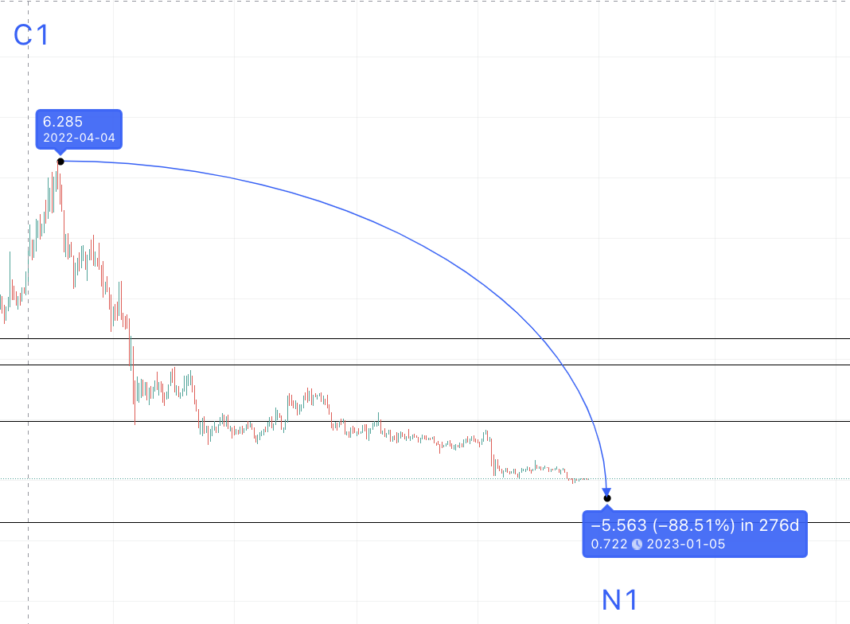
Therefore, the next low can be at $0.722. Do note that this drop might surface in 2023, as we haven’t seen such a drop from C1 in 2022 yet.
Price change: low to high
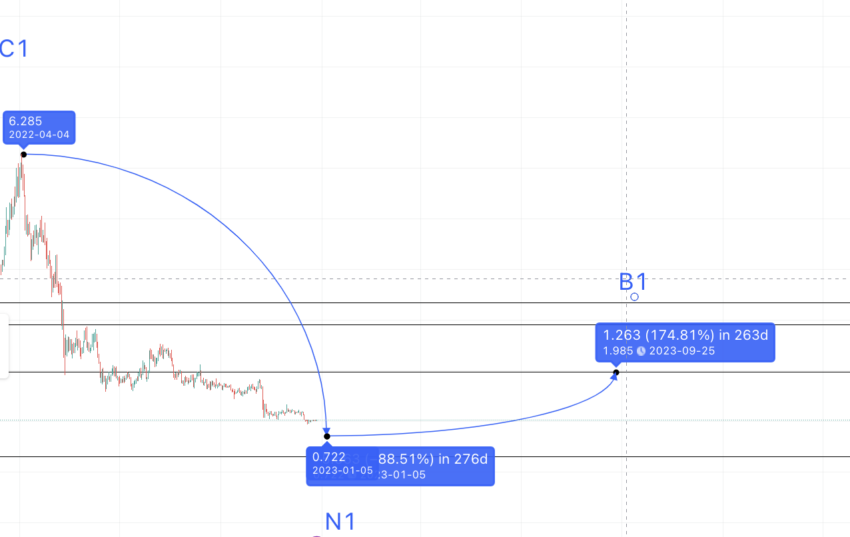
Now, if we take the average of the low to high points, we can get the next point from N1. We can mark this B1.
The average from low to high comes to be: 145 days and at a percentage high of 614%.
The path from N1 to B1 surfaces at $5.61. As it is the bear market, OMG price prediction 2023 might not follow the average distance.
OMG Network (OMG) price prediction 2024
Outlook: Bullish
We predicted similar levels for OMG in 2023. However, we are now recalibrating the price levels to 2024, considering that the bull market might be good for a project like OMG.
Using technical analysis, our OMG price prediction model 2024 returns the low as $0.722. While the projected high is $5.61, OMG might find resistance at $1.982, which is also a strong support line. Keeping the current state of the crypto market and OMG’s lukewarm growth in mind, $1.982 seems more realistic as the maximum price of OMG in 2024.
Note that the lower high pattern continues, and OMG is in a broader downtrend.
Projected ROI from the current level: 150%
OMG Network (OMG) price prediction 2025
Outlook: Moderately bullish
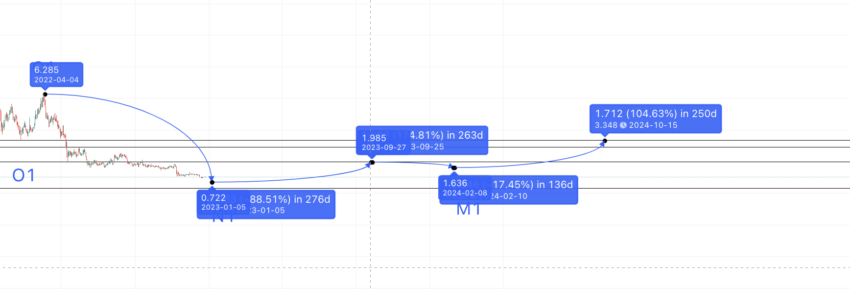
If B1 is the new high, the new low should be in 136 days and at a low of 88.32%.
Therefore, if we chart the next point, the early 2024 low surfaces at $0.229. However, if OMG reaches the 2024 high, the low in 2024-25 should find support at $1.636, a strong support line per the daily chart. This point is marked M1.
Now, from M1 to A1 (the next high), the percentage gain using Table 1 is 614%. However, OMG might not scale that high now, with the token trading volumes on the lower end. Therefore, you can expect it to find resistance at $3.348, which coincides with the low O1.
Now we have data till 2025; we can find the distance between the opposite peaks and discover where the next pattern or A2 can start. So C1 to C comes at a distance of 332 days and at a high of 145.65%. Also, we can assume A2 to be higher than A1 by 2025.

Therefore, as per the OMG Network price forecast model in 2025, the next high might surface at $8.243.
Projected ROI from the current level: 943%
OMG Network (OMG) price prediction 2030
Outlook: Bullish
If the new high is A2, then it might just start a new higher high pattern as the first part of the OMG daily chart. Therefore, we must create a table with the distance from A to D while passing through all the lows.
OMG price prediction 2026: the key to finding the 2030 high
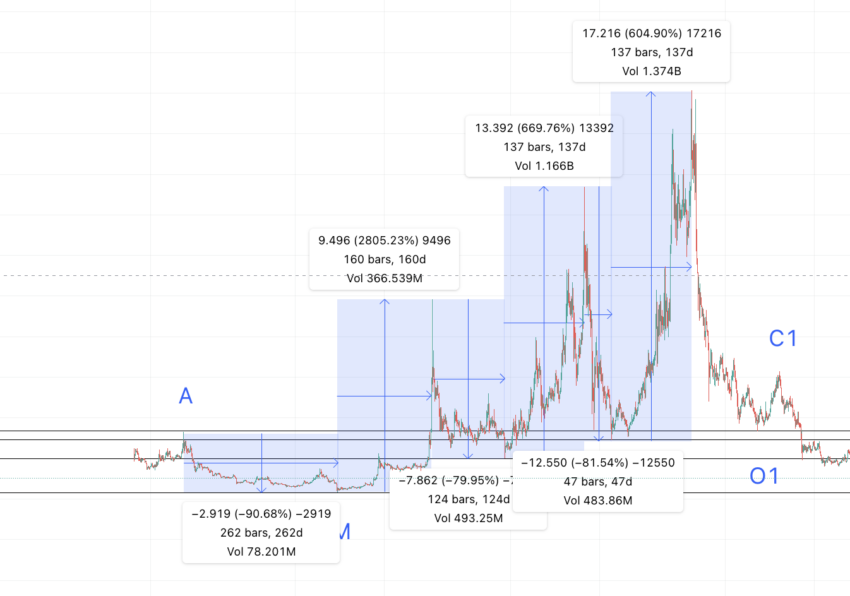
A to M = 262 days and -90.68% price change; M to B = 160 days and 2805.23% price change; B to N = 126 days and -79.95% price change; N to C = 135 days and 669.76% price change; C to O = 47 days and -81.54% price change; O to D = 136 days and 604.90% price change
If we take the average of all high to low points, the percentage drop comes to be: 84.05%
The distance is 135 days. Therefore, from A2 (the high made by the OMG price prediction 2025 model), the next low surfaces at $1.35. However, by now, OMG will have several strong support lines to work with. Therefore, the low in 2026 might surface at $5.40 — at a 32.91% drop.
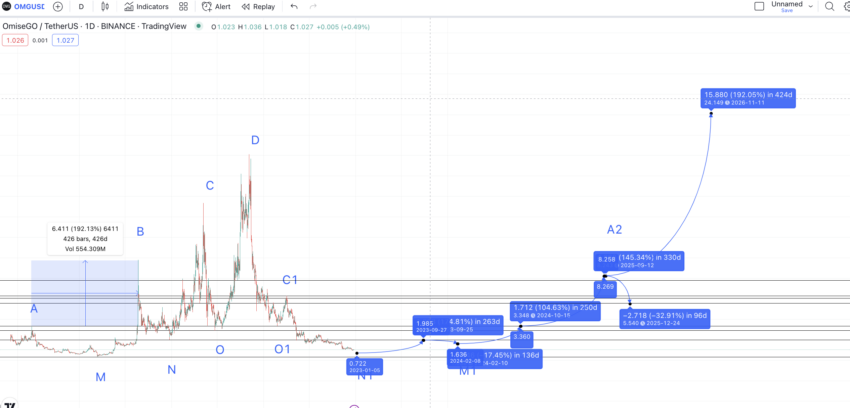
The next high, in 2026, could be at a distance of 426 days and a price growth of 192.13%. This is the exact figure between A and B from the first pattern.
Therefore, from A2, we can plot the B2 at $24.149. If you see the broader chart, by 2026, OMG might be able to form a new chart high of $24.149.
Now, we have a low in 2025 and a high in 2026. We can, therefore, use the Fib indicator to prepare an OMG Network price forecast model for 2030.
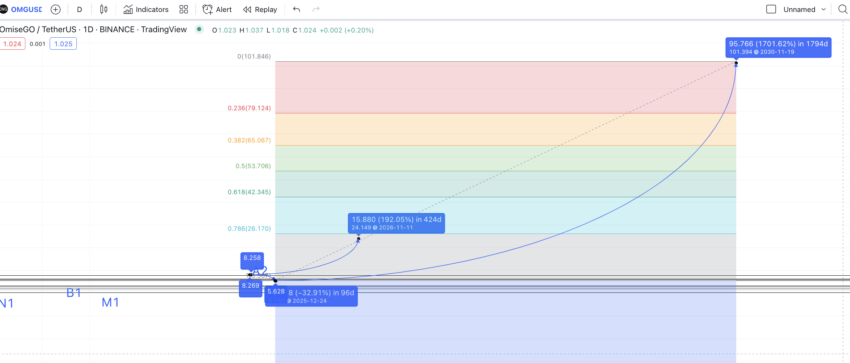
Using the same slope from the last low, we can trace the future price of OMG as per the Fib extension. The top-most level takes support at $101.39, as per the Fib levels.
Projected ROI from the current level: 12734%
OMG Network (OMG’s) long-term price prediction until 2035
Outlook: Bullish
Here is a table for your reference that tracks the price of OMG Network (OMG) tokens till 2035. While OMG’s minimum and maximum price might vary, it’s important to focus mainly on the average price due to crypto volatility.
You can easily convert your OMG to USD
| Year | | Maximum price of OMG | | Minimum price of OMG |
| 2024 | $1.982 | $0.722 |
| 2025 | $8.243 | $5.40 |
| 2026 | $24.149 | $14.97 |
| 2027 | $27.77 | $17.21 |
| 2028 | $36.22 | $18.11 |
| 2029 | $57.95 | $35.92 |
| 2030 | $101.39 | $62.86 |
| 2031 | $121.66 | $94.89 |
| 2032 | $152.07 | $118.61 |
| 2033 | $197.69 | $154.19 |
| 2034 | $237.22 | $185.03 |
| 2035 | $320.25 | $249.79 |
How accurate is the OMG price prediction model?
This OMG price prediction model doesn’t overstate the prices of the OMG Network. Rather, it notes that the network is currently in a period of transition. The technical analysis supports the OMG Network price forecast and respects key support and resistance levels alongside the set pattern. We use fundamentals, consider the ecosystem, and track key on-chain metrics to gauge future prices of the OMG token. As such, this OMG price prediction model is as accurate and realistic as possible, considering the volatile nature of crypto.
Frequently asked questions
Is OMG coin a good investment?
Does OMG coin have a future?
Can OMG coin hit $100?
Does OMG have a max supply?
Is OMG on Ethereum?
Disclaimer
In line with the Trust Project guidelines, the educational content on this website is offered in good faith and for general information purposes only. BeInCrypto prioritizes providing high-quality information, taking the time to research and create informative content for readers. While partners may reward the company with commissions for placements in articles, these commissions do not influence the unbiased, honest, and helpful content creation process. Any action taken by the reader based on this information is strictly at their own risk. Please note that our Terms and Conditions, Privacy Policy, and Disclaimers have been updated.


