

Have you ever heard of a blockchain-free decentralized project facilitating communication and data transfer between IoT (Internet of Things) devices? If not, you might be intrigued by IOTA — a DAG-driven project that’s scalable, fast, and affordable. Throughout this IOTA price prediction, we shall look at the future of this ecosystem, its short-term and long-term price forecast, tokenomics, and more.
- IOTA price forecast and the fundamental analysis
- IOTA price prediction and the associated tokenomics
- Key metrics and the impact on IOTA forecasts
- IOTA price prediction and technical analysis
- IOTA (MIOTA) price prediction 2023
- IOTA (MIOTA) price prediction 2024
- IOTA (MIOTA) price prediction 2025
- IOTA (MIOTA) price prediction 2030
- IOTA (MIOTA’s) long-term price prediction up to the year 2035
- Is the IOTA price prediction theory accurate enough?
- Frequently asked questions
Want to get MIOTA price prediction weekly? Join BeInCrypto Trading Community on Telegram: read MIOTA price prediction and technical analysis on the coin, ask and get answers to all your questions from PRO traders! Join now
IOTA price forecast and the fundamental analysis
Don’t worry; this article won’t delve into the complex technological intricacies of IOTA.
Rather, we will focus on the key features that position IOTA as a sustainable, long-term project. As previously noted, IOTA serves as both a data transfer mechanism and a transaction settlement layer for the Internet of Things (IoT). Its consensus mechanism is managed by a rapid proof-of-work puzzle, emphasizing speed and efficiency.
Simply put, the more popular IOTA gets, the faster we can expect it to be, as the transaction verification setup is quick yet secure.
“The purpose of IOTA is to make a groundbreaking protocol owned by no one and everyone; reducing the barrier to entry for devs is crucial.”
David Sønstebø, Founder of IOTA: X
The project claims to be a feeless, value transfer protocol. And here are the possibilities that one can explore using IOTA as the base layer:
- Secure digital identity
- Improved sustainability
- Ease of making global trades

Overall, IOTA, as a project, looks convincing. Moreover, the IOTA foundation mentions that it isn’t seeking profits; its sole purpose is to make the network better and beefier. And what’s interesting is that IOTA has already partnered with the likes of Volkswagen, with smart projects in focus.
IOTA’s new initiative:
IOTA price prediction and the associated tokenomics
IOTA had a fixed supply cap of almost 2.80 quadrillion coins. Yet, it was later changed to 4.6 quadrillion, much to the surprise of the crypto community.
And 100% of the supply is now circulating, making the entire tokenomics model liquid and tradable. At some platforms, the fixed supply is marked as 2.78 billion MIOTA. This is IOTA’s way of batching coin stacks as one.
Coming to usage, IOTA was initially a utility coin, but most importantly, it facilitates transactions atop the IOTA network.
This means that once the adoption starts picking up, the liquidity related to IOTA will be of serious substance.
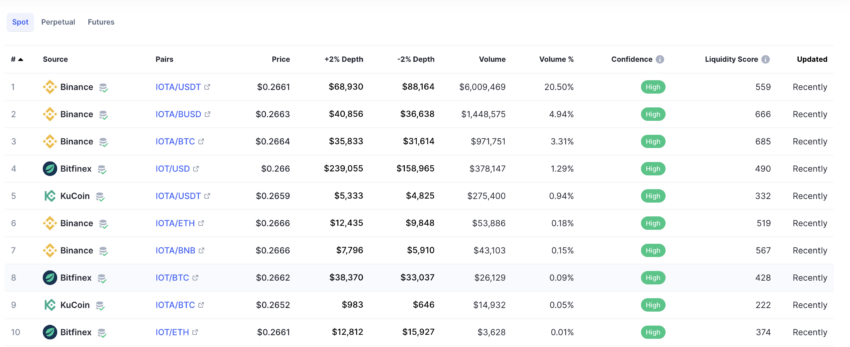
As of February 2023, the trading markets associated with IOTA are relatively diverse. Binance’s IOTA-USDT pair held most of the limelight at 20.50% of the total volume. The liquidity score across platforms shows relatively high numbers for specific trading pairs.
Did you know? As of December 2023, Binance’s IOTA/USDT pair comprises almost 37% of IOTA’s total trading volume. Following Binance is OKX at 4.91%.
Also, the coin-based allocation is as follows:
- 5% to the IOTA foundation
- 5% as the IOTA ecosystem fund
- 90% to investors via ICO
Notice that most of the IOTA coins are with the investors, making the entire tokenomics model look transparent.
Key metrics and the impact on IOTA forecasts
Let us take a closer look at the monthly metrics of IOTA as of February 2023. A price surge since Feb. 19, 2023, is visible, courtesy of increased market cap and trading volume. However, the current trading volume associated with IOTA is still far from the peak of Jan. 28, 2022.

Notably, IOTA prices have started picking up pace towards the end of 2023. This can be attributed to the increase in the market cap and trading volume.
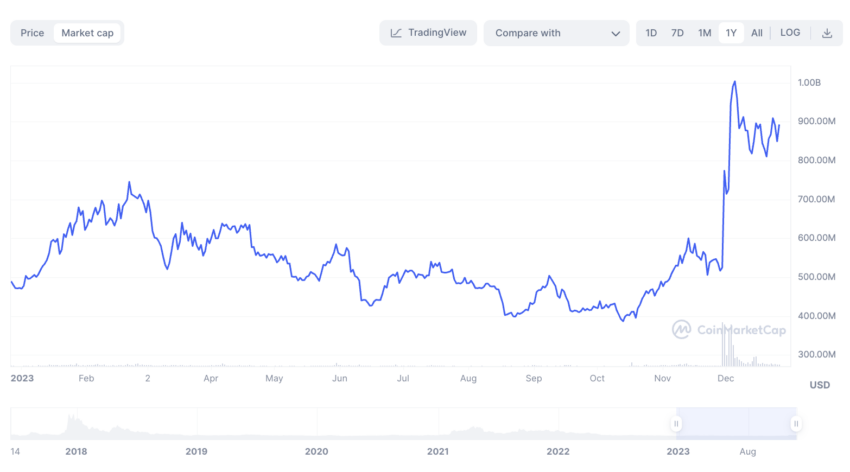
If you look at the yearly metrics, the market cap and trading volume levels are still quite muted compared to the 2022 levels. Yet, increasing trading volume is a great way to keep the price volatility manageable, making the IOTA forecasts look more optimistic. However, this chart is from early 2023; since then, IOTA has moved faster across multiple counters.

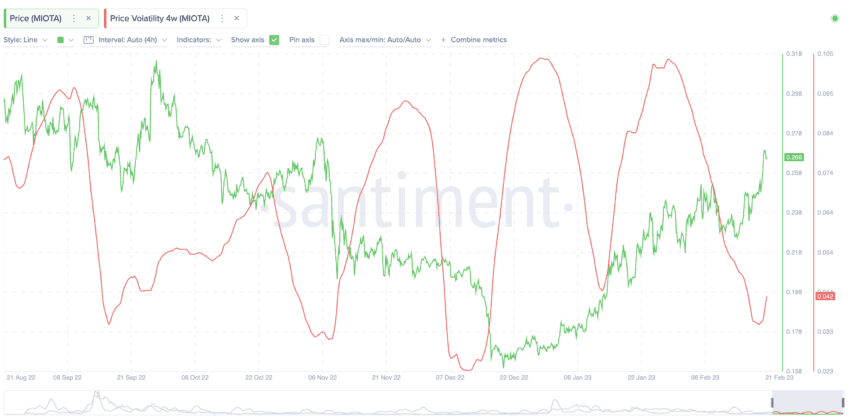
The volatility chart also demonstrated an interesting trend. Notice that the volatility metric seems to be rebounding from the bottom. And if you look at the price history, the prices surged post a volatility bottom. However, as we have already seen a bottom, the possible rise in volatility might lead to some short-term consolidation at IOTA’s counter.
As of December 2023, the price volatility is on its way down, which can be a good sign for IOTA, provided the same bottoms out quickly.
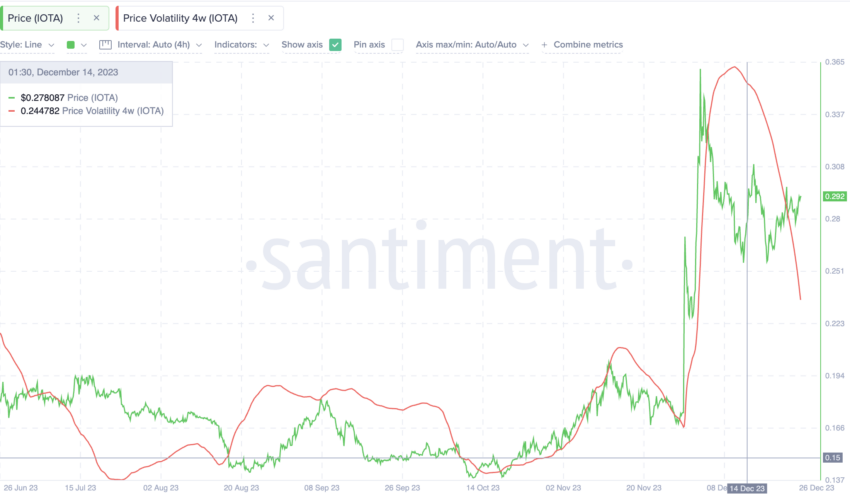
Overall, IOTA’s rise in trading volume and volatility-specific price history looks optimistic.
IOTA price prediction and technical analysis
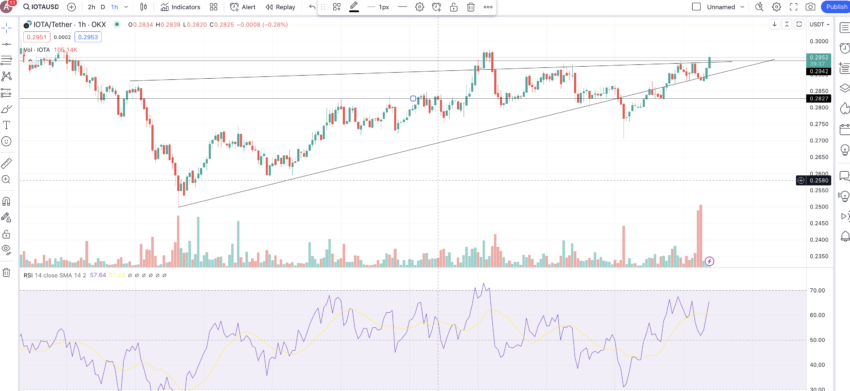
Before we delve deeper into the broader patterns and weekly charts, it is important to examine the short-term IOTA price analysis closely.
Our December 2023 analysis
As of now, IOTA is trading inside an ascending wedge, with the upper trendline waiting to be breached after a rebounding pullback. For a more convincing move on the upside, IOTA needs to breach past the crucial resistance level of $0.294.
Let us now shift our attention to the weekly charts.
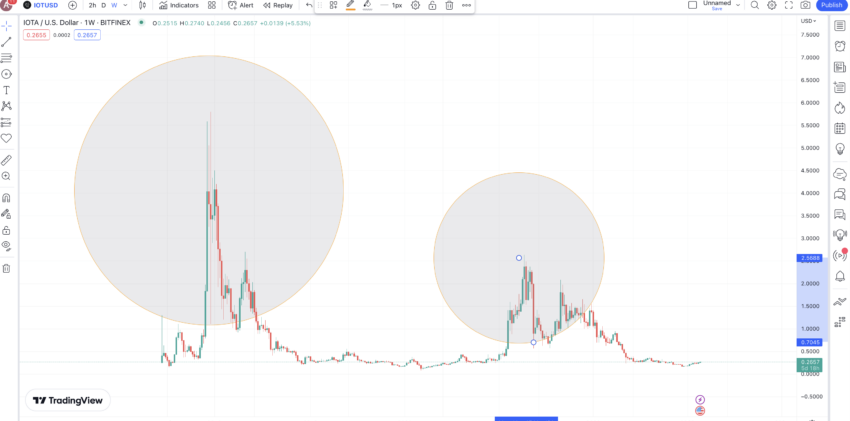
Here, we are using the IOTA-USD weekly chart from Bitfinex. We chose this as we now have a price history that dates back to 2017. So we will have more data points on which to base our calculations.
The price history of IOTA starts with a high, leads into a price peak, and then a lower high — before starting to move in a range. The next pattern starts similarly — with a high, which then leads into a peak and is then followed by another high before dropping and falling in a range.
The most obvious expectation would be to experience another high soon that kickstarts the third pattern.
We have encircled the two formations to help you verify the formations.
But why are we expecting a new high and the initiation of a new pattern and not another range-bound phase? The chart below holds the answer:
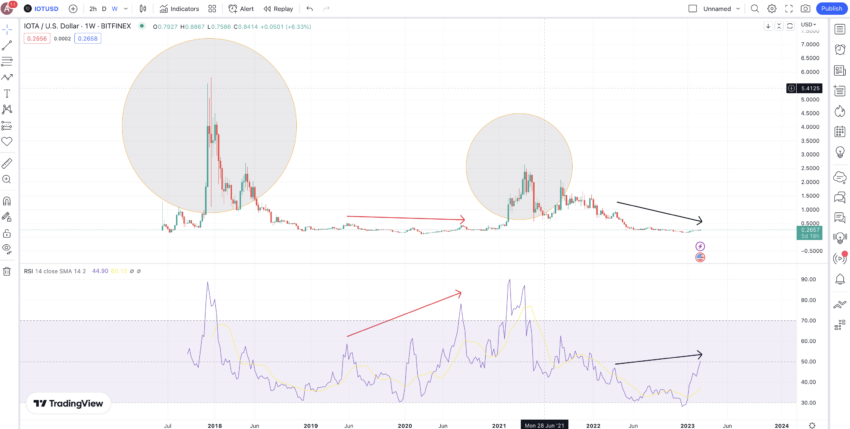
The previous part of the pattern shows a new high, and the second pattern started when the RSI showed a bullish divergence — arrows marked in red. We can see a similar bullish divergence hinted at by the weekly RSI — arrows marked in black. Hence, a price surge could be possible.
Price changes
Now that we have established the pattern(s), let us locate the crucial points on the chart.
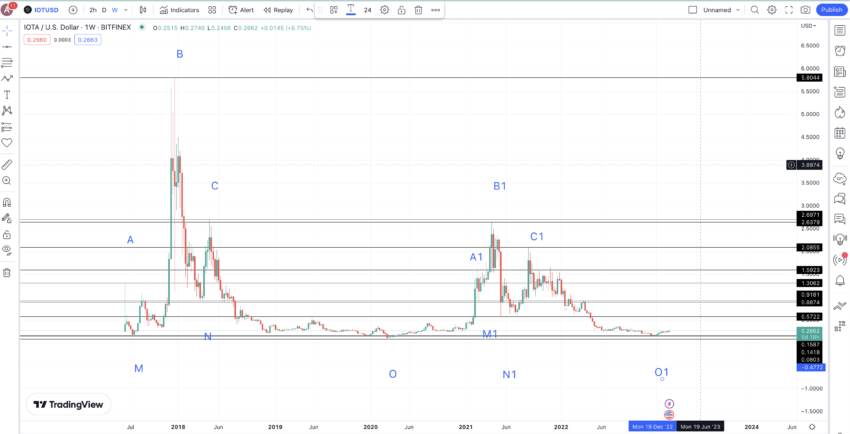
We now have to locate the price percentage and distance between every point across two paths: A to O and O to O1. This will help us with the data to locate the IOTA price forecast level in the short and long term.
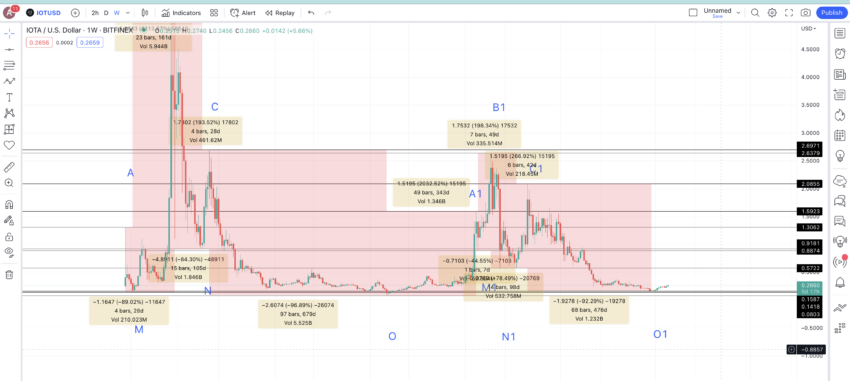
Utilizing the datasets mentioned earlier, we can calculate the average price percentage change and the duration between each low-to-high and high-to-low point for IOTA.
Based on non-negative column values, the average increase for low-to-high movements is a substantial 1360.99% over an average period of 125 days. It’s important to note that in slower market conditions, the smallest expected price hike could be around 193.52%, extending from 125 days up to a maximum of 343 days.
On the other hand, for high-to-low movements, the average decrease, using negative values, is 80.92% over an average period of 232 days. As the data indicates, the smallest expected percentage drop could be about 44.55%, particularly when the crypto market is bullish. This data is now ready to be used for future price forecasting for IOTA.
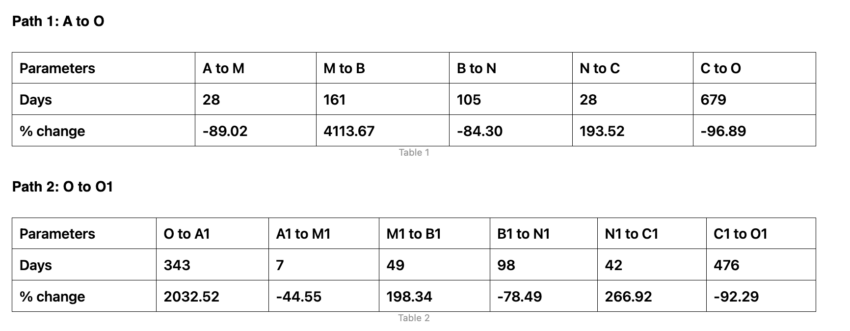
IOTA (MIOTA) price prediction 2023
Notice how we predicted a 2023 high of $0.417 for IOTA. The prices, on the back of underwhelming adoption and a supply cap change, still managed to reach $0.33. Here is what our 2023 IOTA price prediction comprised:
Now that we have the last low on the chart as O1, we can use the expected hike of 193.52% (keeping the current market conditions in mind) to locate the new high or A3 at $0.4179. As there is a current rally in progress, we chose to use the 125-day average timeframe to work with. This places the expectation of the IOTA price prediction for 2023 somewhere in May 2023.
The IOTA price prediction low could drop by 44.55% (the minimum percentage drop per the tables above) in 232 days, putting the minimum price in 2023 at $0.2299.
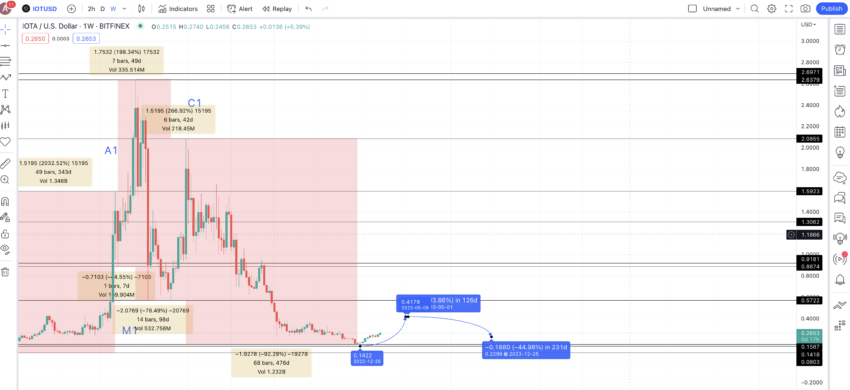
IOTA (MIOTA) price prediction 2024
Outlook: Bullish
By the end of 2023, the expected low could pave the price of IOTA on a higher-low path. Hence, the next high from the 2023 low could again surface in 125 days, and this time at a price peak of 198.34% (the second lowest percentage peak per the tables above).
Notice that we haven’t used the average peak percentage of 1360.99% yet, as even in early 2024, we might see a rebuilding phase across the broader crypto market.
The growth percentage of 198.34 puts the next high at $0.6853. This could be the 2024 high for IOTA. The IOTA (MIOTA) price prediction for the next low could take support at $0.38, keeping the minimum percentage drop of 44.55% into consideration.
Projected ROI from the current level: 135%
IOTA (MIOTA) price prediction 2025
Outlook: Bullish

Consequently, we can expect the 2025 high to surface at 266.92% (which is the third lowest price percentage peak) from the low, keeping the up-trending path intact.
Hence, the price of IOTA in 2025 can go as high as $1.39. By this time, the price of IOTA had already crossed the crucial resistance level of $1.31.
The lowest price in 2025 can surface at $0.77, keeping the earlier drops and timeframes in mind.
Projected ROI from the current level: 377%
IOTA (MIOTA) price prediction 2030
Outlook: Bullish
From the low in 2025, we can expect the next high to hit the resistance of $1.31, and that too within 125 days. This way, we can ensure that the price of MIOTA respects the high-peak-high pattern a third time over.
This could be high in 2026. The low in 2026 could take support at the crucial level of $0.92, as by now, we can expect the price of MIOTA or IOTA to be on an inherently strong future path.
Also, now that we have the 2026 high (recalibrated to trace the previous patterns) and 2025 low, we can extend the price action till 2030, using the Fib levels. This puts the IOTA price prediction for 2030 at $8.05.
And by doing this, we can expect the price action of IOTA to breach its current all-time high of $5.69 by late 2029 or even early 2030.
Projected ROI from the current level: 2665%
IOTA (MIOTA’s) long-term price prediction up to the year 2035
Outlook: Bullish
Using IOTA’s maximum and minimum price levels till 2030, we can extrapolate the same through 2035. Here is a table that might help.
You can easily convert your IOTA to USD here
| Year | | Maximum price of IOTA | | Minimum price of IOTA | |
| 2023 | $0.3313 | $0.1391 |
| 2024 | $0.6853 | $0.38 |
| 2025 | $1.39 | $0.77 |
| 2026 | $1.31 | $0.92 |
| 2027 | $1.96 | $1.21 |
| 2028 | $3.24 | $2.01 |
| 2029 | $4.21 | $3.28 |
| 2030 | $8.05 | $5.69 |
| 2031 | $12.07 | $9.41 |
| 2032 | $15.69 | $12.23 |
| 2033 | $23.54 | $18.36 |
| 2034 | $30.61 | $23.88 |
| 2035 | $45.92 | $35.82 |
Is the IOTA price prediction theory accurate enough?
This IOTA price prediction model doesn’t randomly project the minimum and maximum prices of the crypto. Instead, it considers price history, data-backed technical analysis, tokenomics, and fundamental insights — making the forecast accurate, reliable, and holistic.
Frequently asked questions
What will IOTA be worth in 2025?
Can IOTA reach $50 dollars?
What will IOTA be worth in 2030?
What is IOTA’s all-time high?
Disclaimer
In line with the Trust Project guidelines, the educational content on this website is offered in good faith and for general information purposes only. BeInCrypto prioritizes providing high-quality information, taking the time to research and create informative content for readers. While partners may reward the company with commissions for placements in articles, these commissions do not influence the unbiased, honest, and helpful content creation process. Any action taken by the reader based on this information is strictly at their own risk. Please note that our Terms and Conditions, Privacy Policy, and Disclaimers have been updated.


