

iExec RLC is a blockchain-specific ecosystem that allows users to monetize computing power, data, and even apps. Shared computing is an undoubtedly innovative use case. But does that make the iExec’s native token, RLC, a good buy? This piece builds a comprehensive iExec RLC price prediction and considers the robustness of the iExec project as a short and long-term investment.
- iExec RLC price prediction and the role of fundamental analysis
- iExec RLC tokenomics
- iExec RLC price forecast and on-chain metrics
- RLC price prediction and technical analysis
- iExec RLC price prediction 2023
- iExec RLC price prediction 2024
- iExec RLC price prediction 2025
- IExec RLC price prediction 2030
- iExec RLC (RLC’s) long-term price prediction until 2035
- Is this iExec RLC price prediction model accurate?
- Frequently asked questions
Want to get RLC price prediction weekly? Join BeInCrypto Trading Community on Telegram: read RLC price prediction and technical analysis on the coin, ask and get answers to all your questions from PRO traders! Join now
iExec RLC price prediction and the role of fundamental analysis
The short-term price action of any digital asset depends on the price chart. A long-term price prediction always depends on the project’s fundamentals. iExec RLC offers on-demand computing power relevant to myriad verticals like healthcare, fintech, and more. But it is the underlying open-source software that makes this possible.
Did you know? iExec RLC is the first ecosystem to leverage blockchain-based cloud computing innovation, offering on-demand computing resources.
Everything on the iExec RLC network is of value, courtesy of a simple incentivizing model. Here is what it looks like.
- Users can monetize computing resources on the iExec RLC network as iExec workers. This way, they can earn the native RLC tokens.
- Users can also monetize their algorithms (ideas), DApps, and even datasets, offering them to network participants with similar interests.
- Proof-of-contribution, or PoCo, is the go-to consensus mechanism that tracks participants offering off-chain resources. In simple words, the network is secured by the givers.
- An underlying decentralized cloud infrastructure works like a web3 marketplace, allowing users to pick any resource they desire.
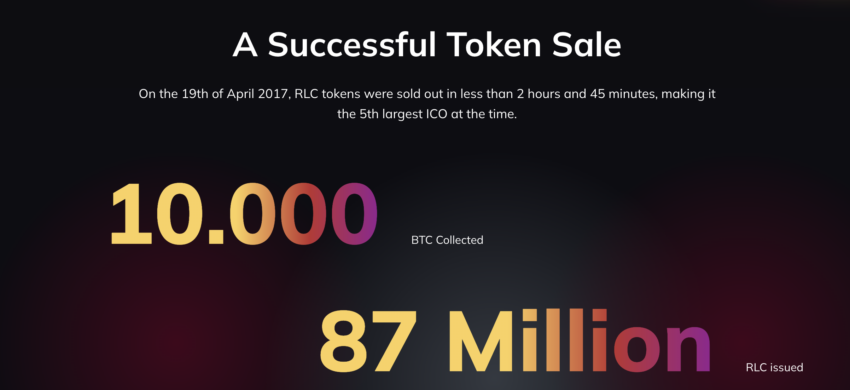
Trivia: iExec RLC’s ICO sold out in under 3 hours, showing the initial popularity garnered by the project.
The iExec RLC price prediction begins on a positive note. The project itself comes with a relatable use case. The native token, RLC, follows a transparent incentivizing model, helping developers and providers monetize their resources.
“To sumup, we landed on Coinbase Pro, then Huobi, then Bithumb opened the RLC/KRW pair, and finally listed on the regular Coinbase exchange.
And we reached a new ATH at 5.64 USD !
On the way to the next step !!!”
Giles Fedak, Founder of iExec RLC: X
iExec RLC tokenomics
As mentioned, the native RLC token is the ecosystem-specific medium of exchange, helping create that simple incentivizing layer. RLC’s ICO was also a success. The tokenomics is relatively simple, with RLC having a pre-mined, capped supply of almost 87 million.
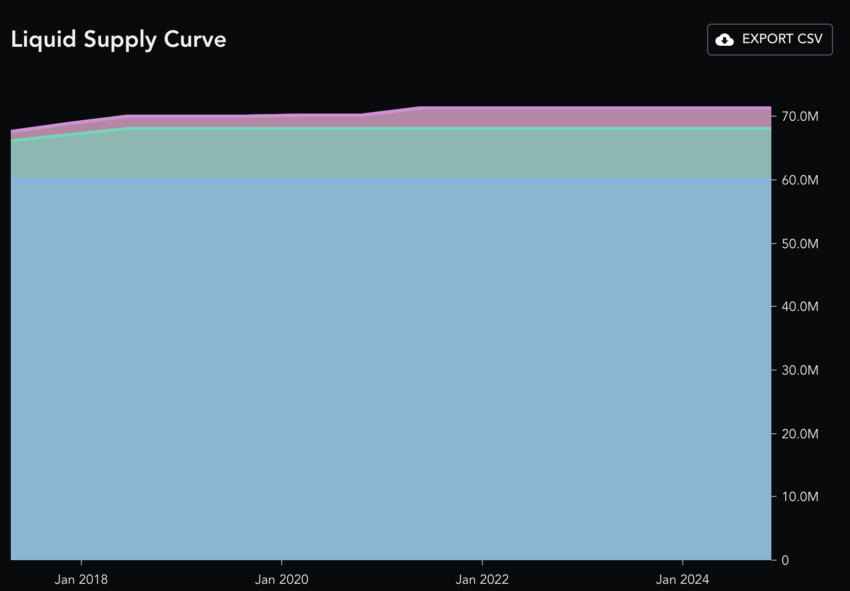
In that 2017 ICO/crowd sale, most of the capped supply was given to 1,100 network participants. 84.1% moved to the network participants, whereas founders and iEXEC RLC R&D held onto the remainder. 83% of the capped supply forms the circulating or liquid supply.
The tokenomics model is straightforward and transparent. Once the circulating supply equals 100% of the fixed supply, RLC scarcity will creep in. This will especially be apparent as the network grows and more providers and requesters enter the mix.
iExec RLC price forecast and on-chain metrics
The success of any crypto project can be attributed to the growth of the on-chain metrics, including the wallet addresses. For iExec RLC, even the development activity comes to the fore. More developers and providers joining the network might result in further optimism regarding adoption.
For starters, if you look at the iExec analytics, it is evident that 54.50% of the circulating supply, as of December 2023, is Whale-managed. What’s optimistic about the price action is that out of 100% RLC holders, only 2.49% are regular traders.
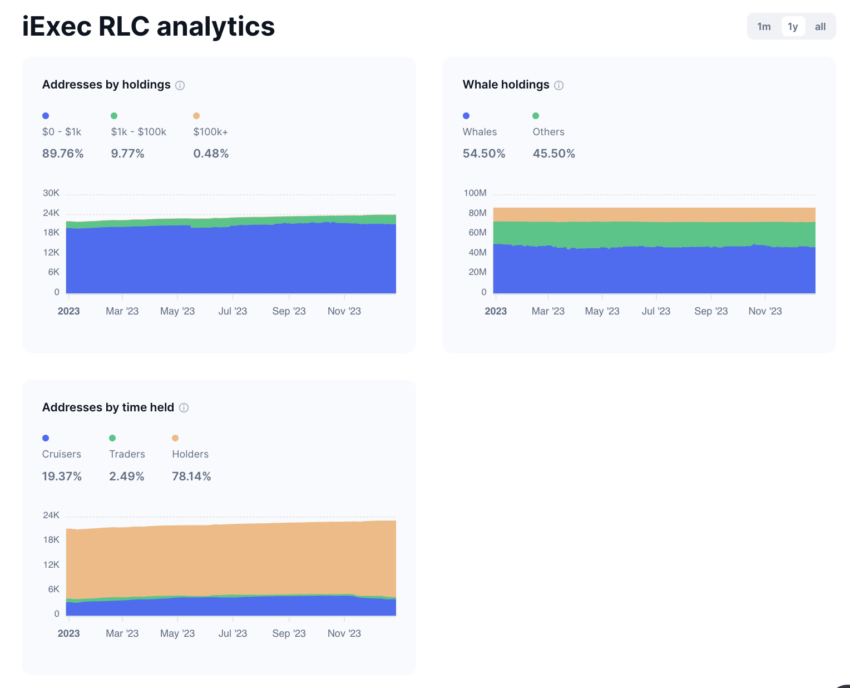
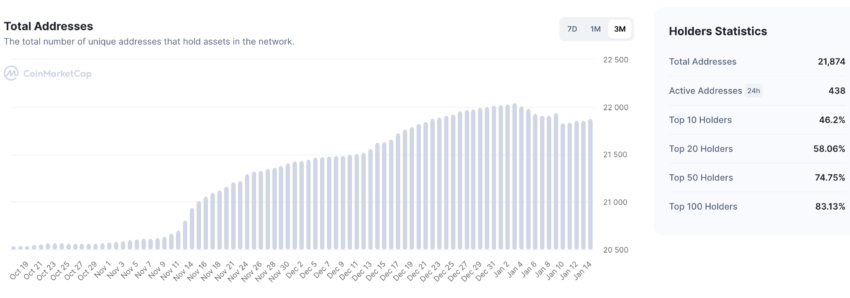
This aligns with our unique address chart from early 2023. As visible, there had been a dip in the holding patterns in January, which led to a correction. However, the latest relief rally seems to push the address count slightly higher. The only concern was that, at that time, the top 100 RLC holders controlled almost 83% of the overall circulating supply.
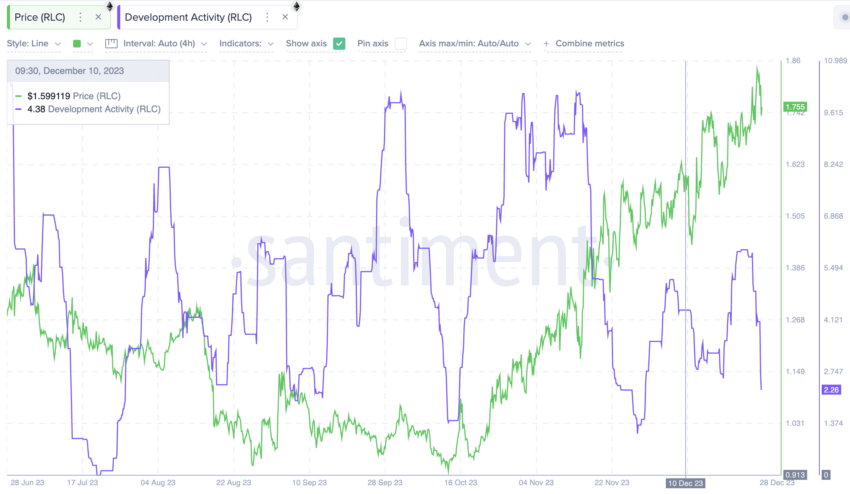
The chart illustrating iExec RLC’s development activity also offers insight. When combined with the price action, the recent surge in the price of RLC is aligned with the peaking development activity as of December 2023. This shows that the positive impact on prices isn’t just due to the market-wide rally. Developers might be actually building and using the resources available on the iExec RLC network.
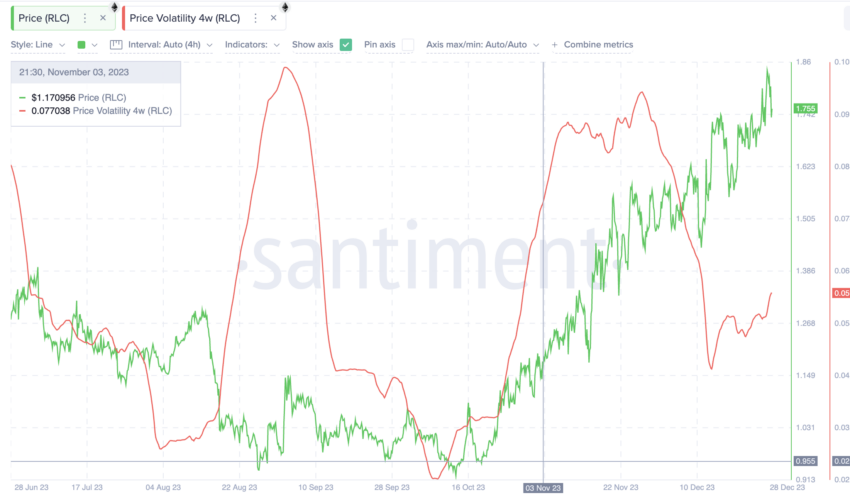
Last but not least, the four-week volatility is still lower compared to early November. Pairing this metric with the price action shows the average price of RLC takes a hit every time the volatility increases. Therefore, the better the market conditions are, the better the news might be for the price of iExec RLC.
RLC price prediction and technical analysis
Before we start looking at the 2024 RLC price prediction levels, we should throw in a short-term price analysis to understand the current trend.
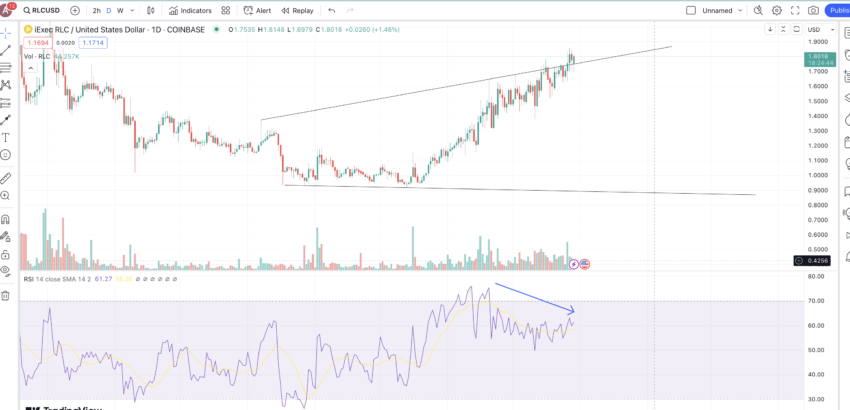
Our December 2023 analysis
Even though RLC seems to have broken out of the ascending wedge, all might not be well. With the upper trendline working as a strong resistance line, a rebound seems evident. Even the RSI is sloping downwards, hinting at some bearish divergence. This points to a short-term correction at RLC’s counter.
Now we have considered the fundamentals, tokenomics, and a handful of metrics, it’s time to delve into pattern-hunting. Here is the raw weekly RLC-USDT chart to begin:
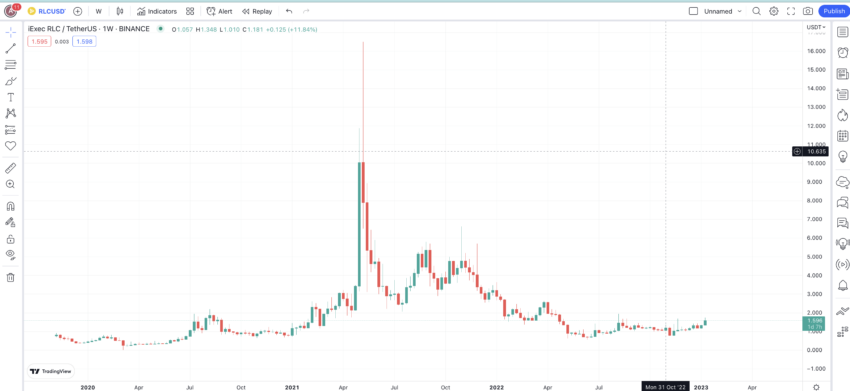
A clear trend is noticeable. RLC starts trading in a range, makes a couple of higher highs, and then assumes a peak. From that peak, we see the RLC chart turning into a mirror image of the left-sided chart, making a swing high or a lower high formation. And finally, as of Jan. 14, 2023, RLC’s prices are trying to move up, which might indicate that the left-sided pattern is trying to repeat itself.
Here is the chart with all the key points in play:
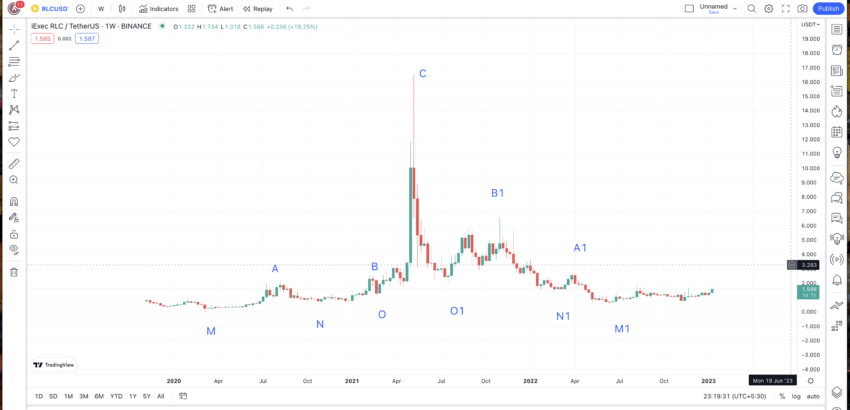
Notice that the pattern left-side pattern starts with a low, followed by a high. Therefore, if the concept of foldback is followed, the next high for RLC could appear anytime after a low or M1, per the given chart.
Price changes
The left side of the chart, comprising points M to C, looks symmetrical to the right side of the chart, M1 to C. Therefore, we shall now plot the distance and price change percentages between all the points from M to C and then M1 to C (reverse as the right side looks like the mirror image of the left side).
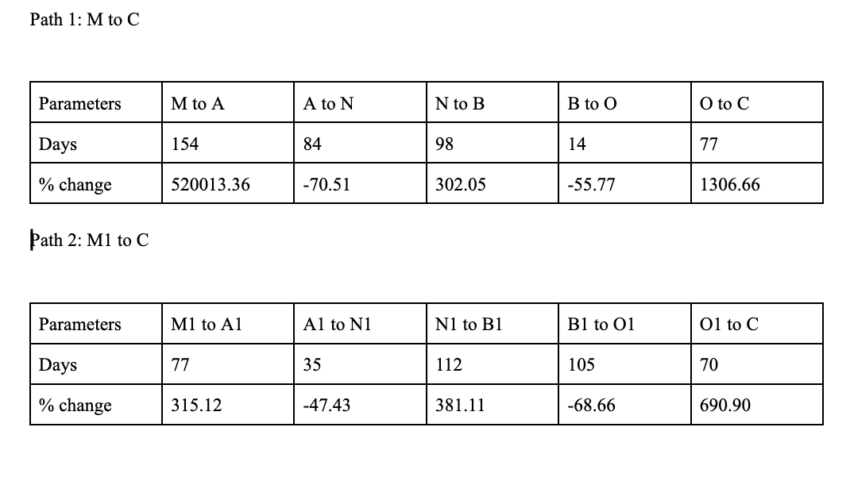
Calculations
Now we have all the datasets relevant to the highs and lows on the chart. So, we can use the average price change percentage and distance of the lows-to-highs to calculate the next point, A2.
We will keep extremely high percentage values out as the current state of the crypto market might not support a 6-figure hike, like M to A. We can, however, keep every distance value in consideration when calculating the average time RLC might take to move from any lowest point to the highest.
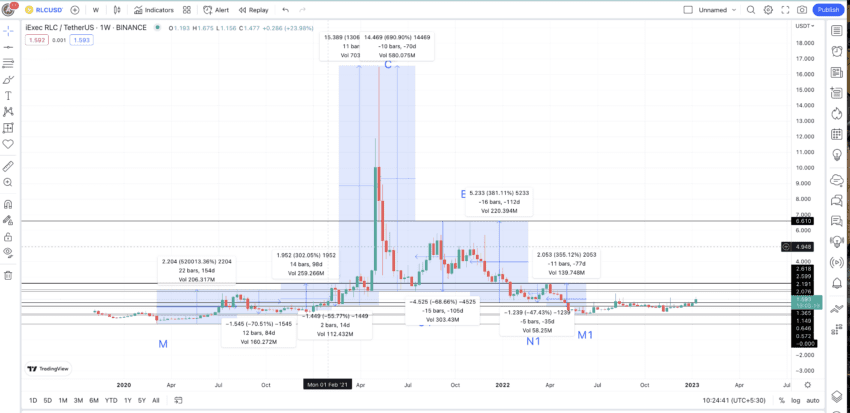
Therefore, the average price change percentage from a low to a high would be 98 days and 599.17%. Still, the maximum distance and the minimum price change percentage figures are 154 days and 302.05%. We will keep these figures handy to ensure RLC can move at least to those levels during the next high. Yet, the distance can vary and go as high as 588 days — the sum of all the low-to-high percentage values — considering the bearish nature of the crypto market.
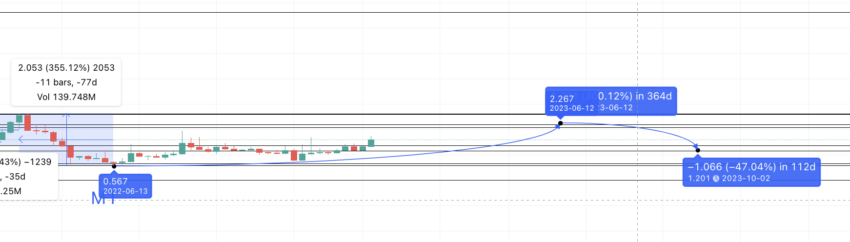
Considering the current state of the crypto market, the next high or A2 could surface at $2.27. As the distance might vary from 98 days (already passed) to 588 days, we take a year from the previous low to locate the mentioned point.
iExec RLC price prediction 2023
We expect RLC to reach $2.27 in 2023. It touched $2.25 with ease and, as of December 2, 2023, is trading at $1.8. Let us read more into the analysis.
From the data above, we have calculated that the RLC could form a high of $2.27 in 2023. We can also refer to the tables above for the low-level iExec RLC price prediction. Here, we must find the average price drop and distance between highs and lows.
The average from Table 1 and Table 2 is 59.5 days and -60.59%. As we are still in the bear crypto market, the distance between the highs and lows can go as high as 105 days — the highest value from the tables above. In the case of market recovery, the minimum drop can be around 47.33%, as seen from the tables above.
Therefore, from our predicted high A2, the forecast line puts the lowest price of RLC in 2023 at $1.20.
iExec RLC price prediction 2024
From the 2023 low, we can project the next high or B2 on the chart. We can use the low-to-high average price hike and distance. Or, we can take the maximum distance and minimum hike from a low to another high to locate the next point.
Taking the maximum distance of 154 days and the minimum price hike of 302.05%, we get to the next level at almost $4.86. However, RLC has a very strong resistance at $2.62, which is where the 2024 high might surface, considering the given adoption rate and network growth.
The low in 2024 might respect the important support line of $1.365 and surface at that level in the next 105 days or less. We can mark the same on the chart for our reference at $1.365.
Our RLC price prediction model seems successful. The drop from the high in 2024 to the low in 2024 respects the 47.33% drop we discussed previously.
Projected ROI from the current level: 45%
iExec RLC price prediction 2025
Outlook: Bullish
We can plot the iExec RLC price prediction points from this level for 2025. Using the data from the table, we can put the same at a minimum high of 302.05%. The distance can be as low as 98 days (which would then put the high in 2024) or even 588 days — provided RLC takes more time to become popular. Keeping the average distance in mind, we can plot 2025 high at $5.52 in early 2025.
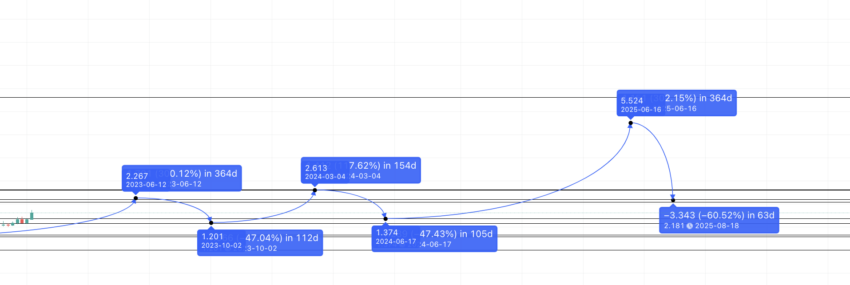
The lowest point could be in 59.5 (60) days and at a drop of 60.59% — using the average figures from the tables above. This puts the RLC price prediction for 2025 low at $2.81.
Projected ROI from the current level: 206%
IExec RLC price prediction 2030
Outlook: Bullish
Now, we have the lowest level for RLC in 2025. We can use that to locate the next high. The next high surfaces are in 2026 and at $8.781, using the maximum distance of 154 days and a minimum price gain of 302.05%.
If we connect the 2025 low and 2026 high using the Fibonacci indicator, we can extrapolate the iExec RLC price forecast till 2030. The projected path puts the iExec RLC price forecast level for 2030 at a high of $74.07.
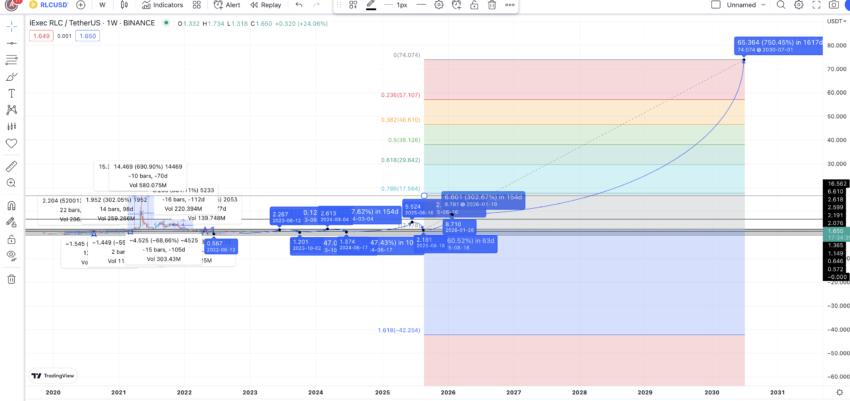
But there is a catch. Notice that for this maximum coin price expectation to hold, the price of iExec RLC must cross its previous all-time high of $16.26 by 2028. Also, this could be the price to beat for iExec RLC in 2028.
Projected ROI from the current level: 4015%
iExec RLC (RLC’s) long-term price prediction until 2035
Outlook: Bullish
Now, we have visibility on the RLC price prediction 2030 model. We can use the calculations and data from above to trace the path till 2035. Here is the table for the same.
You can easily convert your RLC to USD
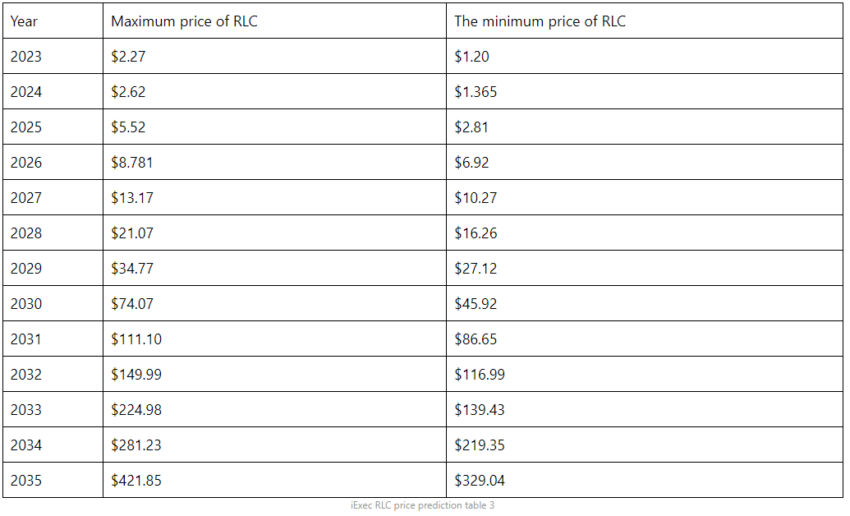
Note that every data point should not be taken as absolute. Any year’s price of iExec RLC will still depend on other metrics. These include market cap, trading volume, the overall state of the crypto market, and other factors.
Is this iExec RLC price prediction model accurate?
As an innovative project, iExec RLC has a decent fundamental grounding. While we have embarked on detailed iExec RLC technical analysis, network growth, and on-chain metrics are also considered in this piece. This forensic approach ensures that this price prediction is reliable and practical. Of course, prices are subject to change in the volatile crypto market. Importantly, bull and bear markets are likely factored into this prediction, as is predicted network growth.
Frequently asked questions
What is iExec RLC (RLC)?
Is iExec RLC a good investment?
What does iExec RLC do?
How much will RLC be in 2030?
What is the all-time high for iExec RLC?
Disclaimer
In line with the Trust Project guidelines, the educational content on this website is offered in good faith and for general information purposes only. BeInCrypto prioritizes providing high-quality information, taking the time to research and create informative content for readers. While partners may reward the company with commissions for placements in articles, these commissions do not influence the unbiased, honest, and helpful content creation process. Any action taken by the reader based on this information is strictly at their own risk. Please note that our Terms and Conditions, Privacy Policy, and Disclaimers have been updated.


