The prices of both BEAM and LTO are trading inside bullish continuation patterns, which suggest that a breakout will soon occur.
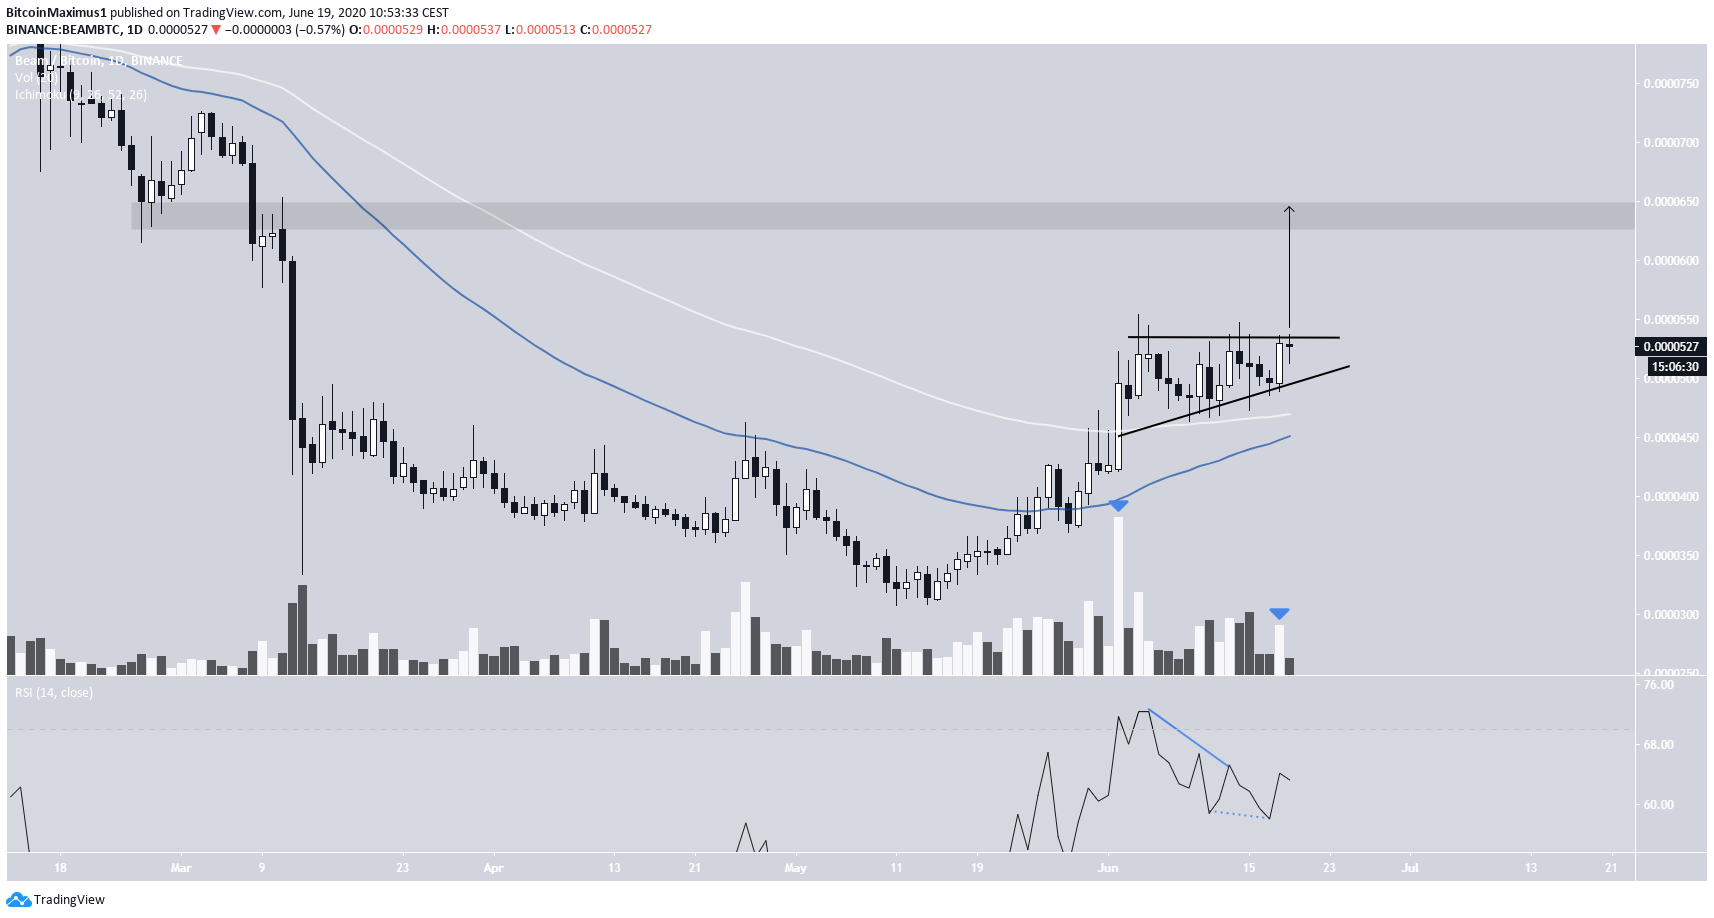
Beam (BEAM)
The BEAM price began an upward move on May 15 and has been increasing since. The biggest spike occurred on June 2, when the price created a bullish engulfing candlestick with considerable volume. It moved above both the 50 and 100-period moving averages (MA), which are now acting as support.
Since then, the price has been trading inside an ascending triangle, which is considered a bullish pattern. A breakout from this pattern is made even more likely by the fact that the triangle was created after an extended upward move.
While there is bearish divergence on the daily RSI, a drop has already occurred. There is a hidden bullish divergence pattern forming after the original one.
If the price breaks out, it would be expected to rise at least to the next resistance area at 645 satoshis.
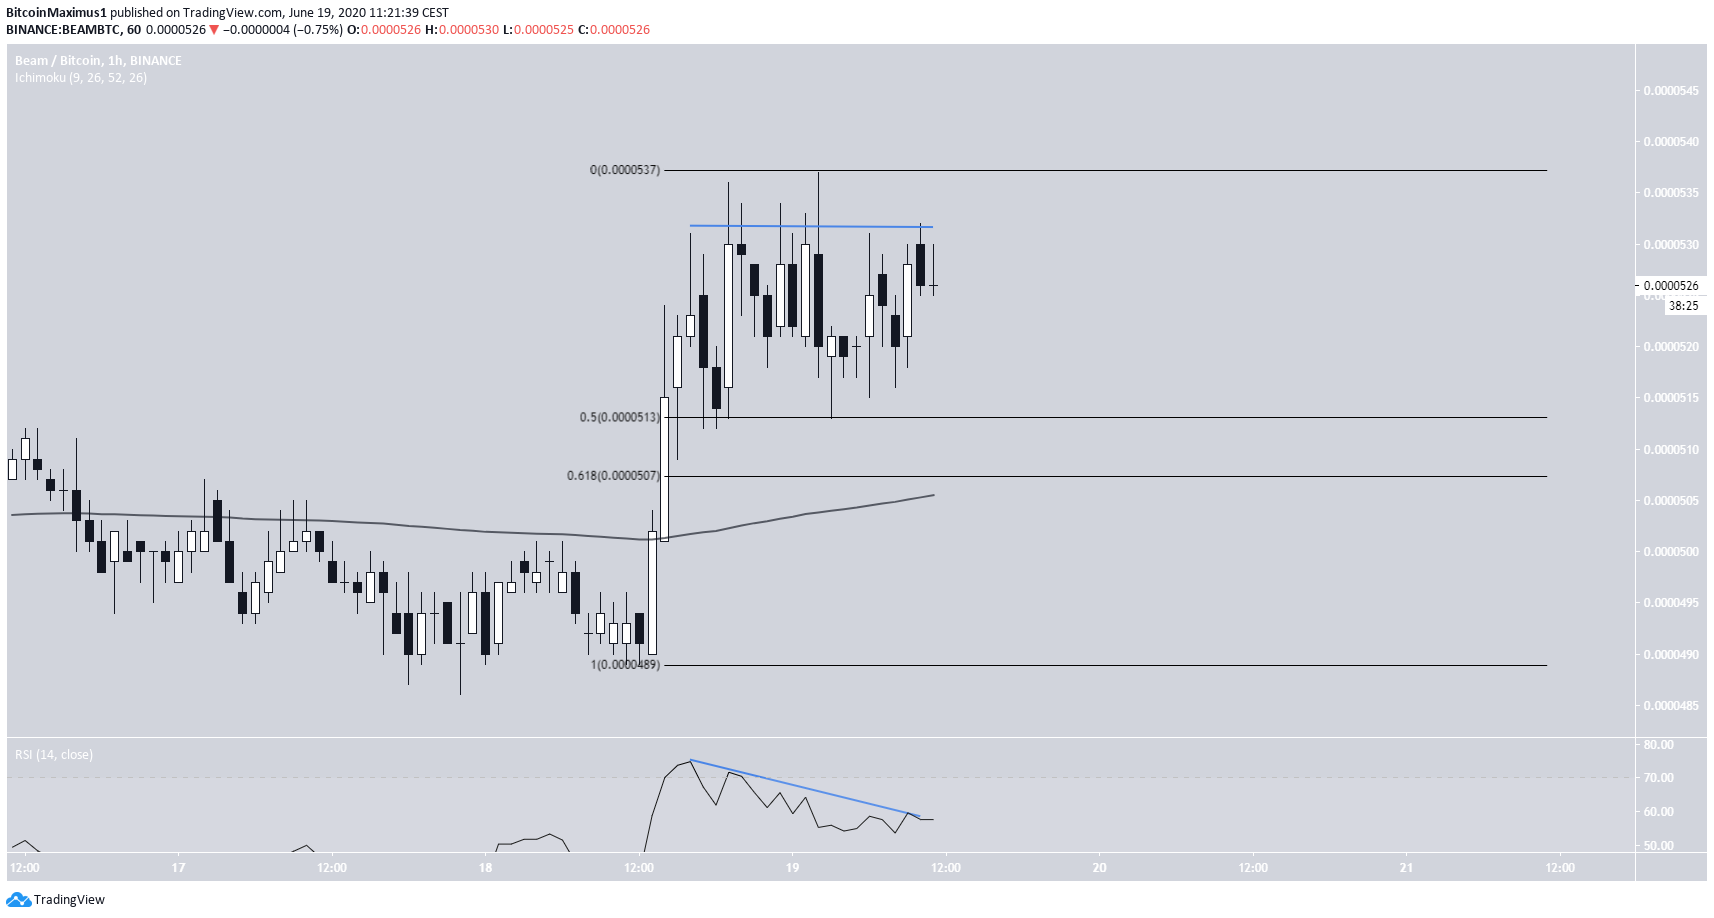
Cryptocurrency trader @KaiserCrypto explains that BEAM is at a ”nice spot for a scalp”. However, the short-term chart suggests that a decline might first occur. The price has formed a triple top as well as bearish divergence on the hourly RSI.
This suggests that the price is likely to retrace, possibly towards 507 satoshis, which is the 0.518 Fib level and the 200-hour MA.
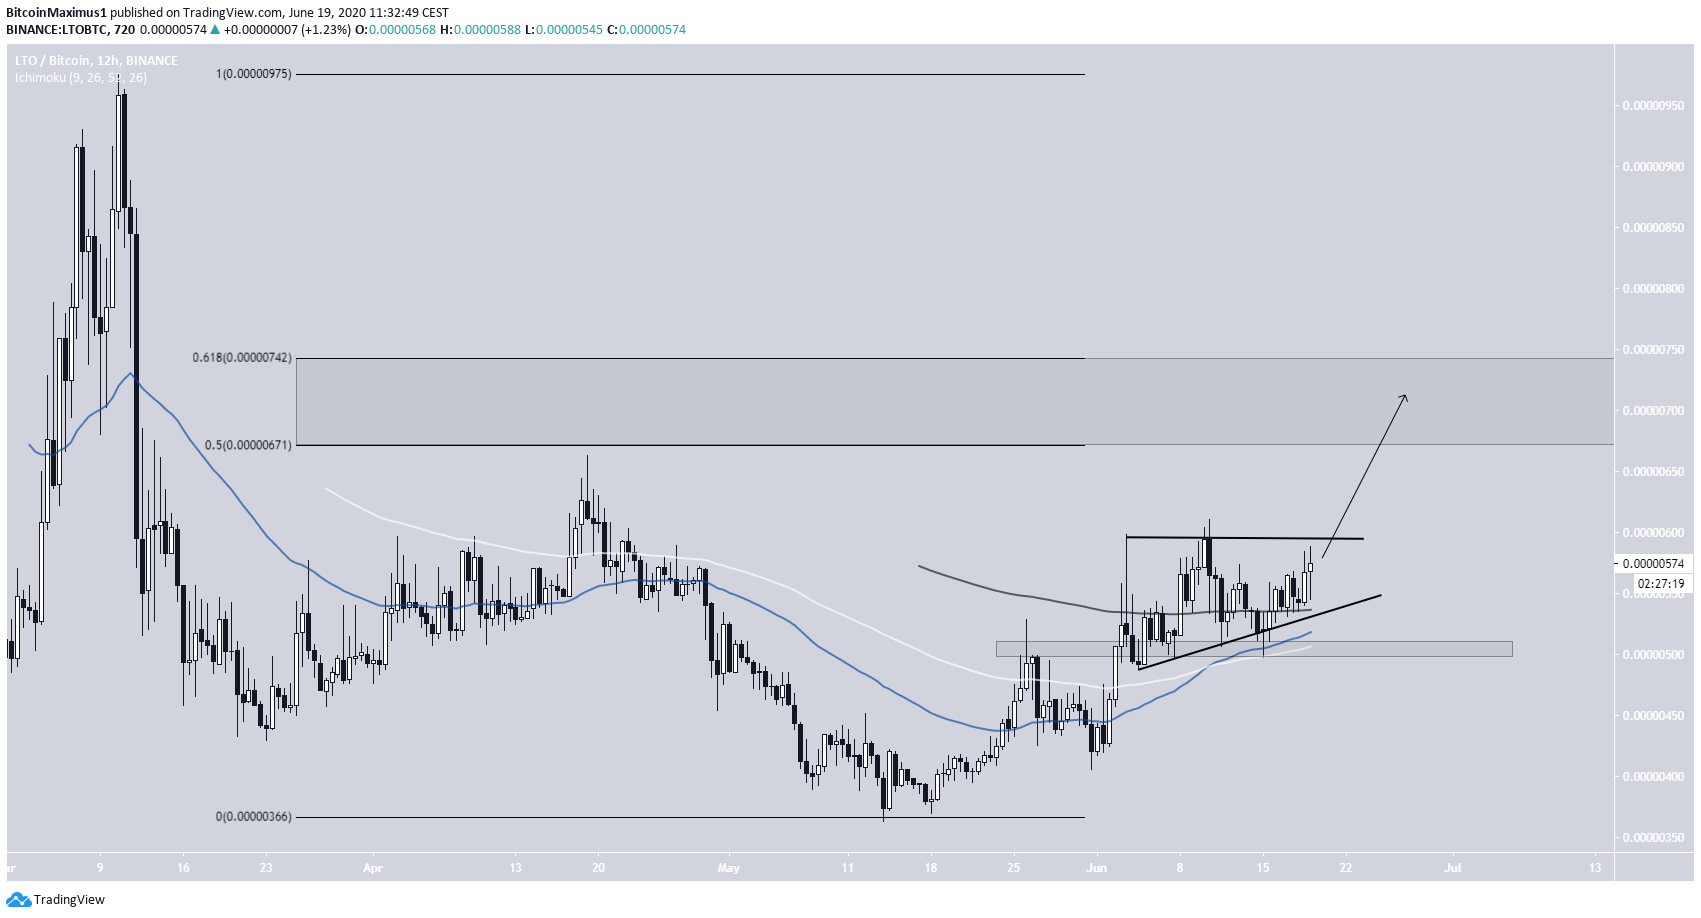
LTO Network (LTO)
The LTO price is also trading inside an ascending triangle that is taking place after an upward move. Furthermore, it has flipped the 500 satoshi level as support, along with the 50, 100, and 200-period MAs.
A breakout from this triangle could take the price to the 671 – 742 satoshi resistance area, which is the 0.5 – 0.618 Fib levels of the decline.
However, the resistance line of the pattern is not clear, allowing for the possibility that this is a symmetrical triangle, or even a head and shoulders pattern. If that’s the case, then there is less chance of an impending breakout.