
BLUR, the governance token of the Blur ecosystem, has seen some enticing price action since its launch.This airdrop distributed 360 million BLUR tokens, valued at approximately $355 million at the time. Since then, the prices have dipped. This BLUR price prediction covers the detailed technical and fundamental aspects of Blur, while tracking the token’s price potential up until 2035.
- Blur (BLUR) long-term price prediction until 2035
- Blur price prediction and the technical analysis
- Finding the key price points
- Blur (BLUR) price prediction 2024
- What is Blur’s prediction for 2025?
- Blur (BLUR) price prediction 2026
- Blur (BLUR) price prediction 2027
- Blur (BLUR) price prediction 2028
- Blur (BLUR) price prediction 2029
- Blur (BLUR) price prediction 2030
- Blur price prediction and the role of fundamentals
- On-chain metrics and the potential of Blur
- Is Blur a good investment?
- Frequently asked questions
Blur (BLUR) long-term price prediction until 2035
This table captures our anticipated price prediction levels for BLUR up to 2035.
| Year | Maximum Price of BLUR | Minimum Price of BLUR |
| 2024 | 0.76 | 0.40 |
| 2025 | 1.22 | 0.39 |
| 2026 | 1.19 | 0.63 |
| 2027 | 1.17 | 0.62 |
| 2028 | 1.93 | 0.61 |
| 2029 | 2.60 | 1.00 |
| 2030 | 3.30 | 1.35 |
| 2031 | 3.96 | 2.05 |
| 2032 | 4.75 | 2.47 |
| 2033 | 5.70 | 2.96 |
| 2034 | 6.84 | 3.55 |
| 2035 | 8.21 | 4.26 |
Blur price prediction and the technical analysis
We must first consider the charts when it comes to determining the short, mid, and long-term price of BLUR. Once the short-term price action is defined and the key levels identified, tracking the long-term positions becomes easier.
Short-term price action of BLUR
The daily price chart of BLUR reveals that a cup-pattern is in formation. If and when the price of BLUR breaches the $0.61 mark, we can expect a small correction, in order for the handle to form. This cup-and-handle formation might trigger the next leg up for BLUR.
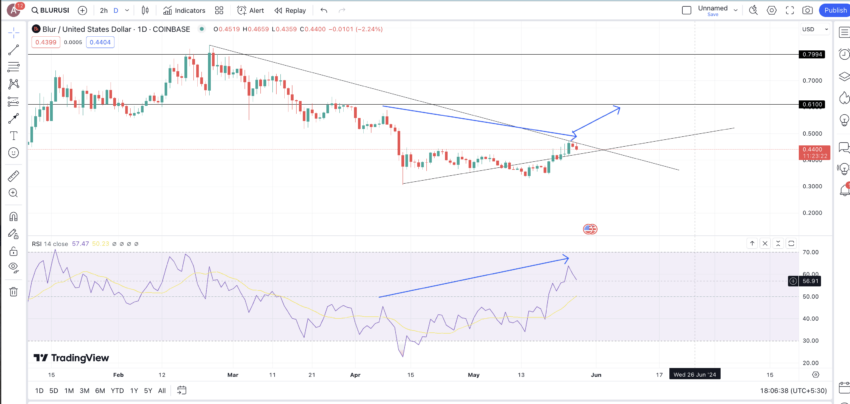
If the surge happens, the mid-term target for BLUR could be closer to 80 cents. However, right now, a pennant pattern is in motion, and a dip lower than the lower trend line can invalidate the bullish trend. If the breach happens above the upper trendline, we can continue to expect the cup-and-handle formation to hold.
A positive thing here is that the RSI is still making higher highs without heading into the overbought region. Also, there is a bullish divergence compared to the price action, which is good news for the price of BLUR.
Long-term analysis of BLUR
To project the long-term price of BLUR, we can zoom out the daily chart. The chart reveals an interesting formation. Notice how BLUR starts on a high and makes a series of lower highs before hitting rock bottom. From that starts a series of higher highs. The last high of the given swing is where the formation ends.
From there, another lower high formation starts. The next pathway or the price action of BLUR in 2024 will determine if the lower high formation is complete or if BLUR will see some weakening price momentum, hit a low, and finally peak.
We can now check the price and time changes between the points corresponding to the already completed formation. These formations will help us locate the average price hike and average price drop for BLUR’s next leg of the journey.
Did you know? Blur (BLUR) was co-founded by developers using the online monikers Pacman and Galaga, who were later revealed to be Tieshun Roquerre and Anthony Liu. Tieshun Roquerre, also known as Pacman, dropped out of MIT to create Blur after previously founding and selling Namebase, a crypto domain name company. This unique background in high-stakes tech and blockchain projects helped shape Blur into a cutting-edge NFT marketplace with advanced trading features and zero transaction fees.
Finding the key price points
The trick here is to find price and time-specific data corresponding to every two adjacent points associated with the A to A1 pattern and then the A1 to D1 pattern.
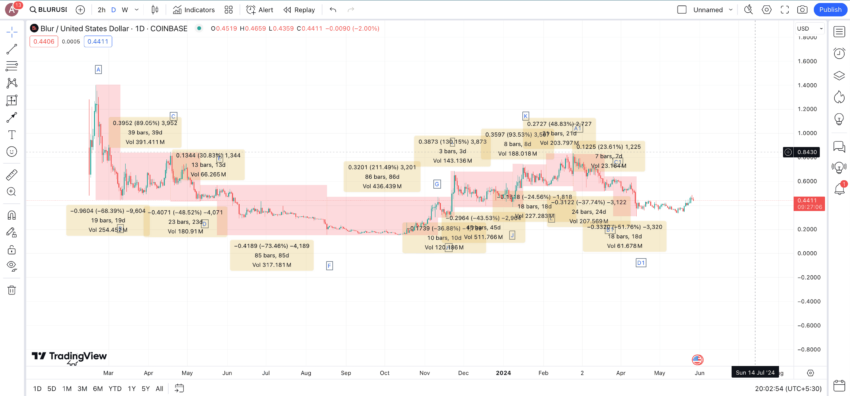
Note: There are other highs and lows in play but only the most obvious ones were considered for the sake of calculation.
Here are the values against which the results will be based:
| A to B | -68.39% in 19 days |
| B to C | 89.05% in 39 days |
| C to D | -48.52% in 23 days |
| D to E | 30.83% in 13 days |
| E to F | -73.46% in 85 days |
| F to G | 211.49% in 86 days |
| G to H | -36.88% in 10 days |
| H to I | 130.15% in 3 days |
| I to J | -43.53% in 45 days |
| J to K | 93.53% in 8 days |
| K to L | -24.56% in 18 days |
| L to A1 | 48.83% in 21 days |
| A1 to B1 | -37.74% in 24 days |
| B1 to C1 | 23.61% in 7 days |
| C1 to D1 | -51.76% in 18 days |
This data will be used to locate the average price surge and average price dip for the next set of highs and lows.
Average high: 89.64% in 25 days (approx)
Average dip: 48.11% in 30 days (approx)
Do note that the timeframe can vary.
Blur (BLUR) price prediction 2024
Outlook: Bullish
Now that the average price movement specific to BLUR is out of the way, it is time to chart the next point. Keeping the average price surge percentage as 89.64%, the next level should surface anywhere around the $0.594 mark. This level aligns with our short-term price prediction level of $0.61, post which the cup-pattern might fully form.
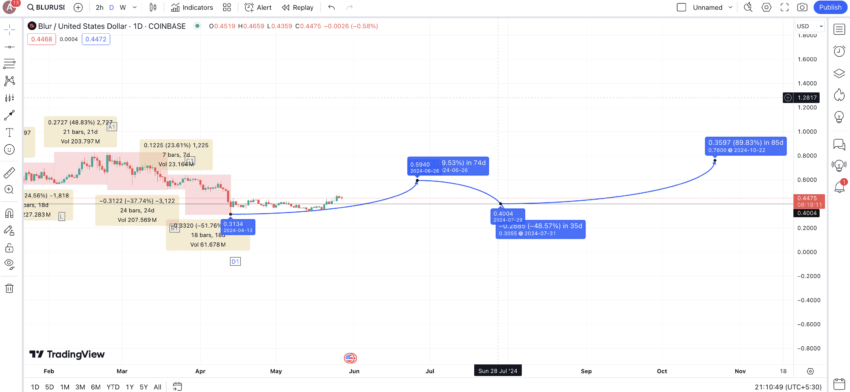
However, $0.59 might not be the highest point for BLUR in 2024. After this level, a low or dip to $0.40 might be on the cards. Even though the average price dip, per the table from earlier, is 48.11%, in a bullish crypto market, the price of BLUR might not drop this low and should take support at $0.40, which could also be the minimum coin price in 2024.
The next high, or the start of the higher high pattern for BLUR, could then surface at $0.76 by the end of 2024.
Projected ROI from the current level: 68.89%
Another price prediction:
What is Blur’s prediction for 2025?
Outlook: Very Bullish
Once the high for 2024 is out of the way, we expect the next low for BLUR to surface by early 2025, led by aggressive selling. Keeping the average price dip at 48.11%, the 2025 low for BLUR could surface at $0.3925.
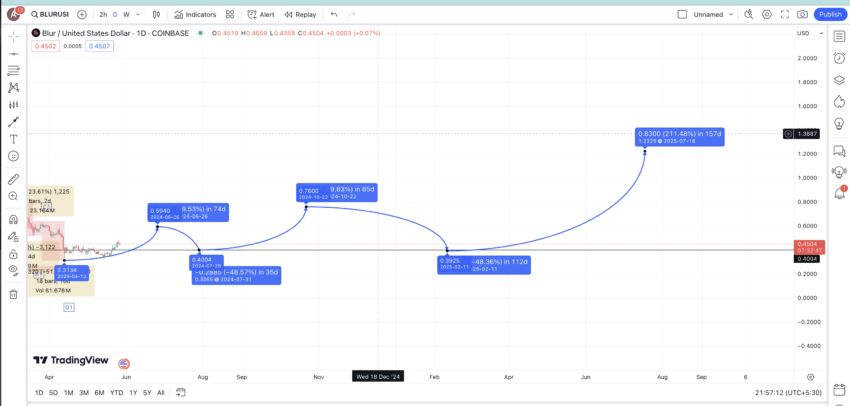
However, at this point, the bull market should be at its peak. Therefore, the average price surge percentage may be too small to accommodate the surge of BLUR. Here, we can assume the price of BLUR will grow by 211.49%, the highest price surge percentage per the earlier table. This would put the BLUR price prediction for 2025 at $1.22, closer to one of the all-time highs of $1.30, per the Coinbase chart.
Projected ROI from the current level: 171.11%
Blur (BLUR) price prediction 2026
Outlook: Bullish
By early 2026, expect the price of BLUR to correct considerably, considering sell-offs and other broader crypto market-specific conditions. Per the average dip percentage of 48.11%, the next low might form at $0.634.
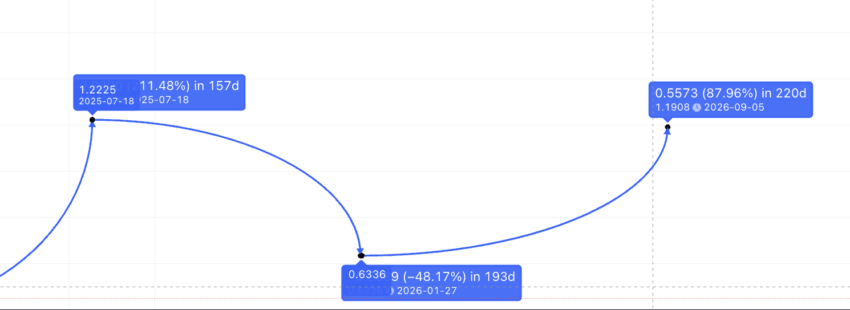
From this level, the next high could start the formation of the lower-high phase for BLUR. In crypto or any other asset-related market, history repeats itself. Therefore, from the 2026 low of $0.6336, the next high could follow the average price hike of 89.64%, which could take it all the way up to $1.19.
Projected ROI from the current level: 164.44%
Blur (BLUR) price prediction 2027
Outlook: Bullish
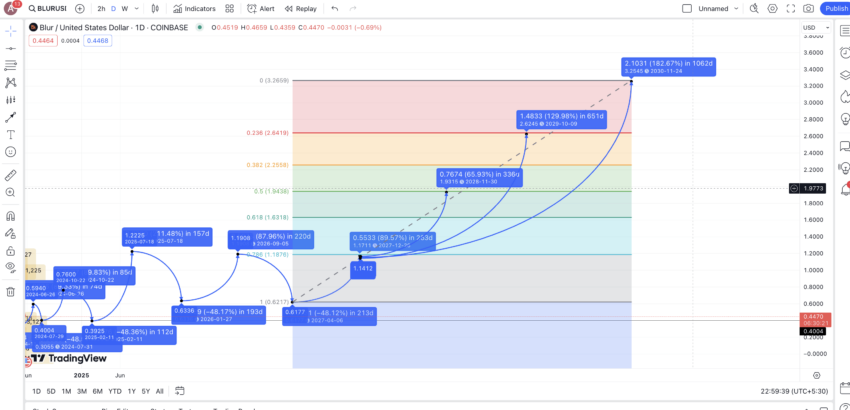
In 2027, at least in the early part of the year, expect the price of BLUR to dip by at least 48.11% — the average correction per Table 2. This puts the BLUR price prediction low for 2027 at $0.62. From here, a surge of 89.64% can put the next high or the 2027 high at $1.17.
Projected ROI from the current level: 160%
Blur (BLUR) price prediction 2028
Outlook: Very Bullish
Now that the 2027 high and low values are all set, we can extrapolate this data to locate the price levels up to 2030. Based on the extrapolation done using the Fibonacci retracement indicator, the highest price of BLUR in 2028 could surface at $1.93.
Projected ROI from the current level: 328.89%
Blur (BLUR) price prediction 2029
Outlook: Very Bullish
Based on the Fib-based extrapolation until the year 2030, the highest possible price of BLUR in 2029 could settle at $2.60.
Projected ROI from the current level: 477.78%
Blur (BLUR) price prediction 2030
Outlook: Very Bullish
By the end of 2030, the maximum price of BLUR could reach $3.30, per the Fib retracement indicator. However, this will only be possible if Blur manages to grow its market cap, network adoption rate, and improve upon its fundamental elements.
Projected ROI from the current level: 633.33%
Blur price prediction and the role of fundamentals
It makes sense to check the technical analysis and the available price points in relation to the fundamental elements. Here is everything you need to know about the fundamentals of Blur (BLUR).
Platform features
- Real-time price feeds: Blur offers advanced features like real-time price feeds and portfolio management, which cater to professional NFT traders.
- Zero trading fees: The platform charges no trading fees for NFT sales, making it attractive for high-volume traders.
- Multi-marketplace comparisons: Blur provides multi-marketplace NFT comparisons, further enhancing its appeal to traders.
Tokenomics
- Total supply: Blur has a total supply of 3 billion BLUR tokens, with 360 million currently in circulation.
- Airdrops and distribution: The token distribution includes community incentives, with 51% allocated to community members through airdrops and other incentives, 29% to contributors and developers, 19% to investors, and 1% to advisors
- Governance: BLUR tokens are used for governance through a decentralized autonomous organization (DAO), allowing holders to vote on platform proposals.
Here’s some insight into the size of the Blur airdrop:
Market performance
- Initial surge: The price surged to over $5 following the February 2023 airdrop but corrected shortly after due to mass selling.
- Recent trends: Despite volatility, BLUR has shown substantial gains, with notable increases in trading volumes and interest from large traders and whales.
- Binance listing: A listing on Binance in November 2023 resulted in a 20% price surge, reflecting strong market confidence.
Partnerships and potential
- Funding: Blur has received backing from prominent investors like Paradigm, which has helped it grow and attract top talent.
- Advisory and growth: The involvement of well-known figures in the crypto community, such as Zeneca, has further boosted its credibility and market reach.
- Innovations: Blur continues to innovate with features like Blend, a perpetual lending protocol using NFTs as collateral. This integration of DeFi elements adds significant value and utility to the platform.
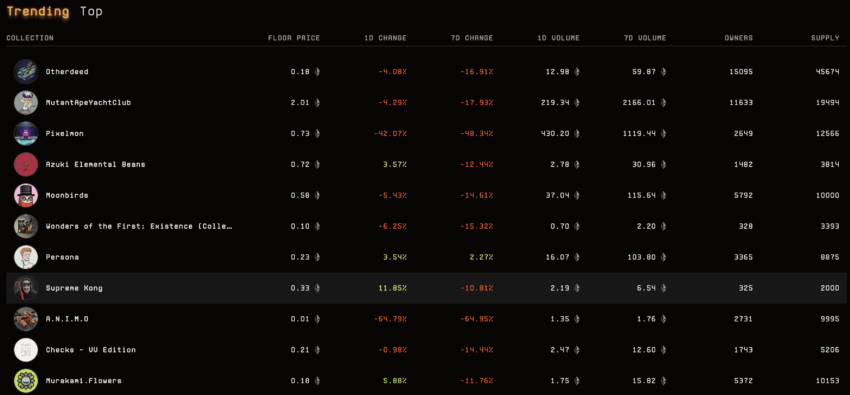
- User base: Blur’s focus on professional traders and high-volume transactions has helped it capture a substantial market share, overtaking competitors like OpenSea in trading volume.
While Blur (BLUR) has experienced significant price fluctuations, its strong fundamentals, innovative platform features, and strategic partnerships suggest a promising future. Investors should closely monitor ongoing developments and market trends to make informed decisions about the token’s potential.
On-chain metrics and the potential of Blur
If you want to understand the price action better, here are some of the key on-chain metrics associated with Blur that can help. Here is the first snapshot taken from CoinMarketCap’s coin page:
Here is what it means to a standard trader/investor:
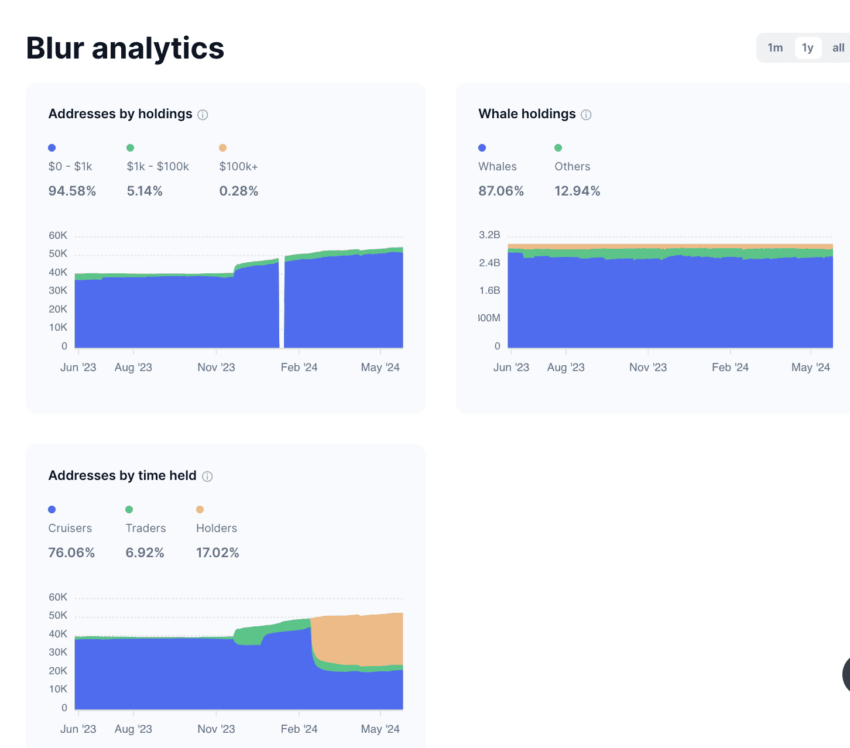
Addresses by holdings
- Distribution: The majority of BLUR addresses hold between $0 to $1k worth of tokens (94.58%), with 5.14% holding $1k to $100k and only 0.28% holding over $100k.
- Implications: This distribution indicates that most BLUR holders are small investors. A broad base of small investors can suggest a strong community, but it also means the price of Blur can be volatile if these holders decide to sell off en masse.
Whale holdings
- Concentration: Whales (large holders) account for 87.06% of the total BLUR holdings, with the remaining 12.94% held by others.
- Implications: The high concentration of holdings among whales suggests that a few large investors can significantly influence the price of Blur. While this can provide stability if these whales hold, it also poses a risk of price manipulation or large dumps that can lead to sharp corrections.
Addresses by time held
- Holding period:
- Cruisers (holding for a medium-term): 76.06%
- Traders (short-term): 6.92%
- Holders (long-term): 17.02%
- Implications: The significant percentage of cruisers indicates a belief in Blur’s mid-term potential. However, the presence of a notable proportion of short-term traders suggests that price volatility could be influenced by speculative activities. Long-term holders provide a foundation of stability, indicating confidence in Blur’s future prospects.
Impact on price and potential corrections
- Community support: Many small investors and cruisers suggest robust community support, which is crucial for the token’s longevity and organic growth in the crypto market.
- Whale stability: If the whales holding a significant portion of BLUR maintain their positions, it can lend price stability and reduce the risk of massive sell-offs, contributing positively to the coin price.
Risks and potential corrections
- Whale dominance: Whales’ high concentration of holdings could lead to price manipulation. If whales decide to sell large portions of their holdings, it could lead to significant price drops, affecting the average price.
- Speculative trading: The presence of traders who hold for the short term can lead to increased price volatility, especially during market corrections or negative news.
Price volatility and active addresses analysis
The price volatility chart can help us make better sense of the price action:
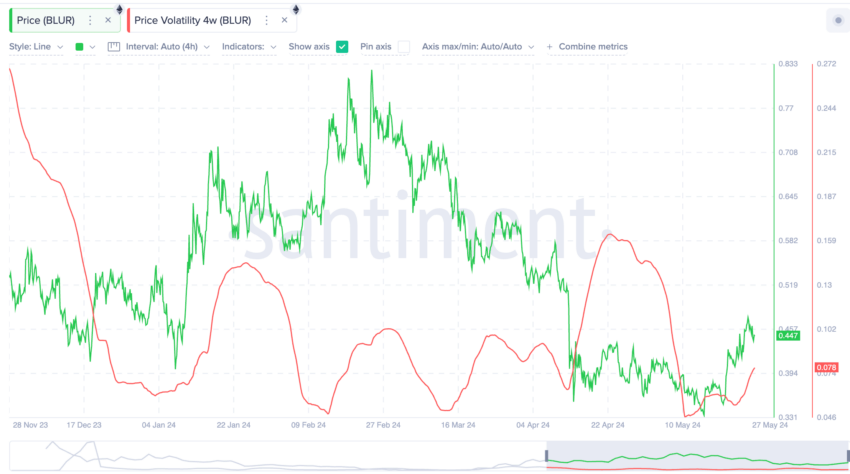
- Price movement: The price of Blur has experienced significant fluctuations from late November 2023 to late May 2024, with notable peaks and troughs.
- Volatility: The red line representing price volatility shows high volatility periods coinciding with major price movements. For instance, the volatility peaks align with sharp price increases in January 2024 and subsequent declines in February 2024.
Implications:
- High volatility periods: High volatility often indicates periods of significant trading activity and speculation, which can lead to both rapid price increases and sharp corrections.
- Investor behavior: During high volatility, traders and long-term investors might take profits or cut losses, contributing to the observed price swings, which impact the average price and the minimum price.
Active addresses and price correlation
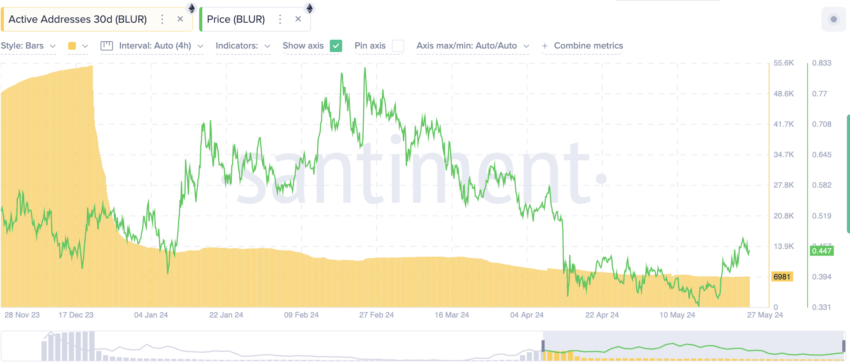
- Active addresses: The yellow bars represent the number of active addresses. There is a noticeable decline in active addresses from late November 2023 to late April 2024, followed by a slight increase in May 2024.
- Price trends: The green line shows the price of Blur. There is a general correlation where periods of higher active addresses correspond to higher prices and vice versa.
Implications:
- Active participation: More active addresses generally indicate increased network activity and user engagement, which can positively impact the token’s coin price.
- Declining activity: The decline in active addresses earlier in the year could have contributed to the price drop observed during the same period. The recent uptick in active addresses suggests renewed interest and could support price recovery, impacting the overall market cap.
The on-chain metrics of BLUR highlight a mixed landscape:
- Strengths: Strong community support, significant mid-term holding, and potential stability provided by whale holdings are all positive indicators for the blur coin price prediction.
- Weaknesses: A high concentration of whale holdings poses risks, and the presence of short-term traders could lead to price volatility. These factors are crucial in making technical analysis for the token.
Is Blur a good investment?
Blur (BLUR) offers a promising investment opportunity backed by strong fundamental elements such as innovative platform features, zero transaction fees, and strategic partnerships. The Blur price prediction indicates potential for significant gains, especially given its robust community support and substantial backing from prominent investors.
However, the high concentration of whale holdings and the presence of speculative trading activity introduce price volatility and manipulation risks. If you’re comfortable with these risks, BLUR could be a valuable addition to your portfolio, offering substantial long-term growth potential based on thorough technical analysis and historical performance. Always conduct your own research and consider both market cap trends and average price movements to make well-informed investment decisions.
Frequently asked questions
Is Blur Coin a good investment?
What is the all-time high for Blur coin?
What is the use of the Blur coin?
Is Blur a meme coin?
Disclaimer
In line with the Trust Project guidelines, the educational content on this website is offered in good faith and for general information purposes only. BeInCrypto prioritizes providing high-quality information, taking the time to research and create informative content for readers. While partners may reward the company with commissions for placements in articles, these commissions do not influence the unbiased, honest, and helpful content creation process. Any action taken by the reader based on this information is strictly at their own risk. Please note that our Terms and Conditions, Privacy Policy, and Disclaimers have been updated.


