
Ever seen Bitcoin move so fast it feels like a fever dream? That’s the Bitcoin Banana Zone, the most explosive phase of the crypto market cycle. Bitcoin’s price skyrockets, altcoins go wild, and hype reaches maximum levels. But is this just FOMO-fueled madness, or is there a real pattern behind it? Today, we break down the Bitcoin Banana Chart, explain the Banana Zone, why it happens, and how to trade it like a professional.
KEY TAKEAWAYS
➤ The Bitcoin Banana Zone is a repeatable parabolic market cycle.
➤ There are three key phases to know about; the breakout phase, the Banana Zone, and market cooling.
➤ Pullbacks in 2025 suggest Bitcoin isn’t at its peak yet.
➤ Tracking key indicators can help you navigate the bull run effectively.
- What is the Bitcoin Banana Zone?
- What is the Bitcoin Banana chart?
- What is the Banana Zone theory?
- How to read the Bitcoin Banana chart?
- The Banana Zone psychology
- How to track and use the Bitcoin Banana Zone?
- How to trade Bitcoin using the Banana Zone theory?
- Common mistakes traders make in the Bitcoin Banana Zone
- Bitcoin Banana Zone predictions for 2025 and beyond
- Can the Bitcoin Banana zone predict an altseason?
- Is the Bitcoin Banana Zone a reliable market indicator?
- Frequently asked questions
What is the Bitcoin Banana Zone?
The Bitcoin Banana Zone is the parabolic phase of a Bitcoin bull run, where prices rise so fast and aggressively that the chart curves upward like a banana.
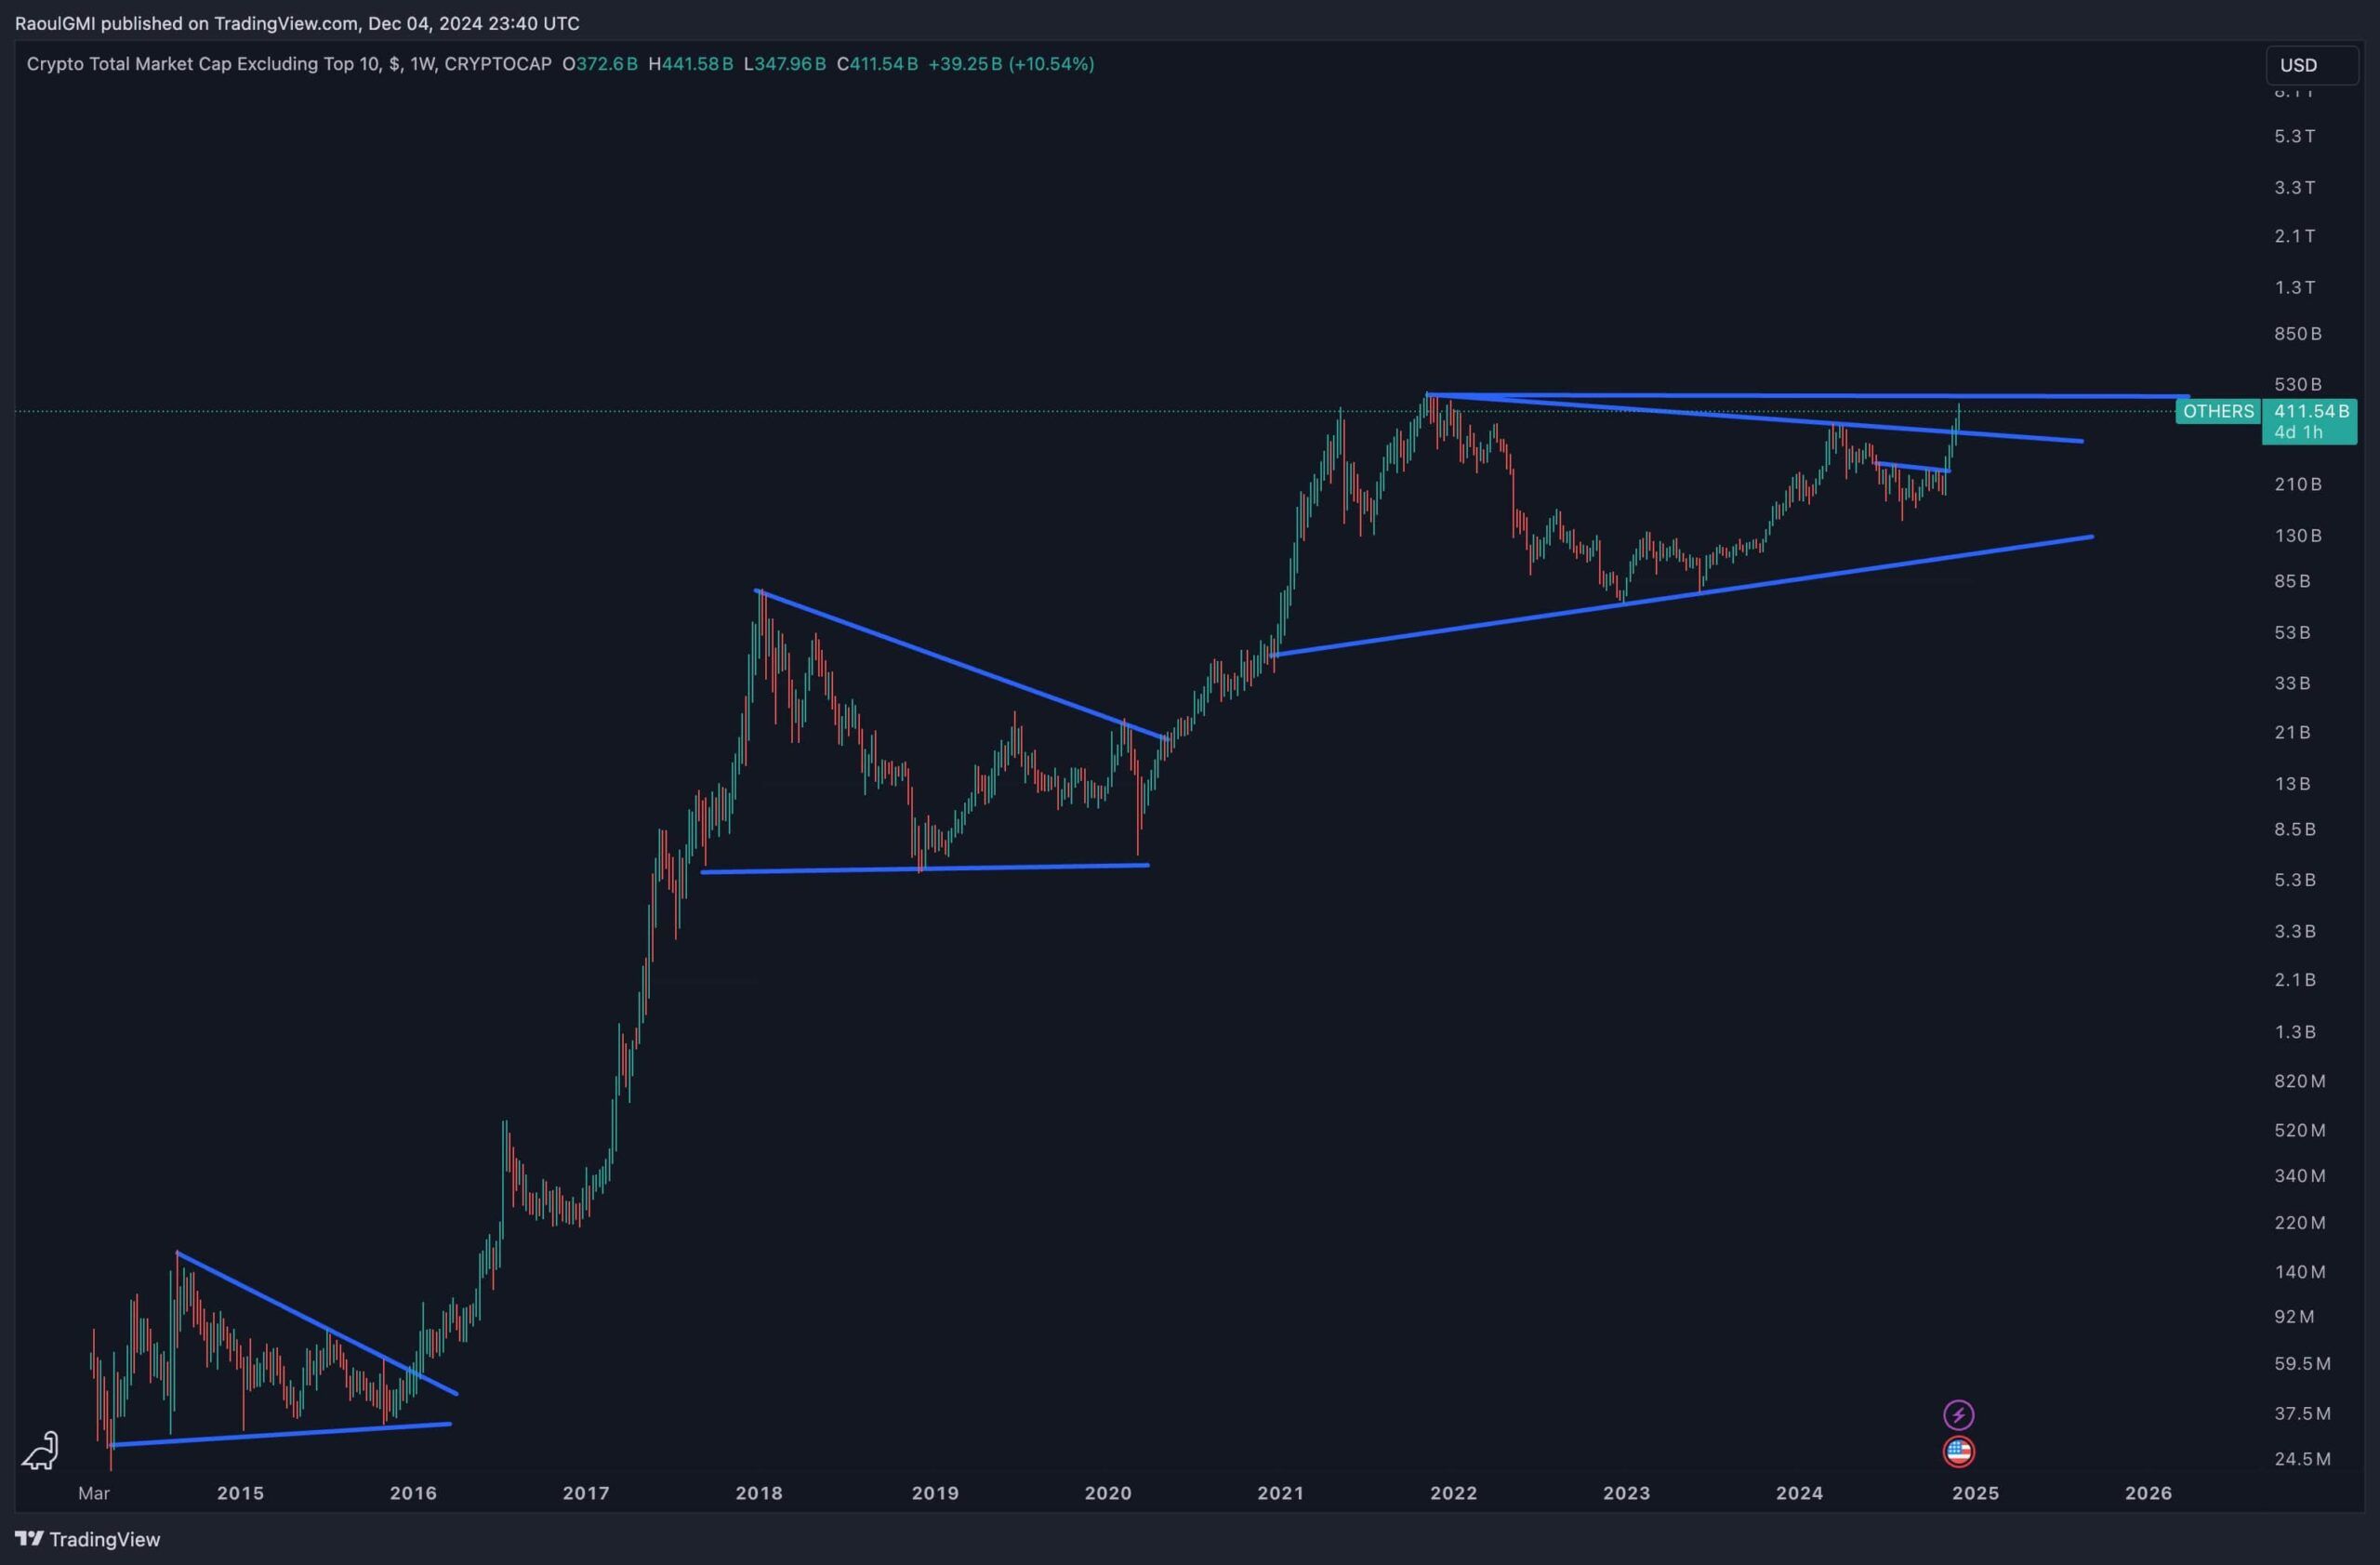
First coined by macro investor Raoul Pal, it describes the most explosive part of the crypto market cycle, fueled by FOMO, liquidity, and institutional buying. This is the phase where most retail investors flood in, altcoins surge, and Bitcoin’s price action becomes extreme.
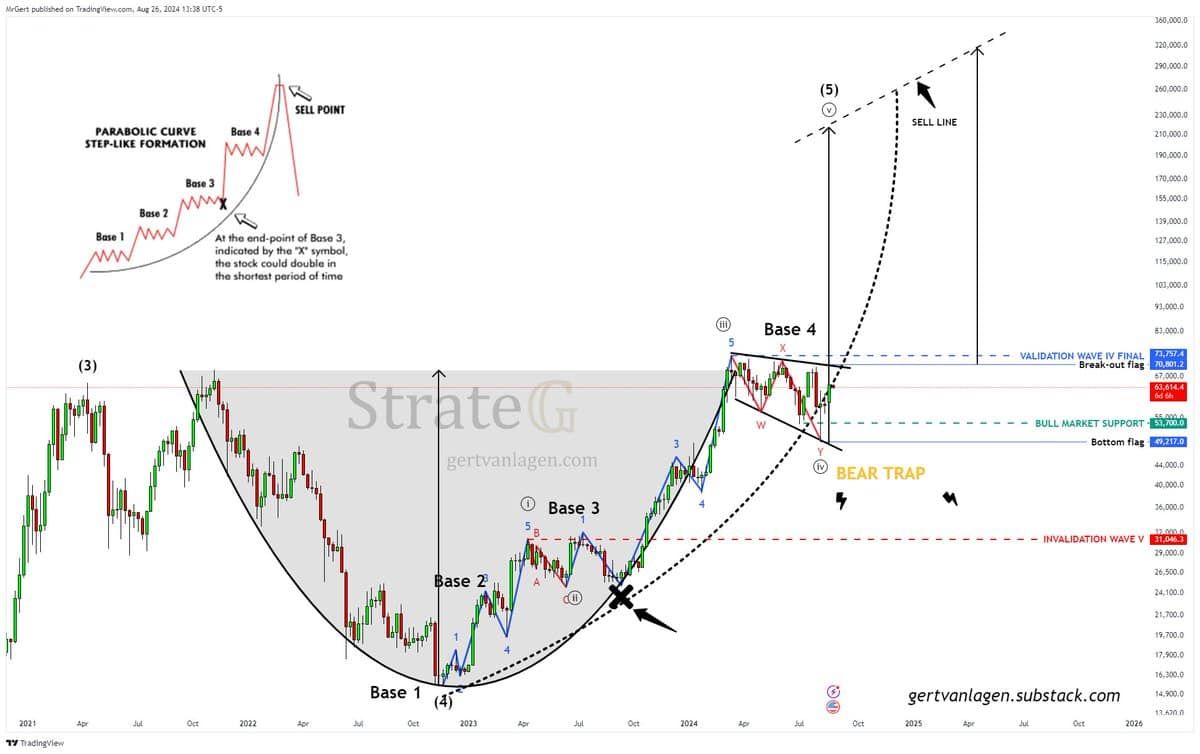
If you’ve ever looked at a Bitcoin price chart during these times, you’ll notice that the price doesn’t just rise steadily; it bends sharply upward, forming a banana-like curve. This is what traders call the Bitcoin Banana Chart.
What is the Bitcoin Banana chart?
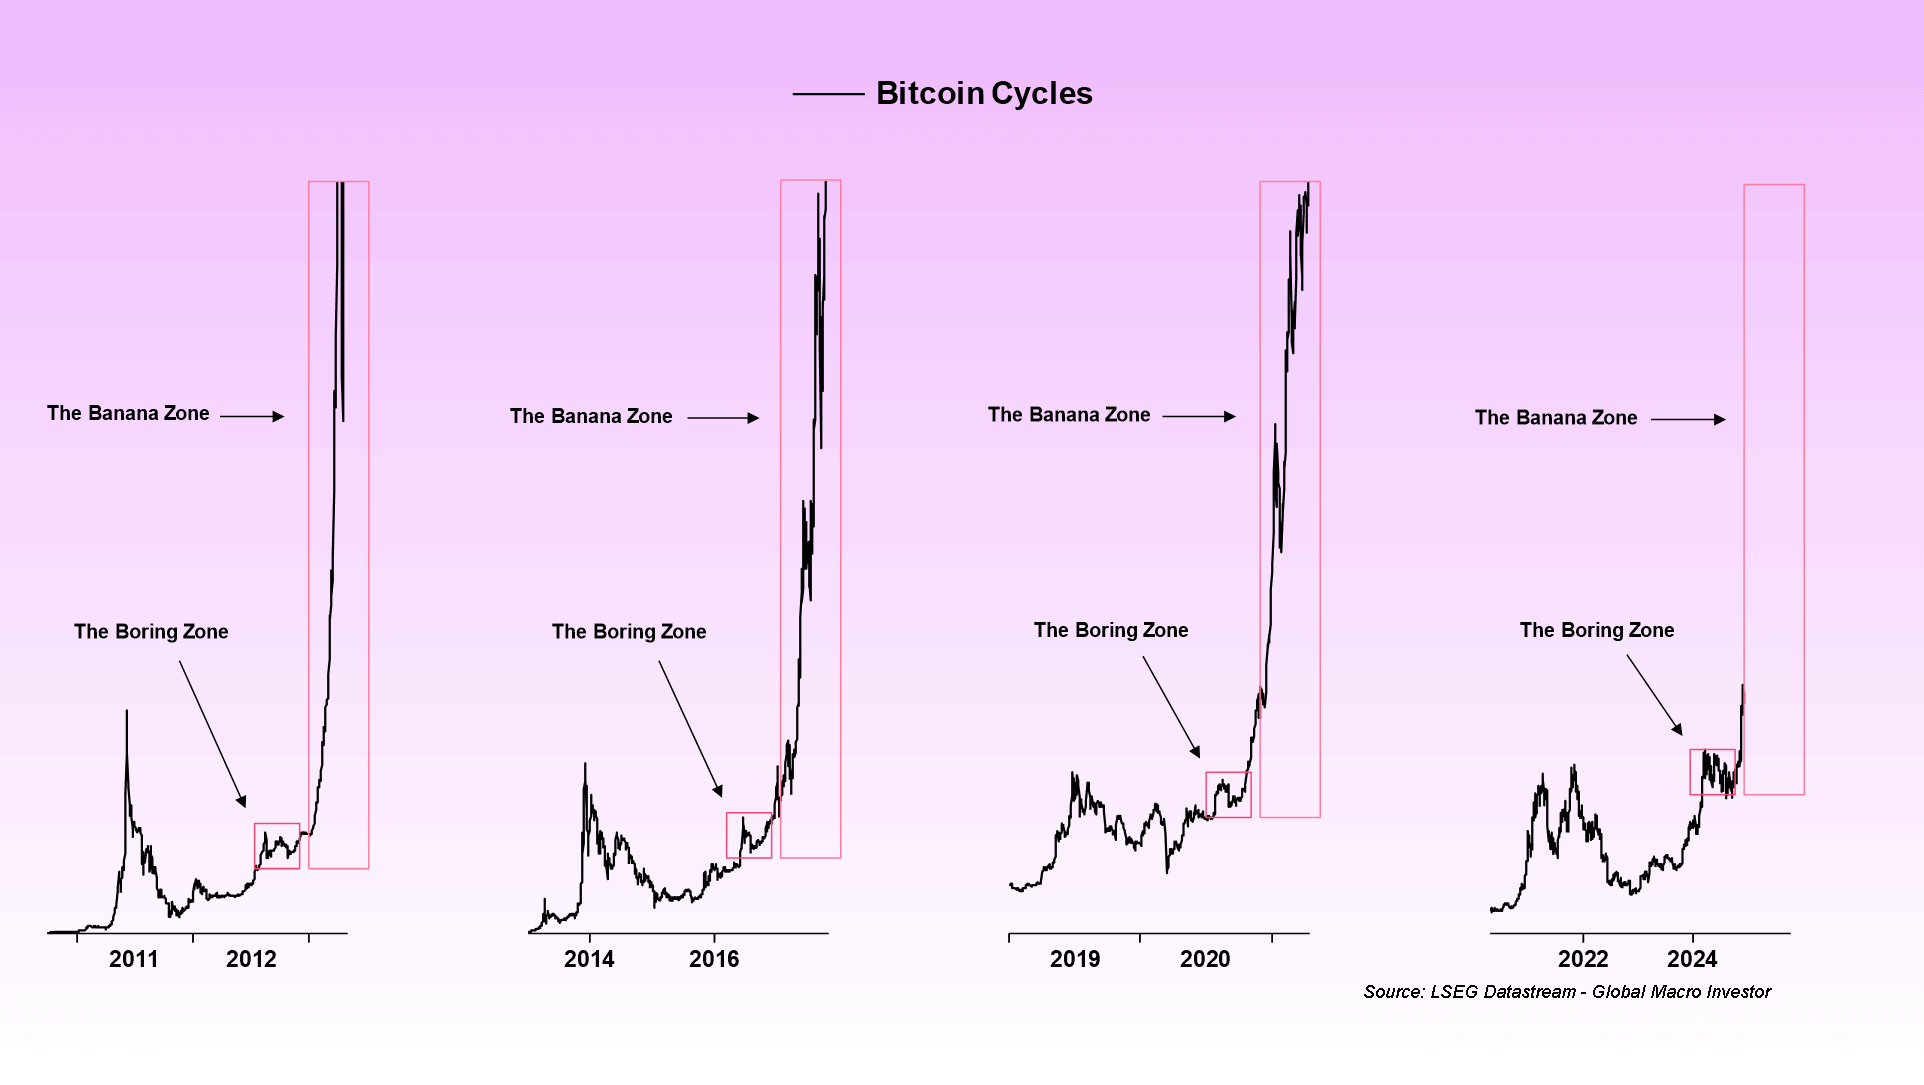
The Bitcoin Banana Chart isn’t an indicator — it’s a visual representation of how Bitcoin moves during the late stages of a bull run.
This pattern has played out in multiple bull cycles:
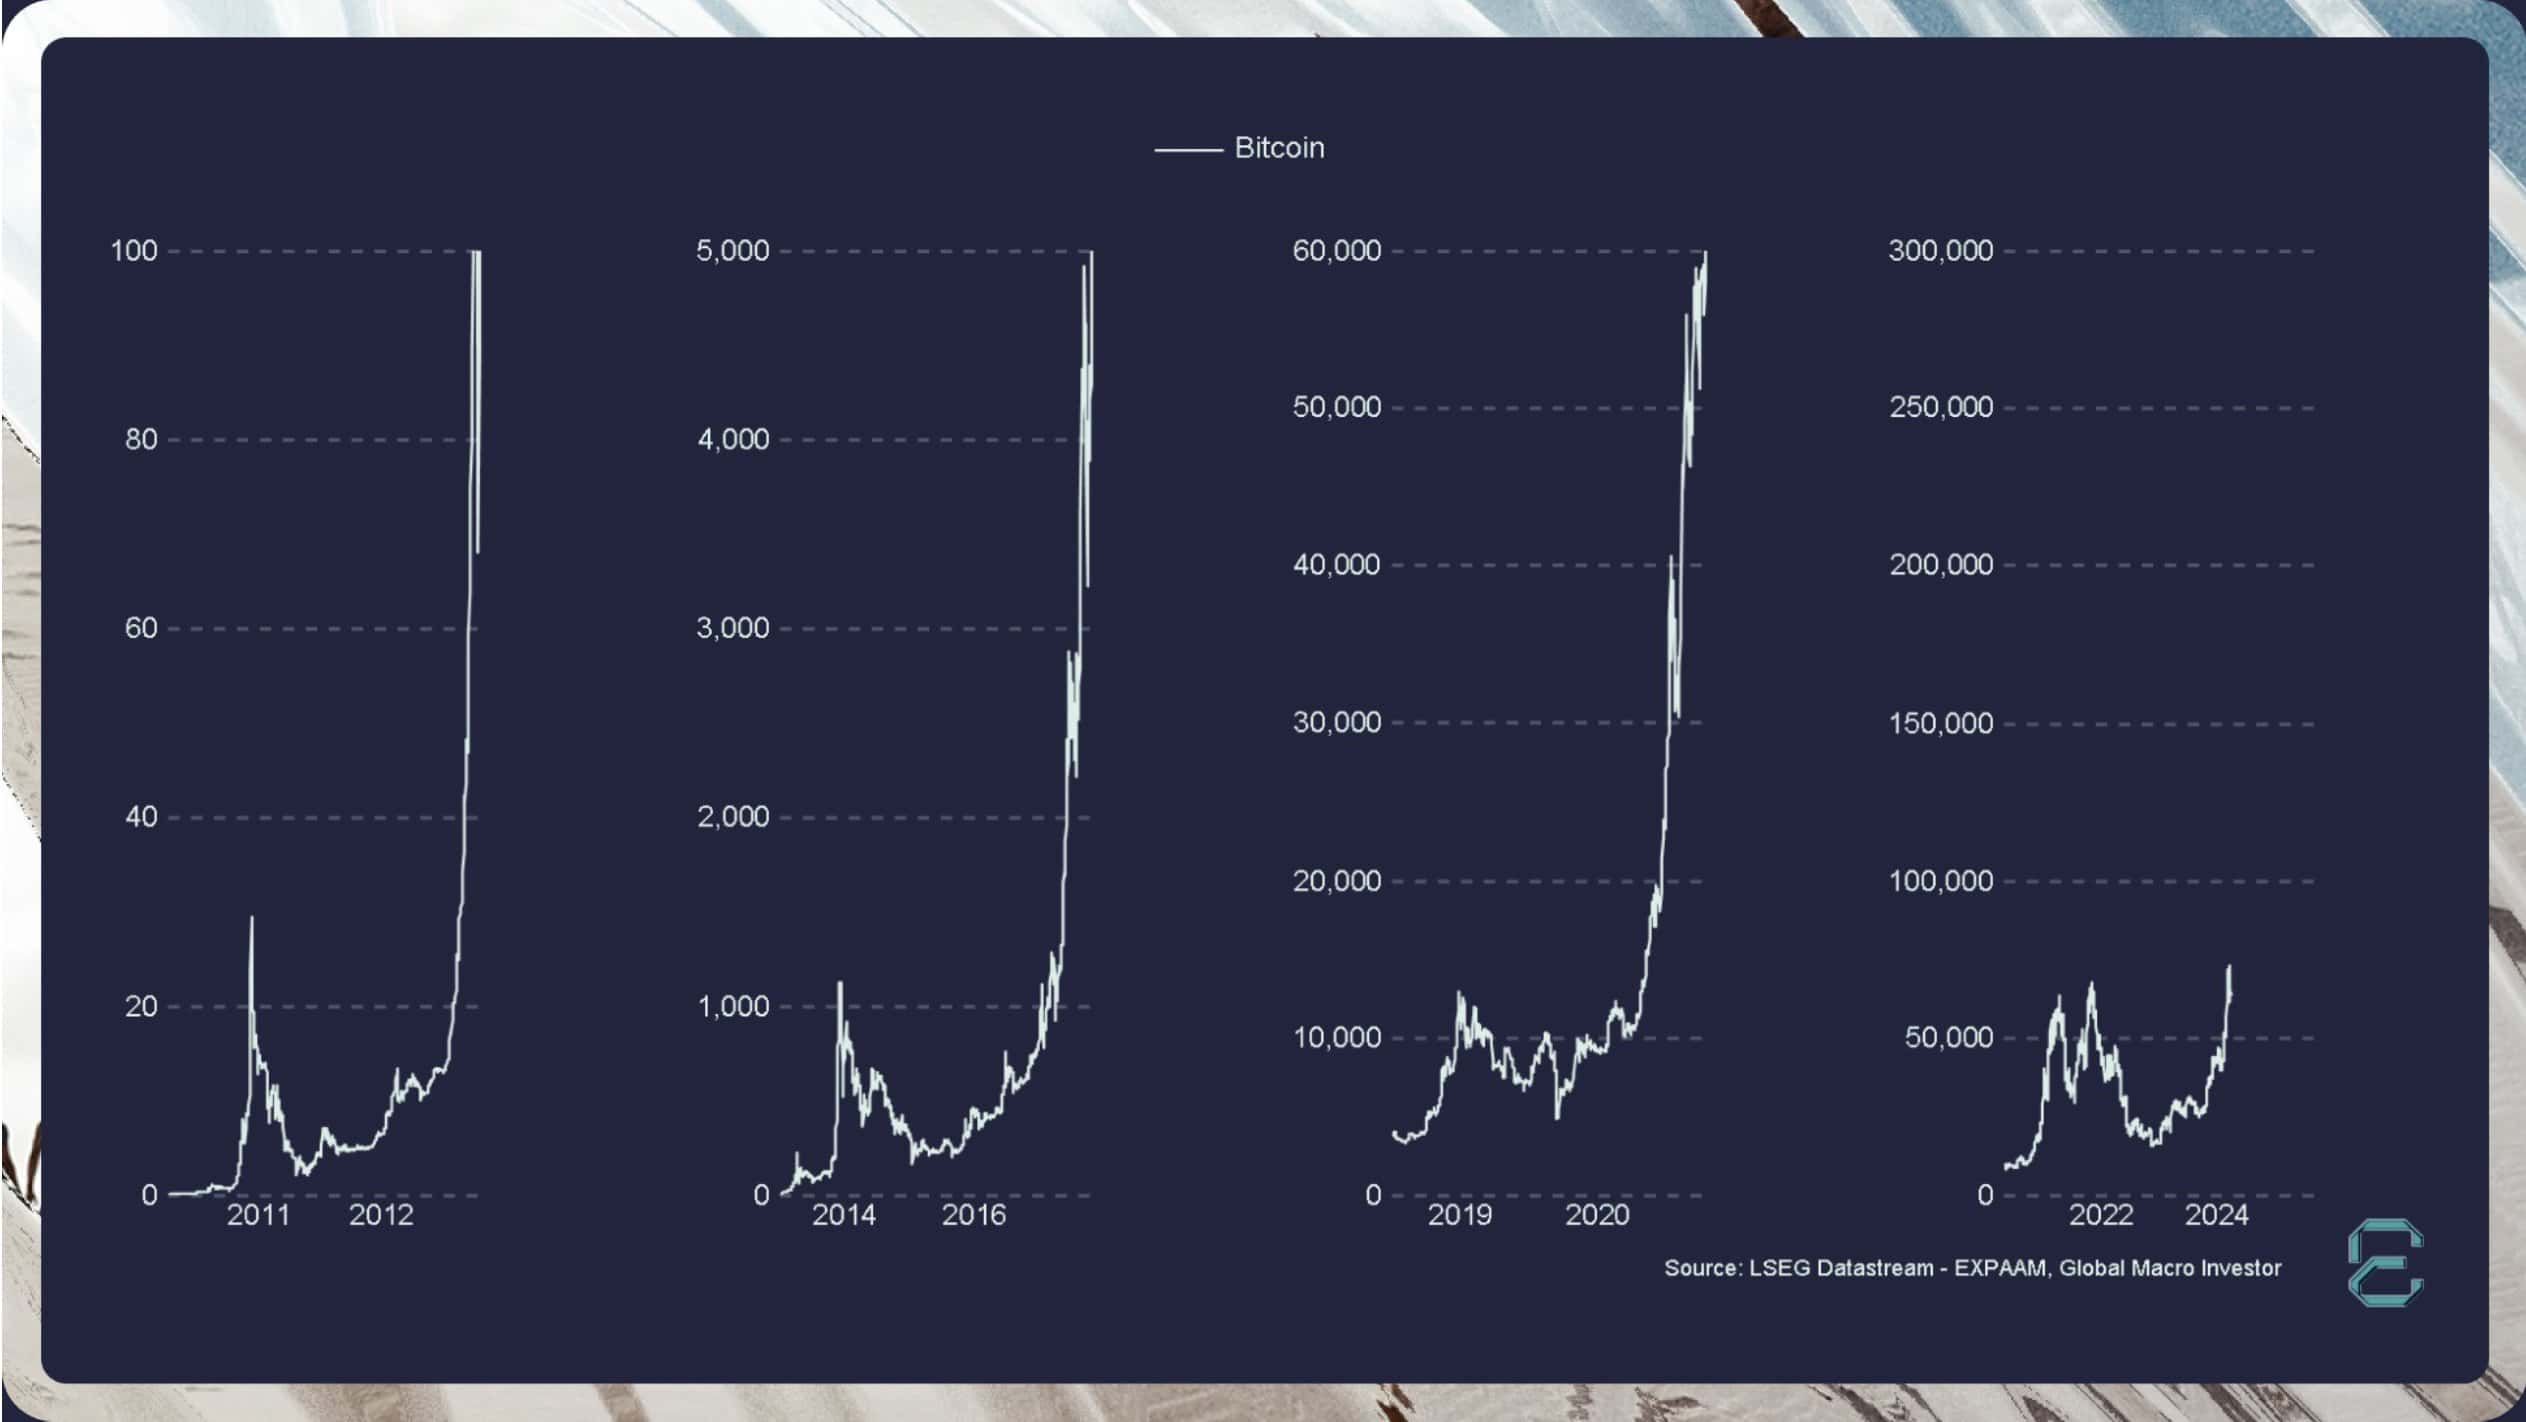
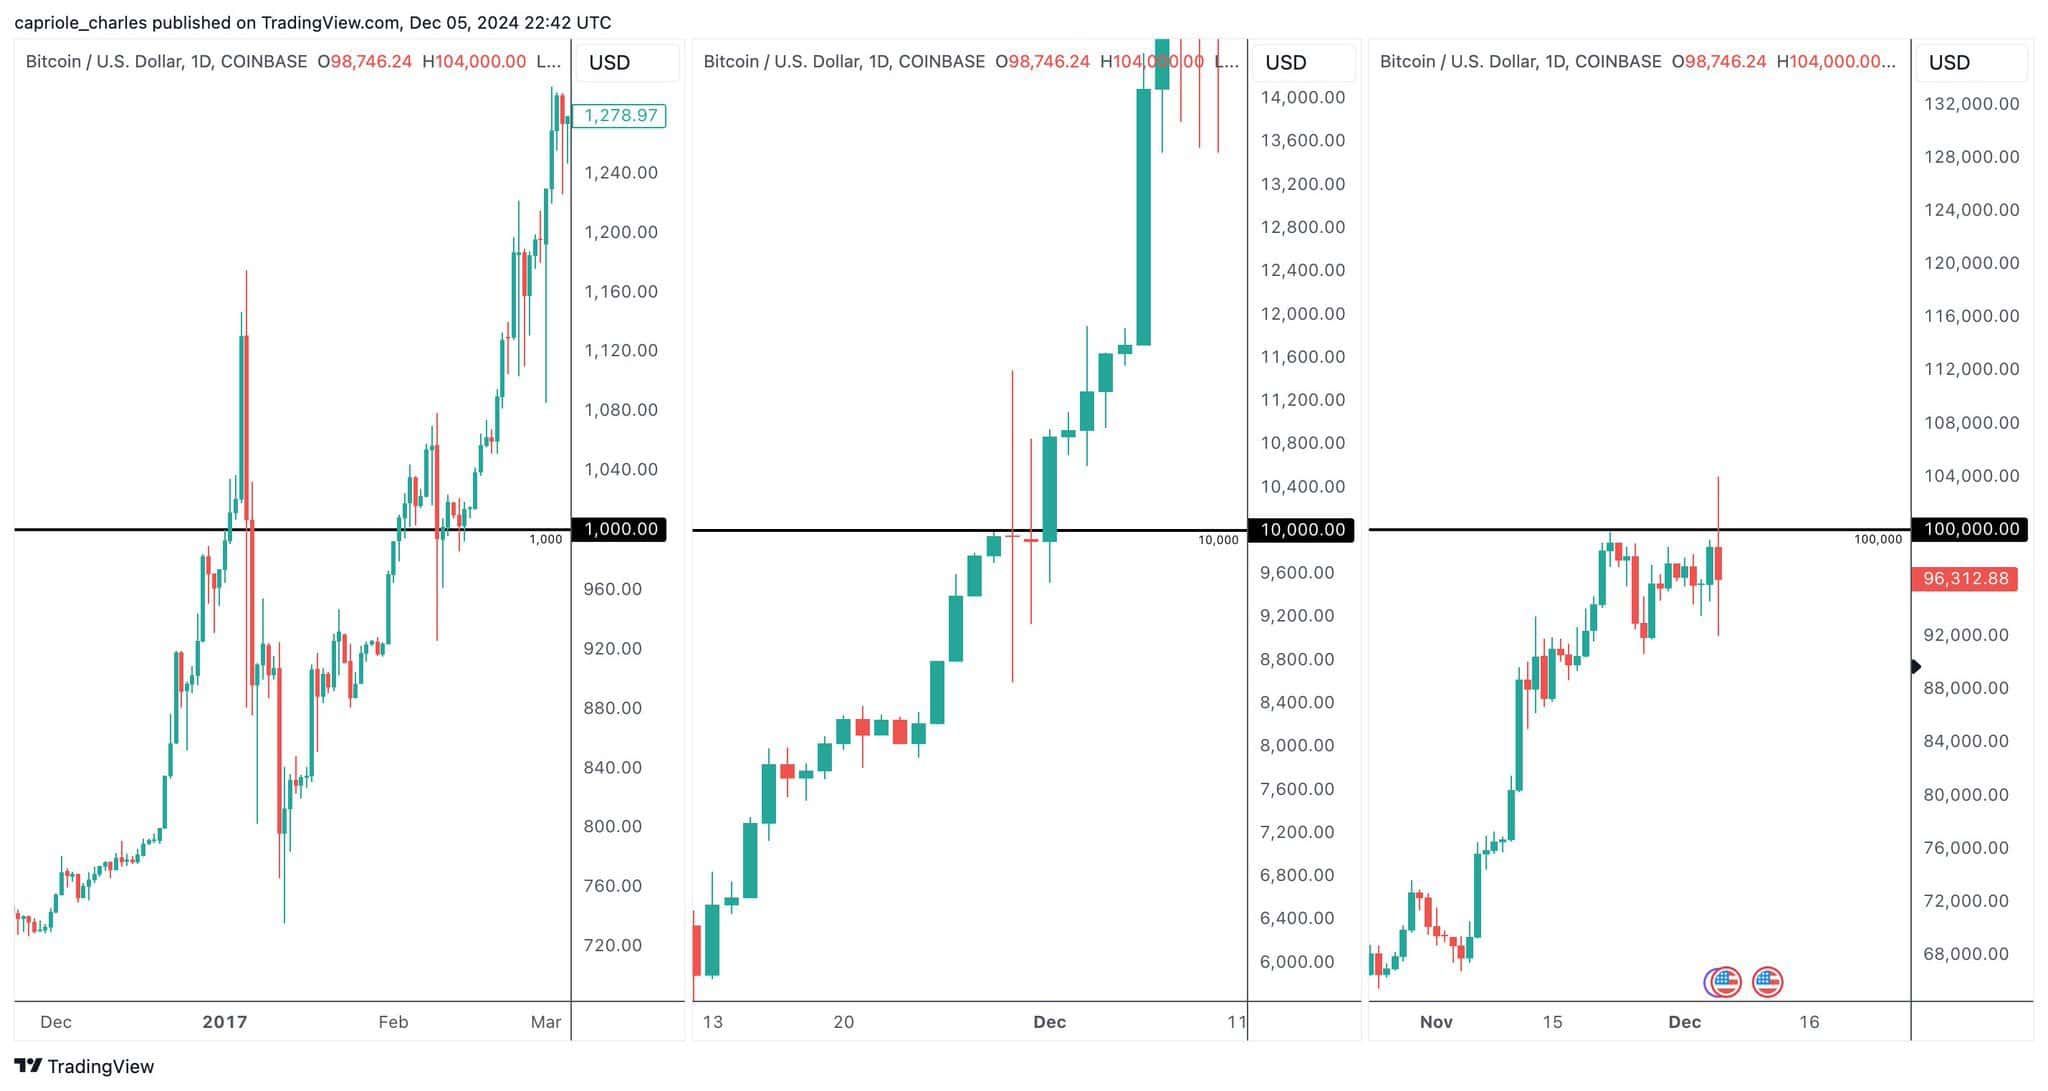
- 2013: Bitcoin jumped from $100 to $1,000 in just weeks.
- 2017: A surge from $5,000 to $20,000 in months.
- 2021: Bitcoin tripled from $20K to $69K, then crashed.
But what causes this Banana Zone to form every cycle? This is where the Banana Zone Theory comes in.
What is the Banana Zone theory?
The Banana Zone Theory suggests that Bitcoin follows a repeatable boom-and-bust cycle, where price action shifts through three distinct phases:
Breakout phase: Bitcoin starts climbing steadily, but most traders remain skeptical.
Banana Zone (Parabolic phase): Sudden, explosive growth fueled by FOMO, leverage, and institutional buying.
Market cooling: Whales take profits, retail gets trapped, and prices stabilize or crash.
But why does this pattern repeat? According to Raoul Pal, it all comes down to market structure and human psychology.
More about Raoul Pal’s theory
Raoul Pal, a former hedge fund manager, noticed that Bitcoin’s biggest bull runs follow a predictable pattern: slow accumulation, sudden breakout, and then a full-on parabolic rise. This isn’t just random hype; it’s a combination of:
- Supply shock (More buyers, fewer sellers = price explosion)
- Institutional accumulation (Big money enters before the hype)
- Retail mania (When mainstream media starts screaming “Bitcoin to $1M”)
How to read the Bitcoin Banana chart?
The Bitcoin Banana Chart is a visual cue for when Bitcoin enters its most aggressive bull run phase. Understanding how to read it is key to spotting entry and exit points before the market overheats.
As we know, the chart itself is divided into three phases: the breakout phase, the Banana zone phase, and the cooling phase. The phases can appear a little technical, so let’s break them down.
The breakout phase or the climb
Here’s what happens:
- Bitcoin gradually trends upward, but most traders are still skeptical.
- Volume pushes through followed by positive on-chain data showing whale accumulation.
- Media coverage is minimal; only early adopters are paying attention.
Past examples
- October 2016: Bitcoin began its ascent from around $600, leading up to the significant bull run in 2017.
- October 2020: Bitcoin started rising from approximately $11,000, setting the stage for the 2021 surge.
- January 2024: Following the approval of Bitcoin ETFs, Bitcoin’s price exceeded $60,000 by the end of February 2024.
How to read it on the chart: Look for a gradual incline in price action, higher lows, and increasing volume.
The Banana zone or the parabolic move
Here’s what happens:
- Price action becomes almost vertical.
- Altcoins surge as retail investors start pouring in money.
- Mainstream media and influencers hype BTC, predicting newer highs.
Past examples
- Bitcoin’s price escalated from $150 to $1,150 within a month in November 2013.
- Bitcoin soared from $5,000 in October to nearly $20,000 by mid-December 2017.
- Bitcoin reached new all-time highs, surpassing $73,000 in March 2024.
How to read it on the chart: Look for steep upward movements, extreme RSI levels (above 80), and over-leveraged long positions.
Market cooling or the market top
Here’s what happens:
- Momentum slows; volatility increases.
- Whales start selling, taking profits.
- Retail investors still believe Bitcoin will never drop — until it does.
Past examples
- December 2013: After peaking, Bitcoin’s price dropped significantly in the following months.
- January 2018: Bitcoin’s price began to decline sharply from its December 2017 highs.
- April 2024: After reaching peaks in March, Bitcoin’s price experienced corrections.
How to read it on the chart: Look for double tops, declining volume, and bearish divergences in RSI.
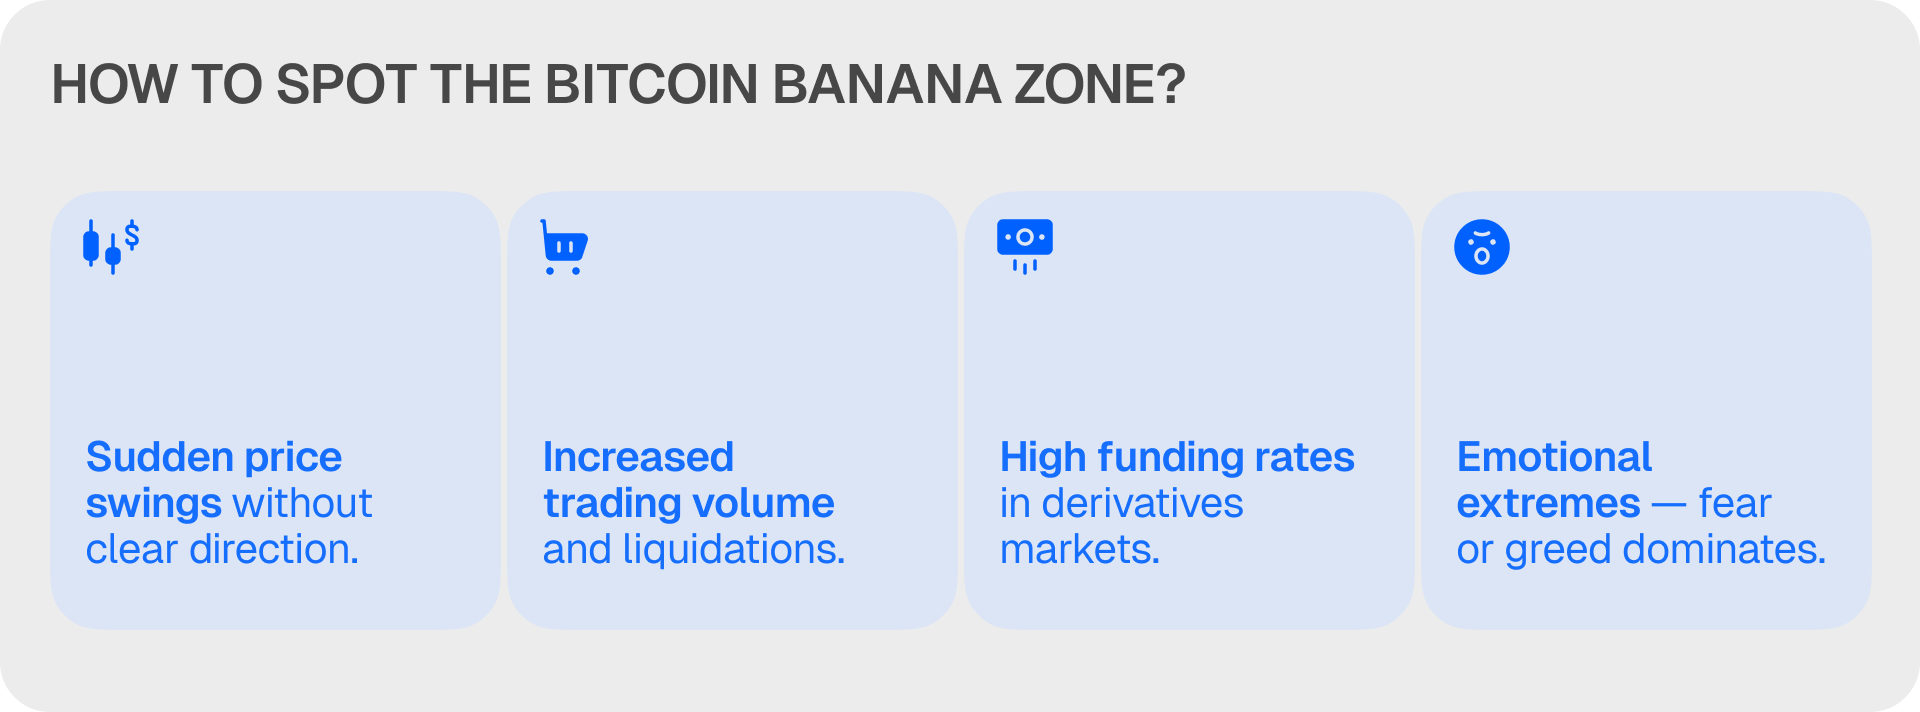
If you need assistance reading the Bitcoin Banana chart and trying to locate the Banana Zone, here are a few key indicators and specifics that might help:
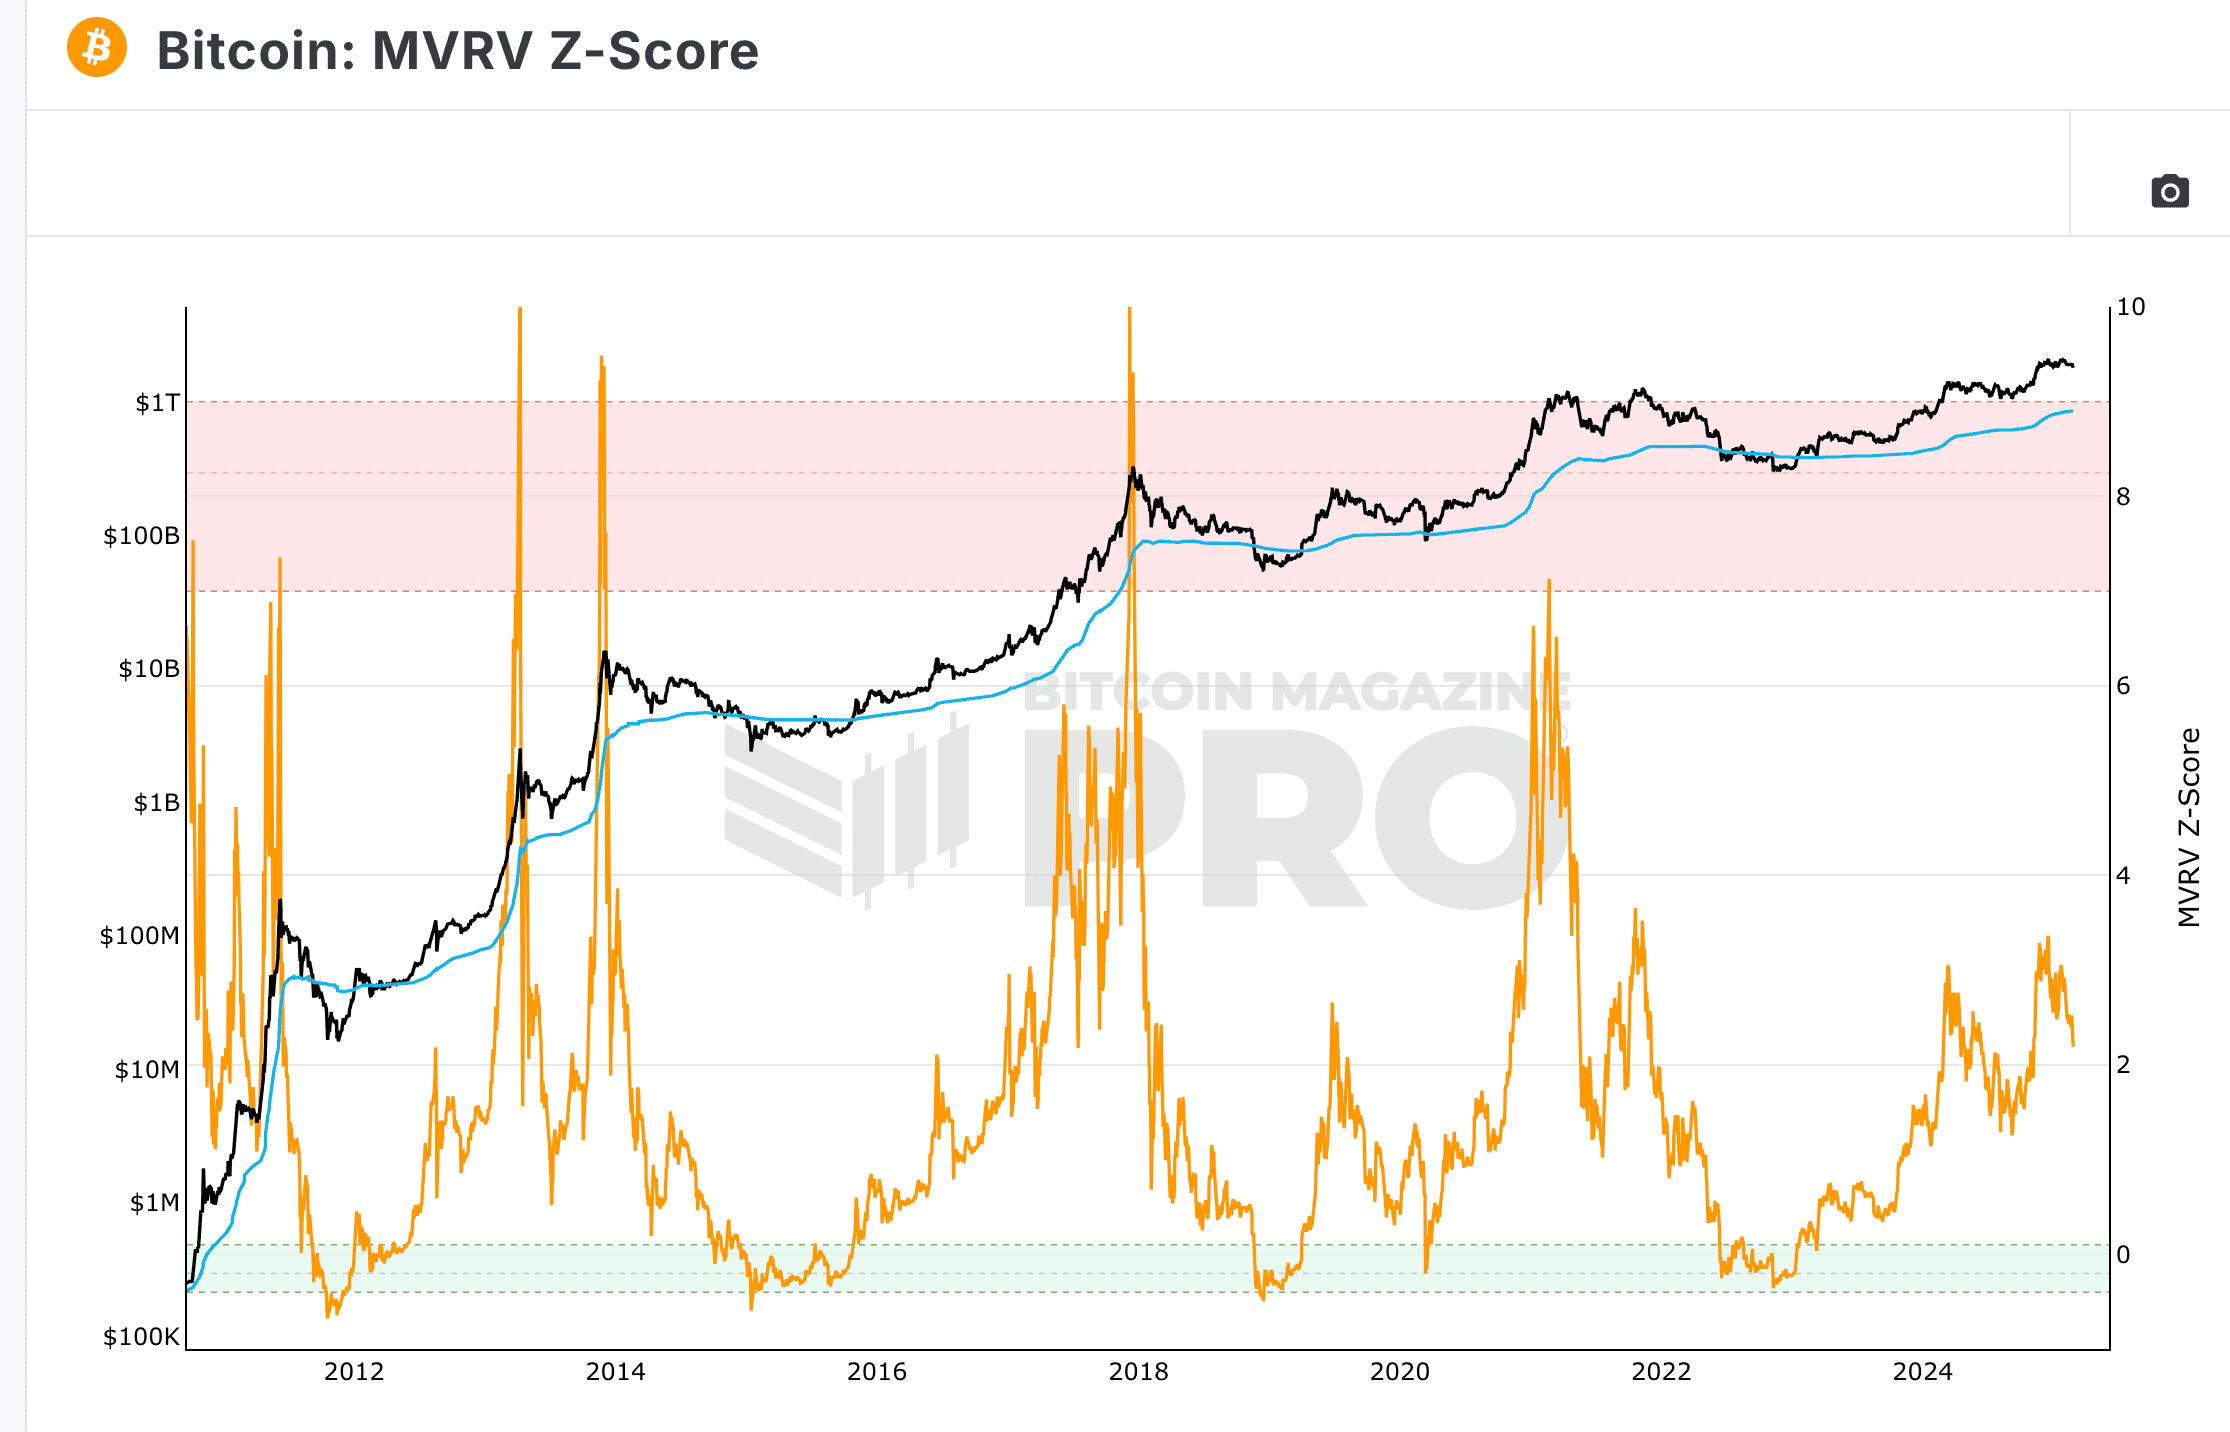
- MVRV Z-score: If above 7, Bitcoin is overheated.
- Whale wallet activity: If whales start moving BTC to exchanges, a top is near.
- Google Search trends: If “Buy Bitcoin” spikes, retail FOMO is at peak levels.
- Leverage funding rates: If traders are over-leveraging long positions, a correction is likely.
Still unsure as to how these indicators work in relation to the Banana chart? Here’s a summary.
Breakout phase: MVRV is low, whales are accumulating, search trends are flat, funding rates are neutral: Bitcoin is gearing up for a run.
Banana Zone: MVRV climbs to 4-7, search trends explode, leverage spikes, and retail FOMO takes over: Bitcoin is in full vertical mode.
Market cooling: MVRV hits 7+, whales move BTC to exchanges, search trends start falling, and funding rates become unsustainable. Here, the cycle is peaking.
The Banana Zone psychology
The Banana zone psychology is tried, tested, and mostly set in stone. In every cycle, investors follow the same emotional pattern: disbelief during the breakout, euphoria in the parabolic run, and denial when the crash starts.
Raoul Pal has often pointed out that Bitcoin’s price surges are driven by human behavior; FOMO (fear of missing out), herd mentality, and overconfidence fuel parabolic moves.
Other market experts like Willy Woo emphasize that as more retail investors jump in, Bitcoin’s volatility increases, making the Banana Zone inevitable.
How to track and use the Bitcoin Banana Zone?
The Bitcoin Banana zone, or rather the entire chart, can be used to make better trading decisions. While the tracking phenomenon is all about checking MVRV-Z, whale transactions, and more, here are the key behavior patterns pertaining to each zone or stage that can help you as a trader:
- Breakout phase: Best time to accumulate before hype kicks in.
- Banana zone: Ride the trend, but start taking profits at major levels.
- Market cooling: Avoid new buys, watch for exit signals, and reduce risk.
Note: Use the Banana Chart as a roadmap, not an indicator. Don’t chase FOMO, but position yourself early.
How to trade Bitcoin using the Banana Zone theory?
The Bitcoin Banana Zone Theory is a trading framework that has played out in every bull cycle. By understanding how past traders have used it, you can learn how to time your entries, take profits, and avoid the inevitable crash.
And it is not rocket science. As a newbie or even an experienced trader, you need to focus on three aspects; entering correctly, profit-taking, and avoiding crashes. Let’s take a closer look.
Entry strategy
Every cycle starts with a quiet accumulation phase, where Bitcoin moves slowly upward, but sentiment remains mixed.
Past case studies
- 2016 breakout: Traders who accumulated in October 2016 (~$600) rode the bull run to $20K by 2017.
- 2020 breakout: Bitcoin hovered around $10K from May to October 2020 before exploding to $69K in 2021.
- 2024 breakout: Early accumulators in January 2024 (~$42K) positioned themselves for Bitcoin’s push past $70K in March 2024.
Trading hack: Look for steady higher lows, increasing volume, and institutional accumulation signals.
Additional steps to enter correctly
- Buy during the breakout phase when Bitcoin reclaims major moving averages (50DMA, 200DMA).
- Use stop-losses to protect against fakeouts.
- Check whale accumulation trends; if large holders are buying, a bull run is likely.
Profit-taking
Most traders make money in the Banana Zone but lose it by not taking profits.
2017: Traders who sold near $18K-$19K in December 2017 avoided the 80% crash to $3K in 2018.
2021: Smart traders exited around $60K in April before Bitcoin dropped to $30K in May.
2024: As Bitcoin passed $70K in March, some whales moved BTC to exchanges, displaying potential early profit-taking signals.
But how do you manage this smartly?
The closer we get to extreme hype (media headlines, retail FOMO), the more cautious traders should be. Also, you can take partial profits at psychological price levels ($75K, $100K, etc.). From a trading perspective, look for bearish divergences in momentum indicators (RSI, MACD) and Bollinger divergences. Finally, watch for extreme leverage spikes; once traders over-leverage, Bitcoin often reverses.
Did you know? Leveraging assets allows traders to borrow funds against collateral to increase their position size, meaning bigger potential gains; but also bigger risks. In the Banana Zone, many traders over-leverage long positions, betting that Bitcoin will keep rising forever. The problem? When the price suddenly drops, these traders get liquidated, forcing automatic sell-offs that accelerate crashes. This happened in April 2021, when excessive leverage led to a $10B liquidation event, crashing Bitcoin from $64K to $30K in weeks.
Avoiding the crash
Every Bitcoin Banana Zone ends the same way; traders ignore warning signs, and a massive sell-off wipes out overleveraged positions. Do not be that trader. Here is some past data for your reference:
- 2014: Bitcoin collapsed from $1,200 to $200 within a year; most traders ignored early warning signals from whale sell-offs.
- 2018: Bitcoin tanked from $20K to $3K, but on-chain indicators had already shown whales offloading BTC in late 2017.
- 2022: Bitcoin’s MVRV was overheated in April, but traders ignored it! BTC crashed from $69K to $16K by the end of 2022.
Trading hack: Look for a slow rollover in price, combined with declining volume and whale movement to exchanges. This usually signals an incoming market cooldown. Also, make sure to exit leveraged positions early and try moving profits to stablecoins.
BeInCrypto insight: Watch for liquidity traps; Bitcoin often gives a “fake breakout” before reversing. Do not assume the Banana Zone is continuing.
Common mistakes traders make in the Bitcoin Banana Zone
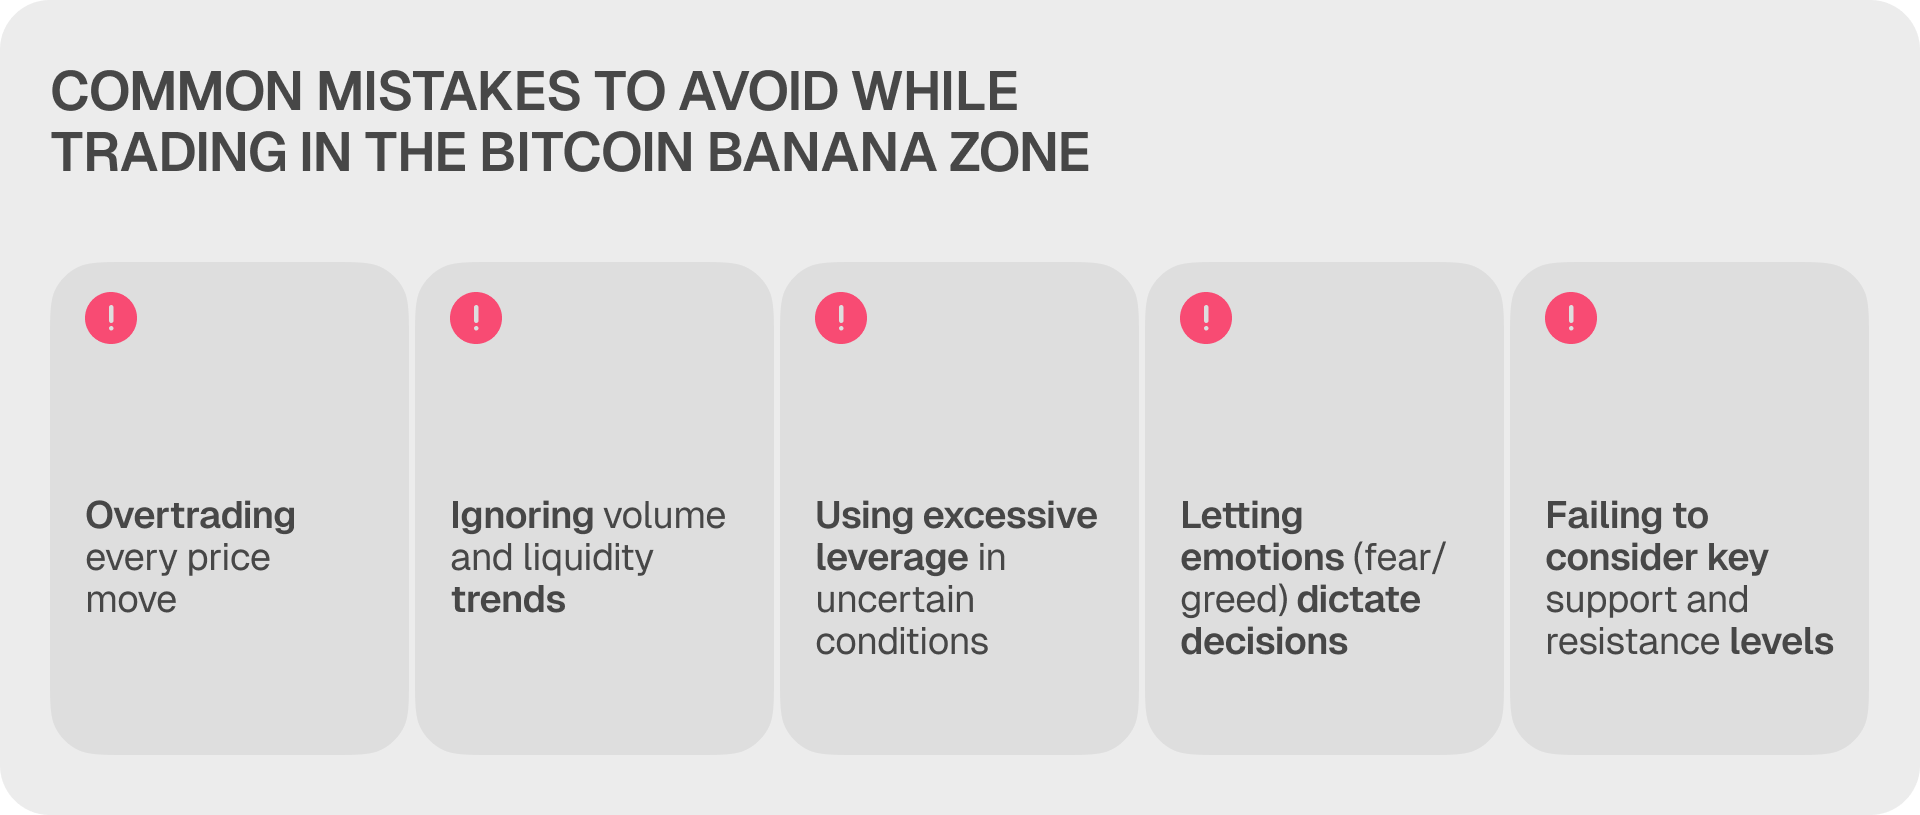
We have already mentioned the trading do’s and don’ts. Here’s a quick summary.
- FOMO buying at the peak
- Ignoring profit-taking opportunities
- Over-leveraging long positions
- Trusting social media hype
- Not watching whale movements
- Chasing altcoin pumps too late
- Holding through the market cooling phase
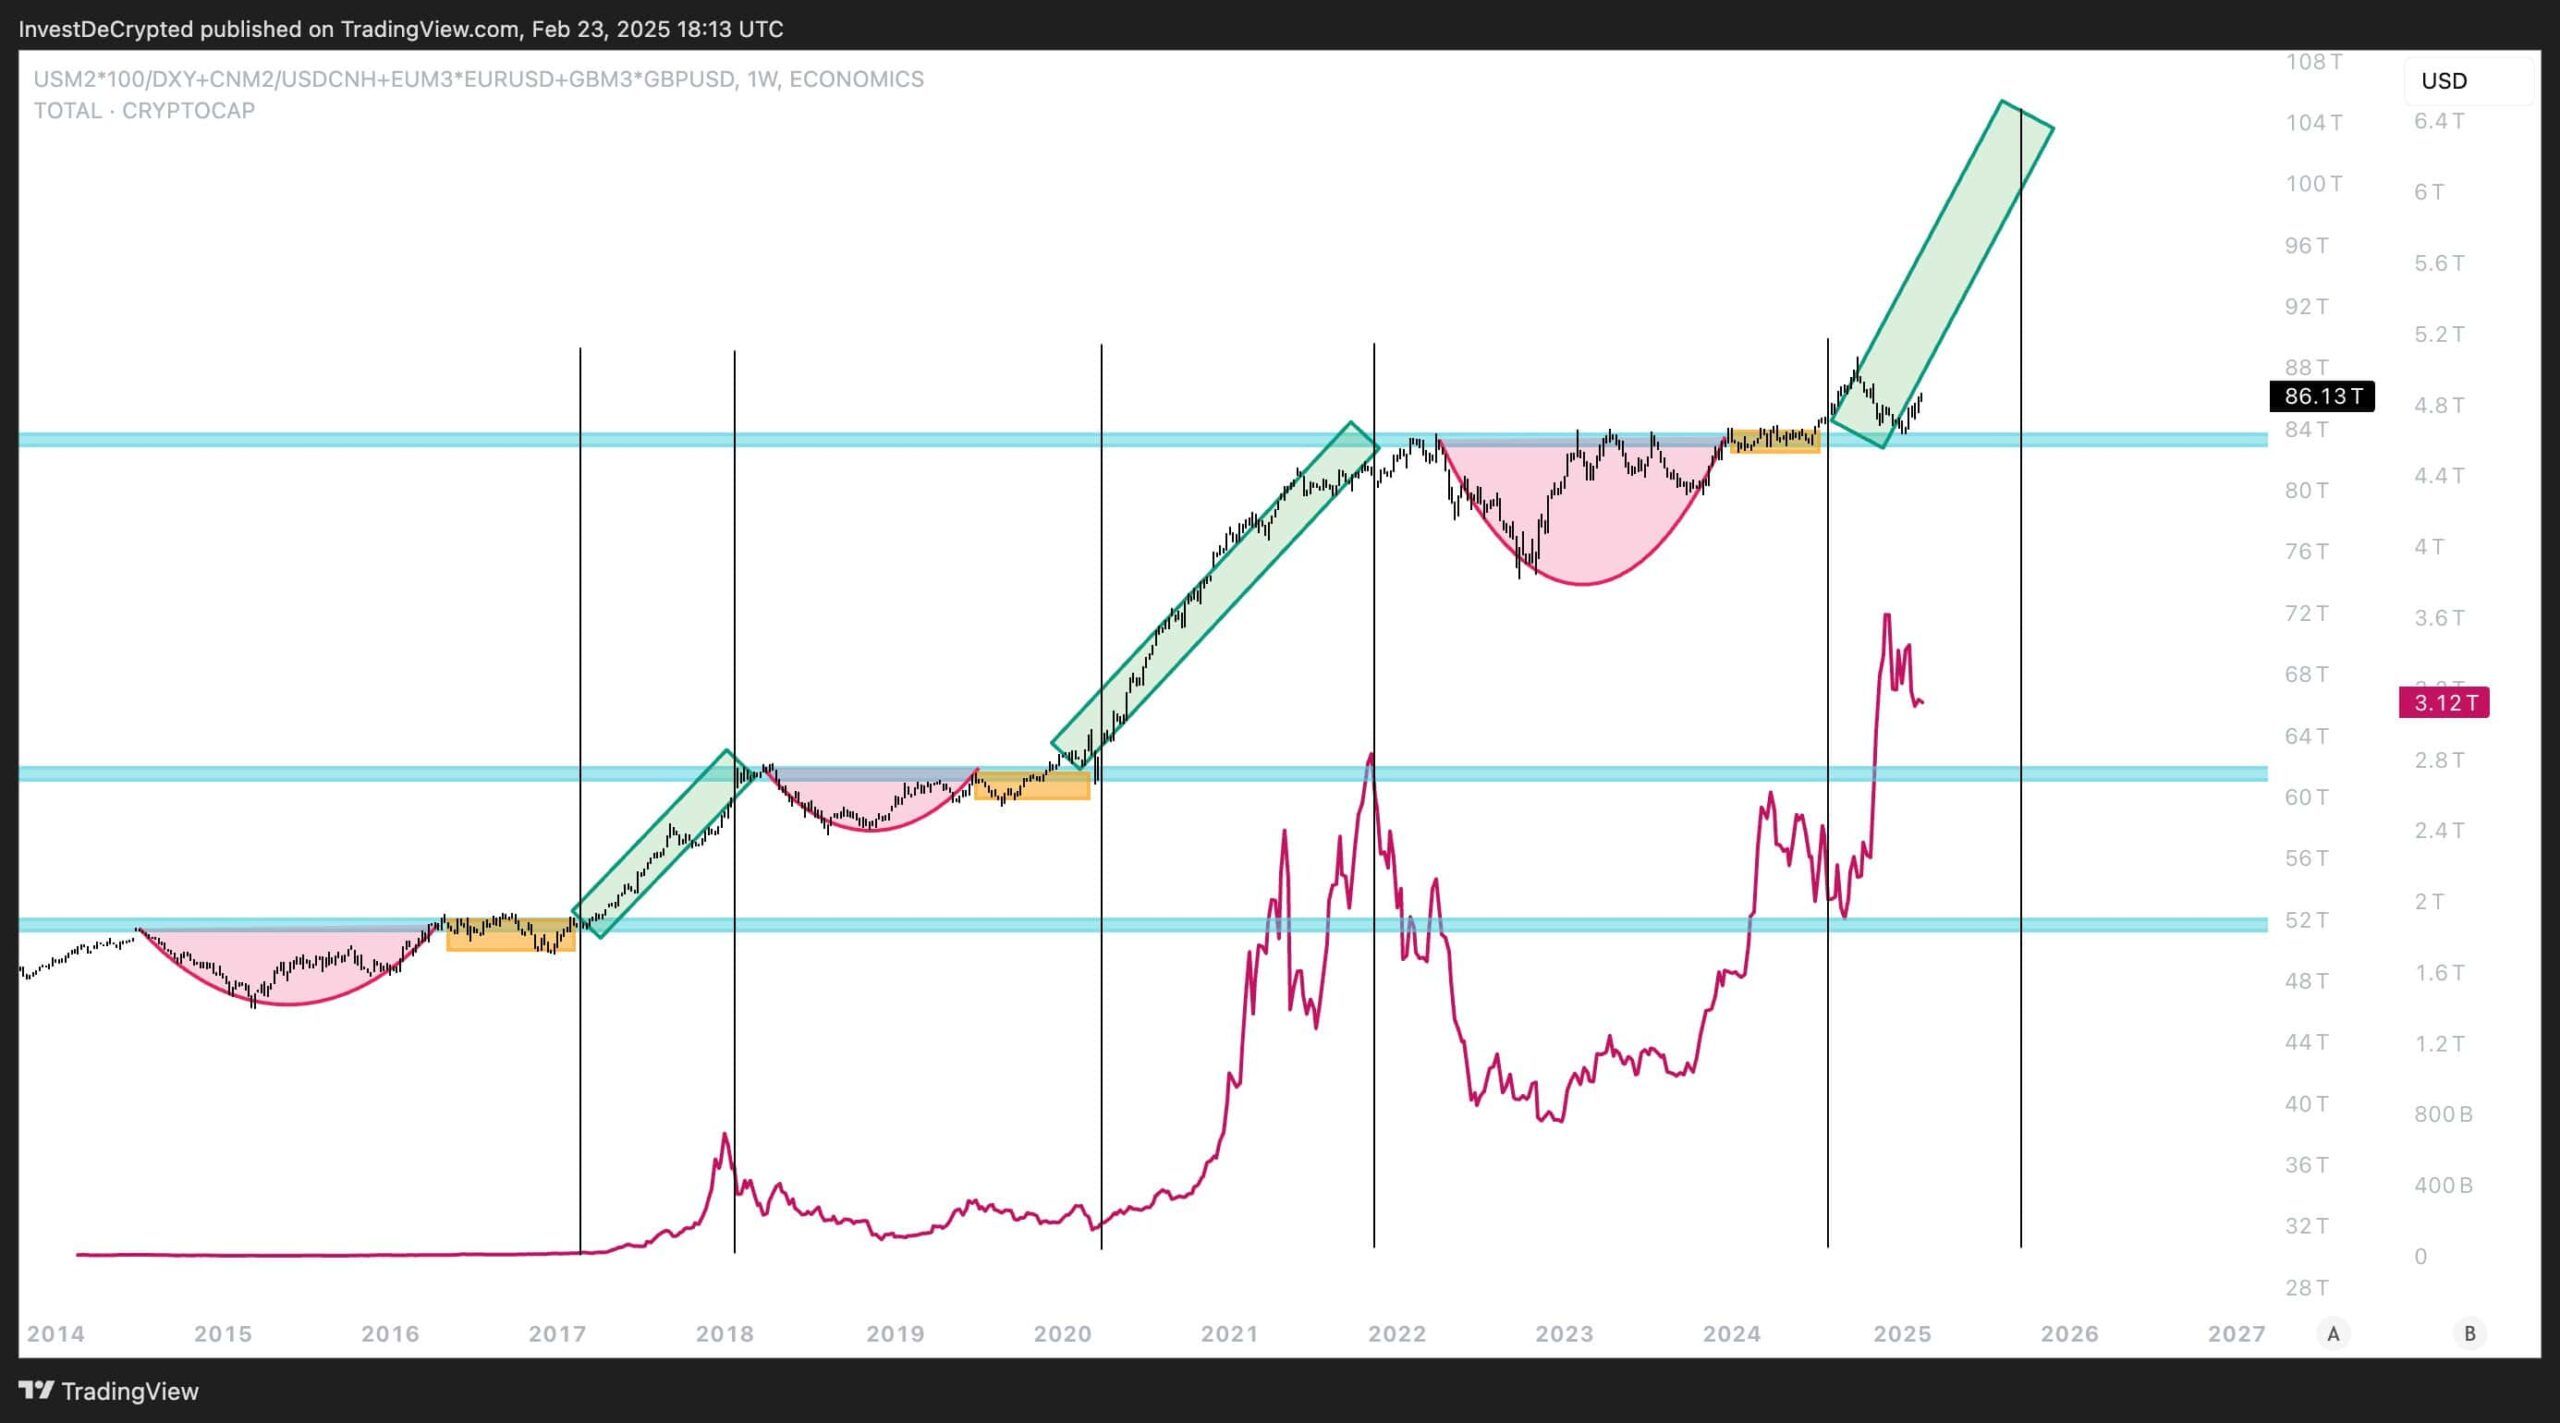
Bitcoin Banana Zone predictions for 2025 and beyond
As of late February, BTC has corrected quite a bit from its January 2025 high of $108,786. This has has sparked debate about whether the Banana Zone is ending or if this is just another consolidation phase before the next leg up. Experts suggest Bitcoin is still in the Banana Zone, following historical market patterns, with the potential for another surge before the cycle peaks.
Pal believes Bitcoin is in Banana Zone Phase 2, similar to 2017. This means the ongoing correction might be a strong pullback before the next upward leg, like with past bull runs. Plus, altcoins may soon outperform BTC, following historical cycle trends. Also, Bitcoin’s cycle top hasn’t formed yet, as market euphoria is still moderate.
Plus, experts like Anthony Scaramucci predicted that ETF inflows could push Bitcoin to $200,000 in 2025, a perspective similar to Bernstein analysts. Per our analysis, the Bitcoin MVRV-Z score is still languishing at under 2.5, which is a healthy sign for the market.
Can the Bitcoin Banana zone predict an altseason?
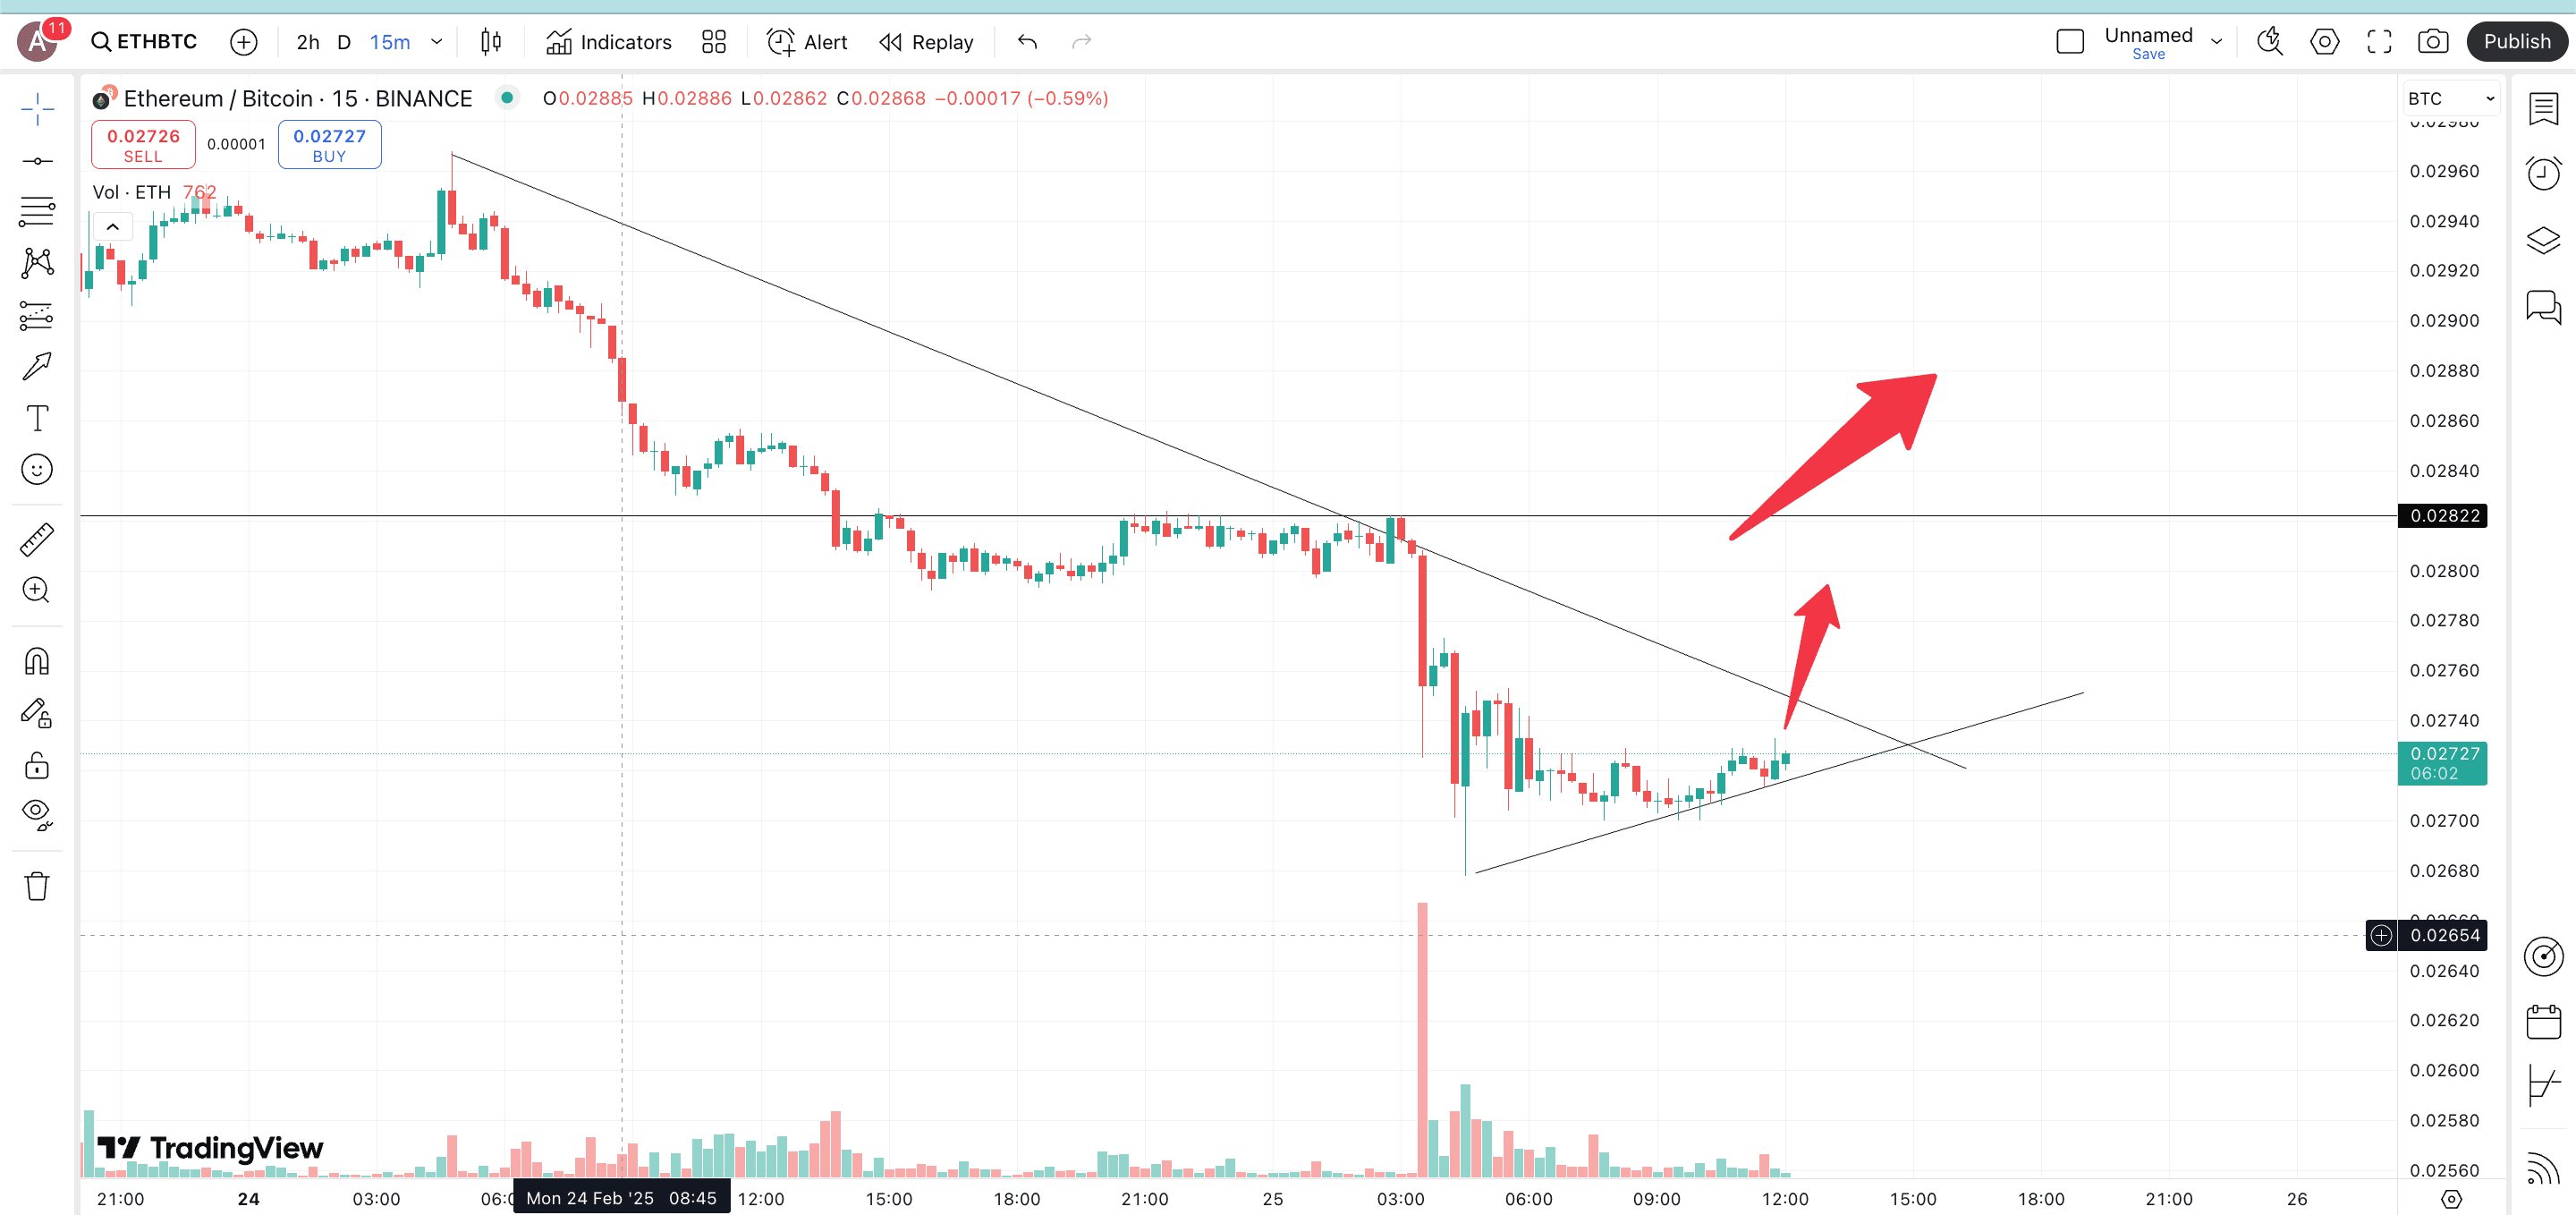
Yes, tracking the Bitcoin banana chart can also help predict altcoin season. When Bitcoin is in the parabolic or the banana zone, be on the lookout for a drop in Bitcoin dominance and a liquidity shift to riskier assets like meme coins, SOL, and more.
BIC insight: Look for BTC dominance declining below 50% and ETH/BTC pair strength increasing; these are key signals that altcoin season is beginning.
Is the Bitcoin Banana Zone a reliable market indicator?
The Bitcoin Banana Zone isn’t a precise trading signal. Instead, it is a powerful market cycle framework. Historically, Bitcoin’s bull runs follow the same parabolic pattern, with breakout and eventual cooling. Current 2025 trends suggest Bitcoin is still in the Banana Zone, with potential for another rally. Traders should track key indicators; whale movements, BTC dominance, and leverage rates to make better trading calls.
Disclaimer: This article is for informational purposes only and should not be considered investment advice. Always do your own research (DYOR).
