


A crucial horizontal area rejected the Polkadot (DOT) price, while the Kusama (KSM) price reclaimed its own horizontal level.
Polkadot (DOT) Price Falters After Rejection
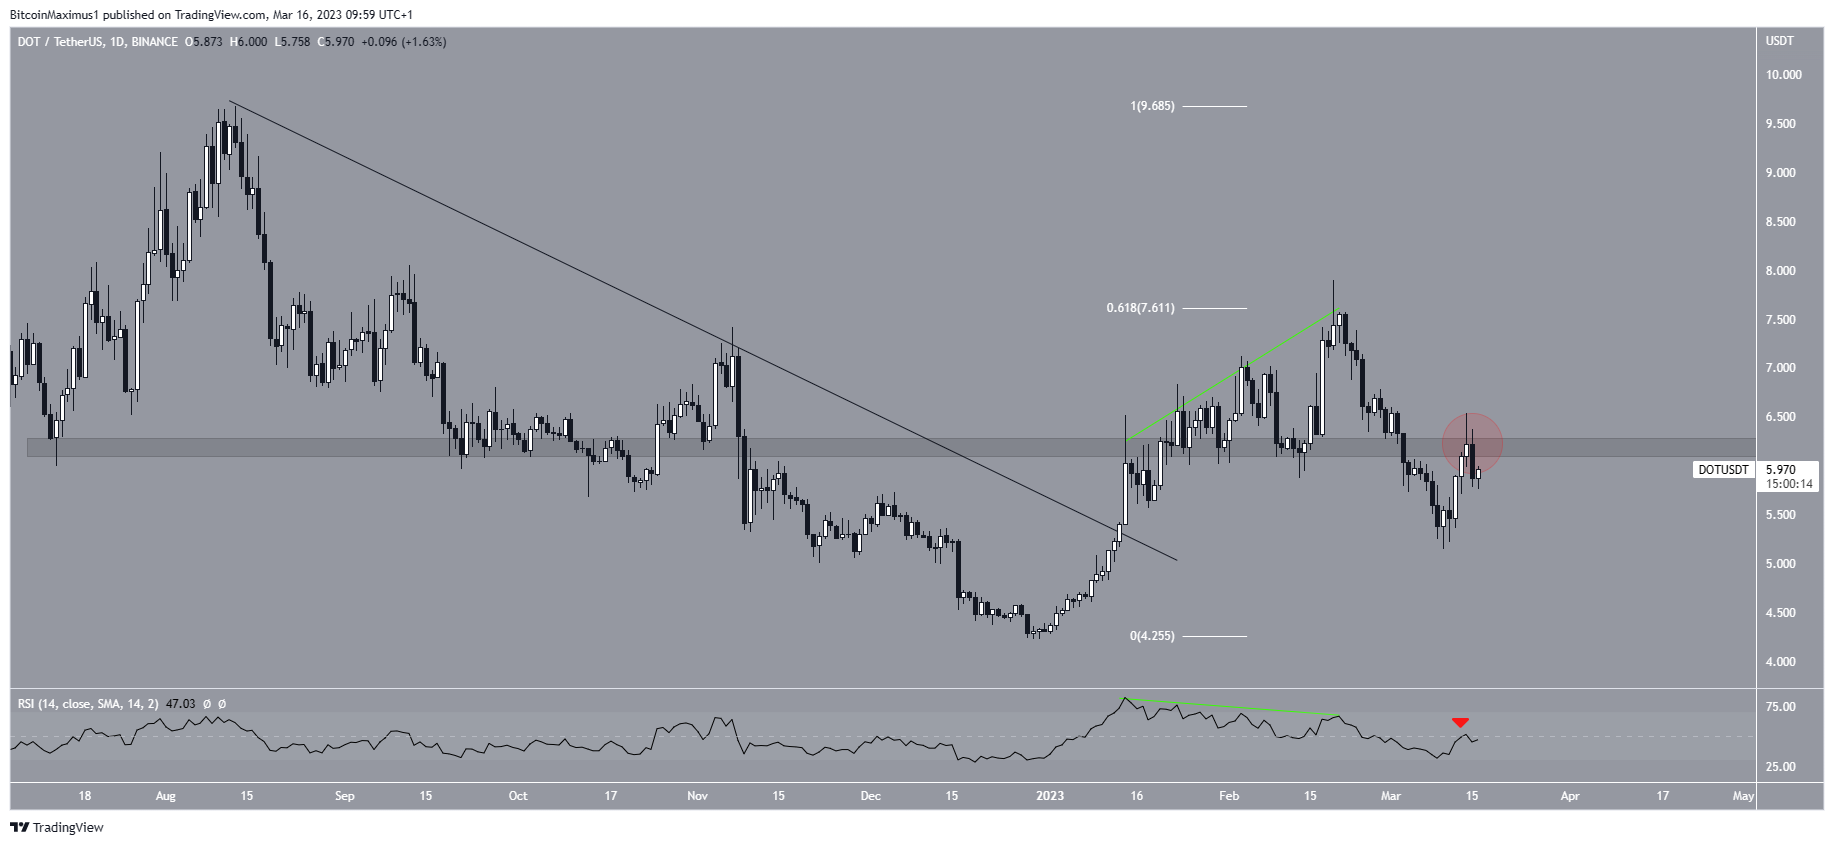
The DOT price has fallen since reaching its yearly high of $7.90 on Feb. 19. The decrease was preceded by a bearish divergence in the daily RSI. It led to a low of $5.15 on March 10.
More importantly, the price fell below the $6.20 support area. Then, it validated it as resistance on March 14 (red circle). The rejection also coincided with an RSI rejection from the 50 line (red icon), increasing its significance.
Whether the Polkadot price reclaims the area or fails to do so will likely determine the future trend’s direction. If it reclaims it, DOT could increase to $7.60. However, if the rejection continues, the DOT token price could fall to the year’s lowest price at $4.25.
Kusama (KSM) Price Reclaims Key Level
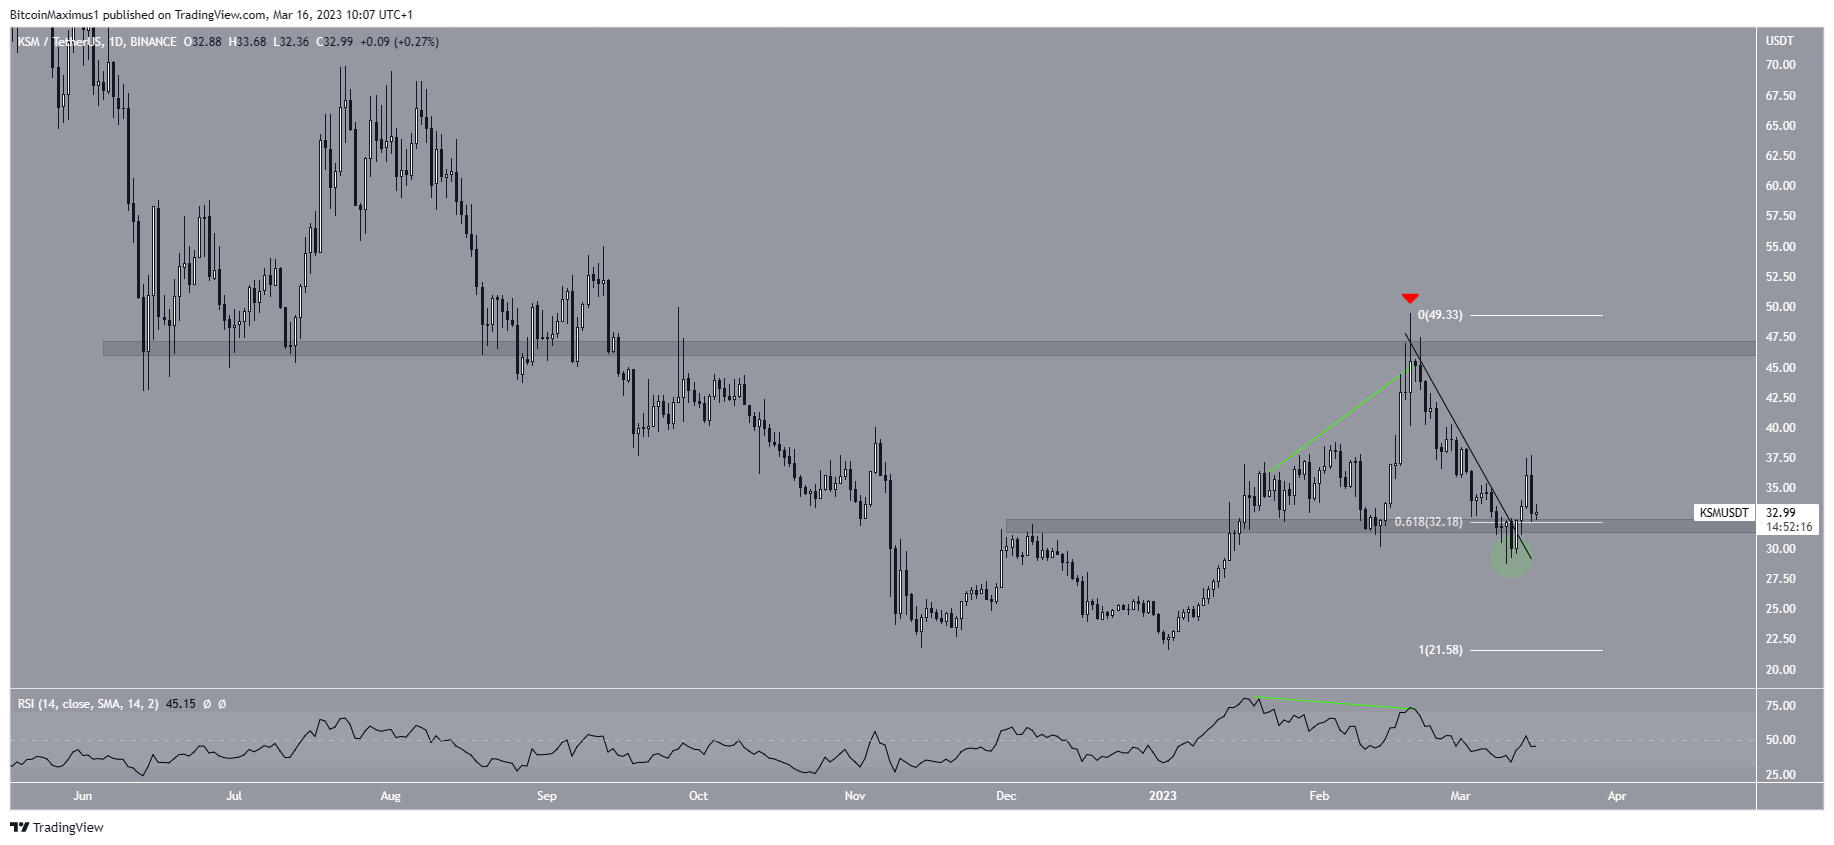
Similar to DOT, the KSM price has fallen since its yearly high of $49.49 on Feb. 19. The decrease was preceded by a bearish divergence in the daily RSI (green line). The drop validated the $46 area as support.
However, the price action since then has looked more bullish than that of DOT. The main reason is that the KSM token price reclaimed the $32.20 area after initially deviating (green circle) below it. The support area is created by both the 0.618 Fib and a horizontal level. Such deviations often precede significant upward movements. Moreover, the price broke out from a short-term descending resistance line.
As a result, an increase toward $47 is the most likely scenario.
However, a close below $32.20 would invalidate this outlook. In that case, the Kusama price could fall to $22.50.
To conclude, the KSM price movement looks more bullish than that of DOT. This is because the former has reclaimed a horizontal level while the latter was rejected by one. Therefore, it has a higher chance of moving upward. A close below the aforementioned support area would invalidate this outlook and could lead to a sharp fall toward $22.50.


