


The Flamingo Finance (FLM) price increased by 200% on September 4 and 5 but has fallen since, validating a diagonal and horizontal resistance level in the process.
Despite the decrease, the weekly and daily timeframe readings support the possibility of an eventual breakout.
Flamingo Finance Price Makes Failed Attempt at Breakout
The FLM price has fallen under a descending resistance line since April 2022. During this time, the price exceeded the line several times but failed to reach a close above it. Rather, these movements created long upper wicks (red icons), considered signs of selling pressure.
Despite these rejections, it is worth mentioning that lines get weaker each time they are touched. Therefore, an eventual breakout from the line is still the most likely future price scenario.
The weekly RSI is also turning bullish. The RSI is a momentum indicator utilized by traders to assess whether a market is overbought or oversold, assisting them in deciding whether to accumulate or sell an asset.
Readings above 50 and an upward trend suggest that bulls still have an advantage, while readings below 50 indicate the opposite.
The indicator has generated bullish divergence (green line), an occurrence when a momentum increase accompanies a price decrease. This development often precedes upward movements. Furthermore, the RSI has nearly moved above 50, a sign of a bullish trend.
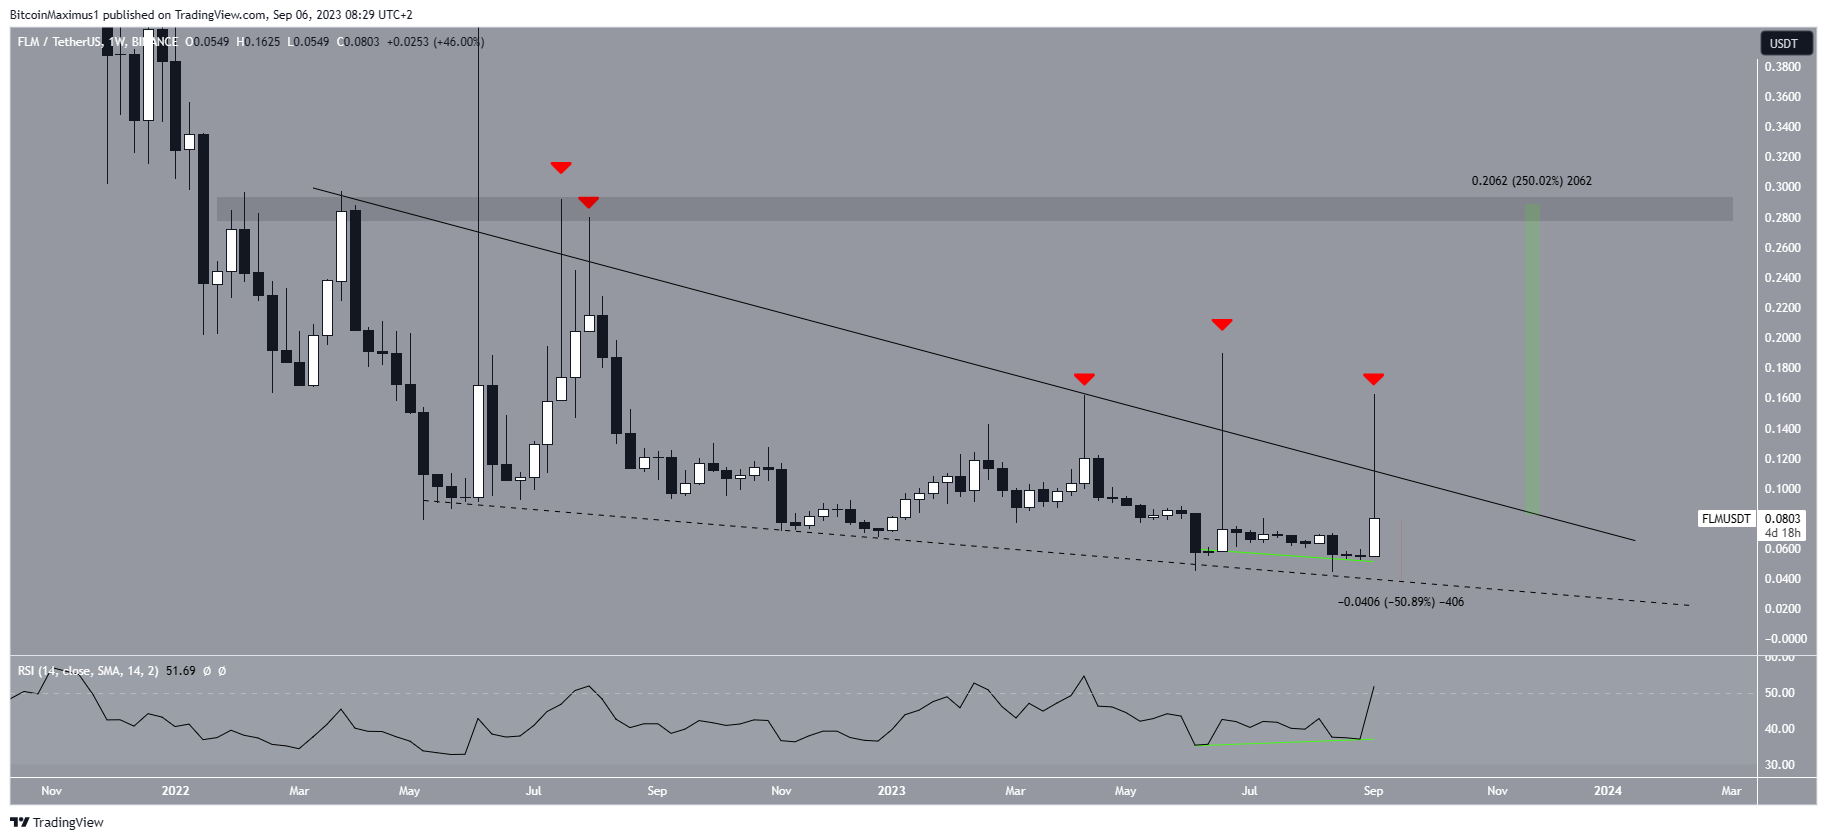
If the FLM price breaks out, it can increase by 250% and reach the next resistance at $0.290. However, if it fails to do so, a 50% drop to a descending support line (dashed) at $0.040 will be the most likely future FLM price prediction.
FLM Price Prediction: When Will Breakout Occur?
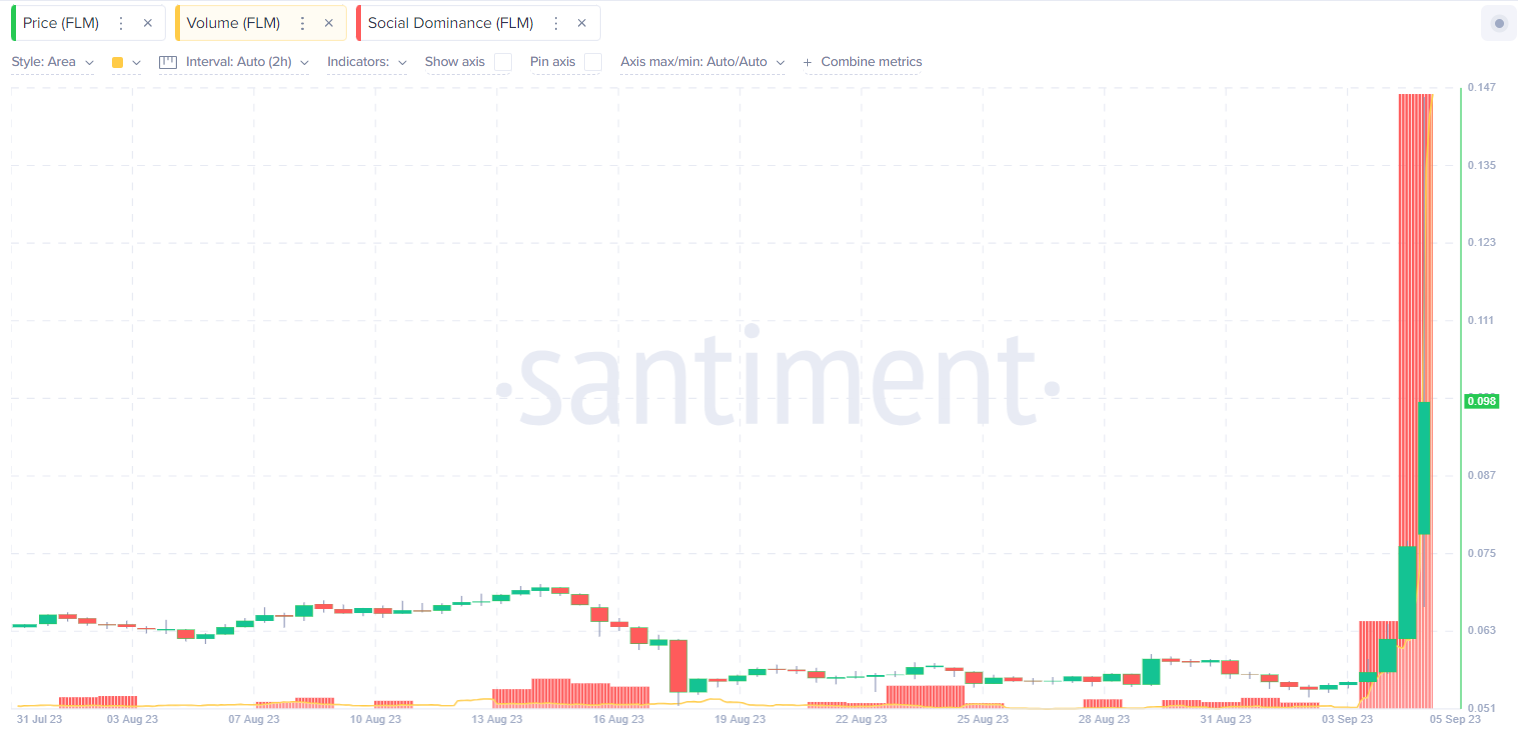
The daily timeframe technical analysis shows that the FLM price increased by 200% between September 4 and 5. The FLM trading volume spiked to the highest levels since June 2022 after the pump. Moreover, the FLM social dominance metric soared to the highest level in 5 weeks, as seen below:
Read More: 9 Best Crypto Demo Accounts For Trading
However, the rate of increase could not be sustained. Rather, the price created a long upper wick and then fell below the $0.120 horizontal resistance area.
Nevertheless, FLM is still trading above an ascending support line that has been in place since June. More recently, the price validated this line on August 17, bouncing after its all-time low of $0.044. Then, it created a higher low on September 1 before accelerating its rate of increase.
Furthermore, the daily RSI is still bullish since the indicator is above 50.
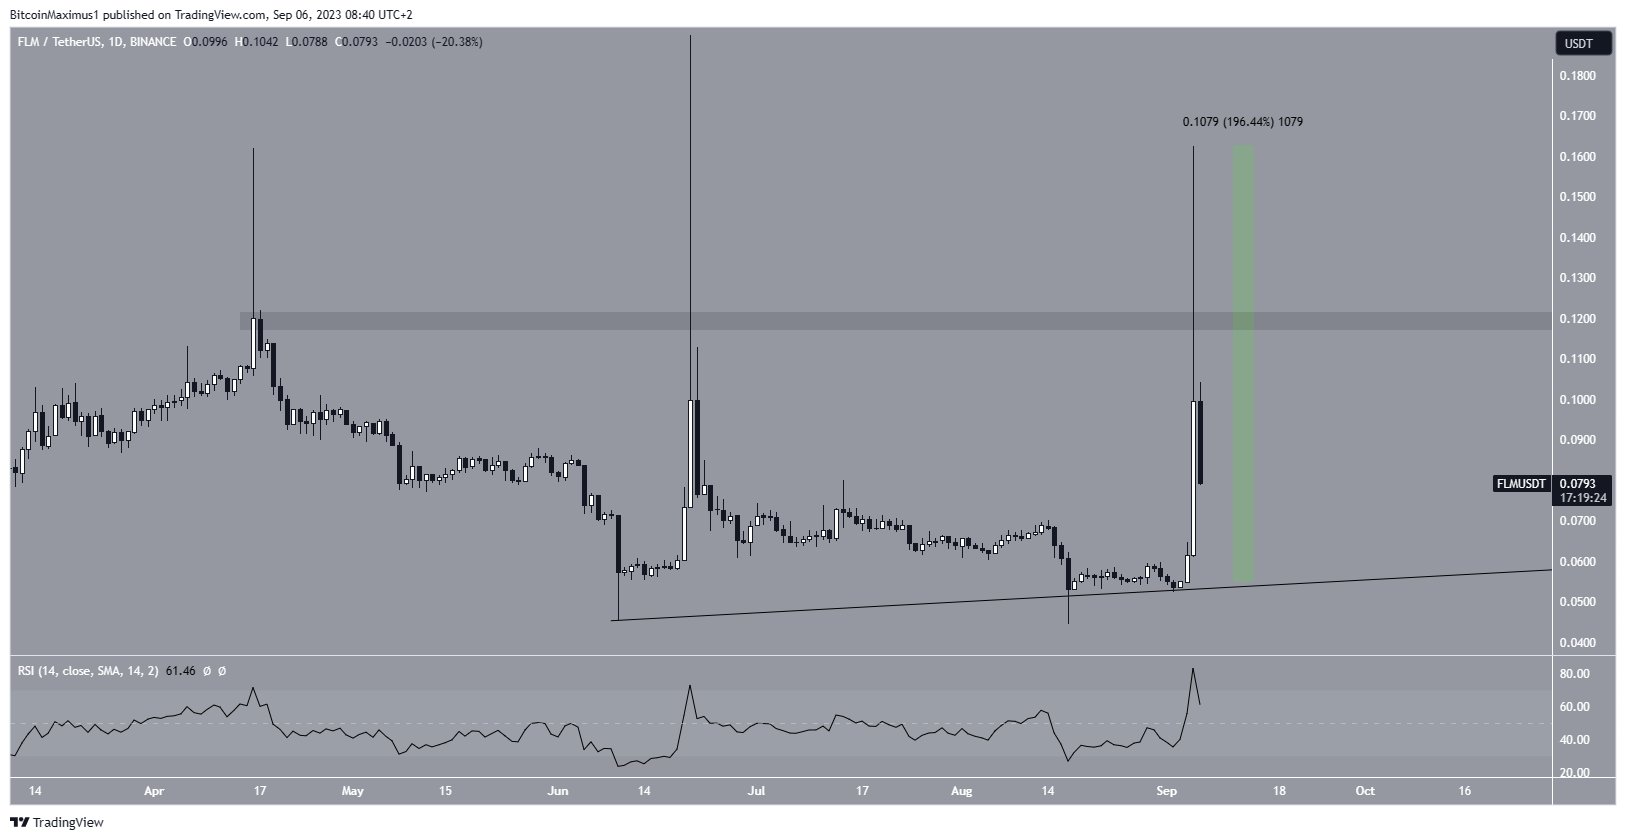
Therefore, the most likely FLM price prediction is a breakout from the descending resistance line and $0.120 area. This could trigger an increase to the next resistance at $0.290.
However, a breakdown from the ascending support line will invalidate this bullish forecast and could cause a drop to the next closest support at $0.040.
For BeInCrypto’s latest crypto market analysis, click here.


