BeInCrypto breaks down the five biggest altcoin movers and shakers from the previous week. Will their momentum continue this week?
The top gaining altcoins of the past week were:
- Axie Infinity (AXS): 131.61%
- OMG Network (OMG): 88.08%
- Qtum (QTUM): 39.79%
- ICON (ICX): 36.43%
- Tezos (XTZ): 35.86%
AXS
AXS has been increasing since Sept 23, when it first broke out from a descending resistance line. The breakout was supported by the RSI and MACD, which are both increasing.
On Oct 4, AXS reached a new all-time high price of $153.79. The next closest resistance area is found at $169. This is the 2.61 external Fib retracement resistance level when measuring the most recent drop.
OMG
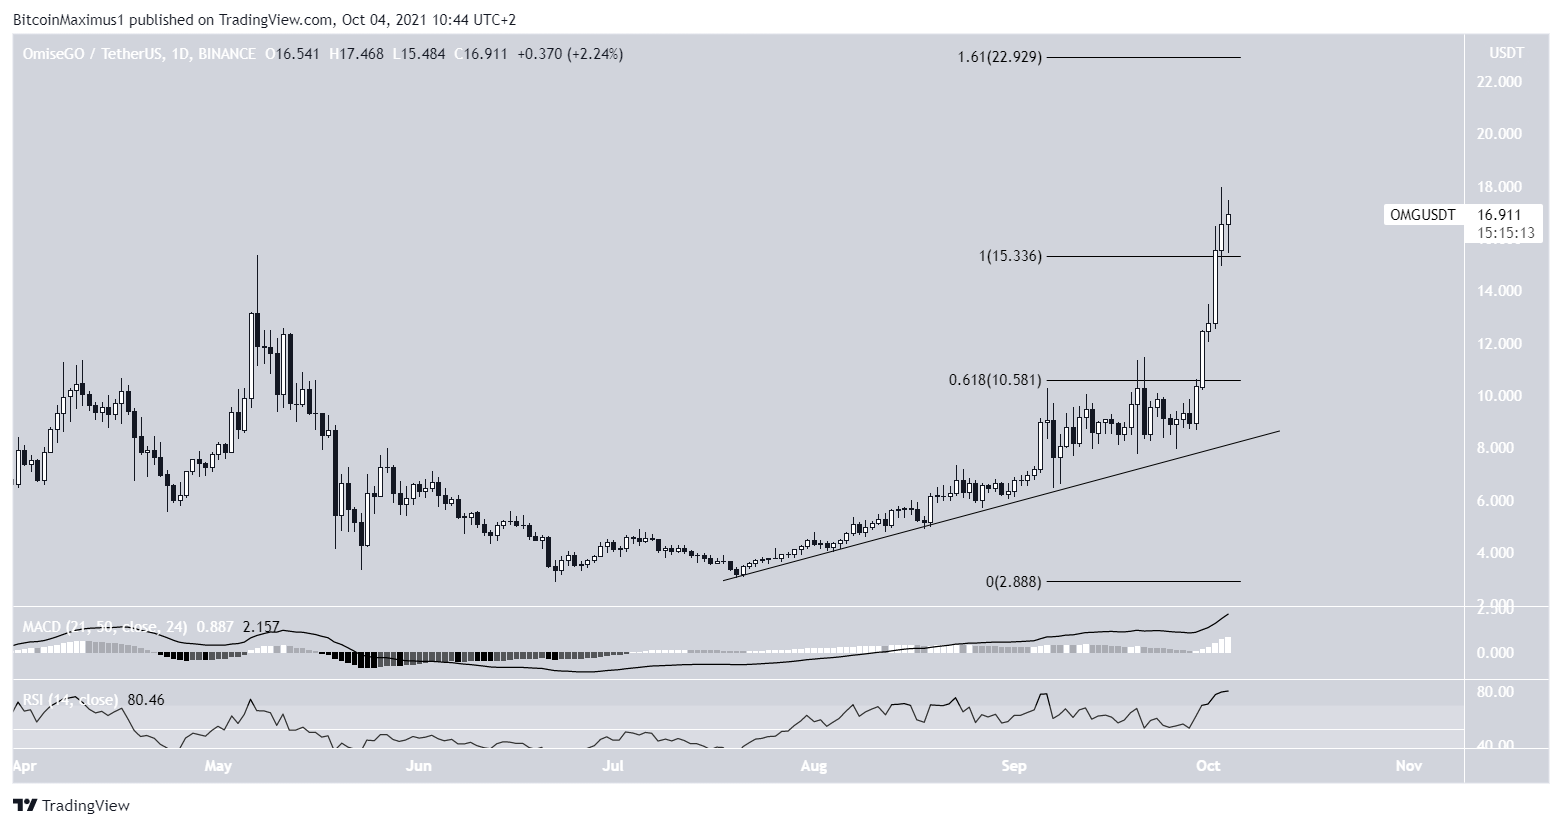
OMG has been increasing above an ascending support line since July 20. In the period from Sept 6 to 20, it struggled to move above the 0.618 Fib retracement resistance level at $10.60.
However, it was finally successful in breaking out on Oct 2 and proceeded to reach a new all-time high price of $17.98 the next day.
The breakout is supported by the RSI and MACD, which are both increasing.
The next closest resistance area is found at $23. This is the 1.61 external Fib retracement resistance level.
QTUM
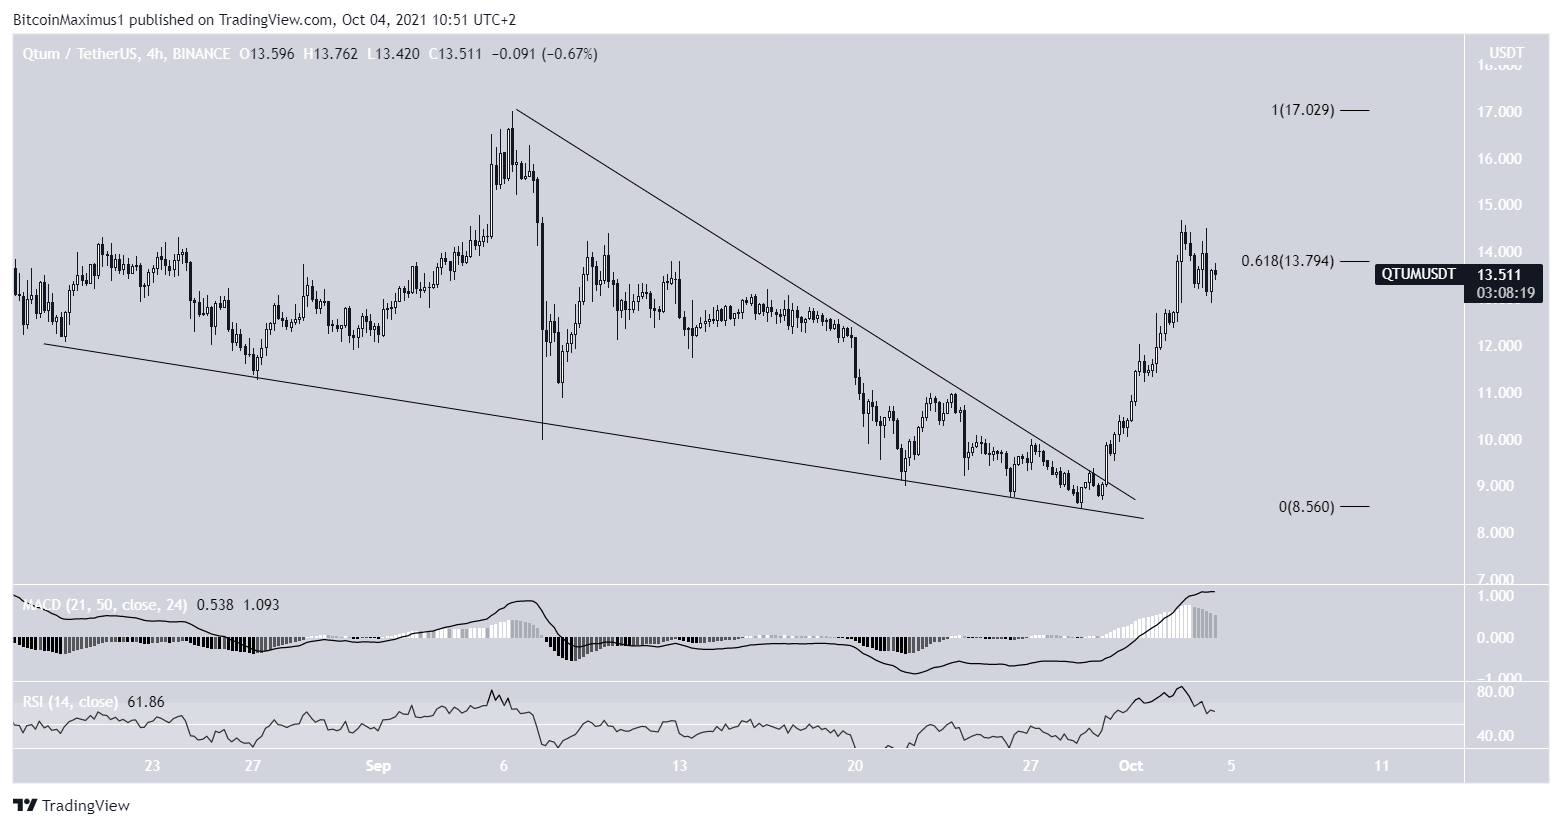
QTUM has been increasing since breaking out from a descending wedge on Sept 30. The upward move continued until a high of $14.68 was reached on Oct 3. The high was made right at the 0.618 Fib retracement resistance level.
QTUM was rejected once it reached the area and has fallen slightly since. The decrease is also supported by the MACD and RSI, which are both falling.
However, the breakout from the wedge looks impulsive. Therefore, it’s likely that QTUM will resume its upward movement after completing a short-term dip.
ICX
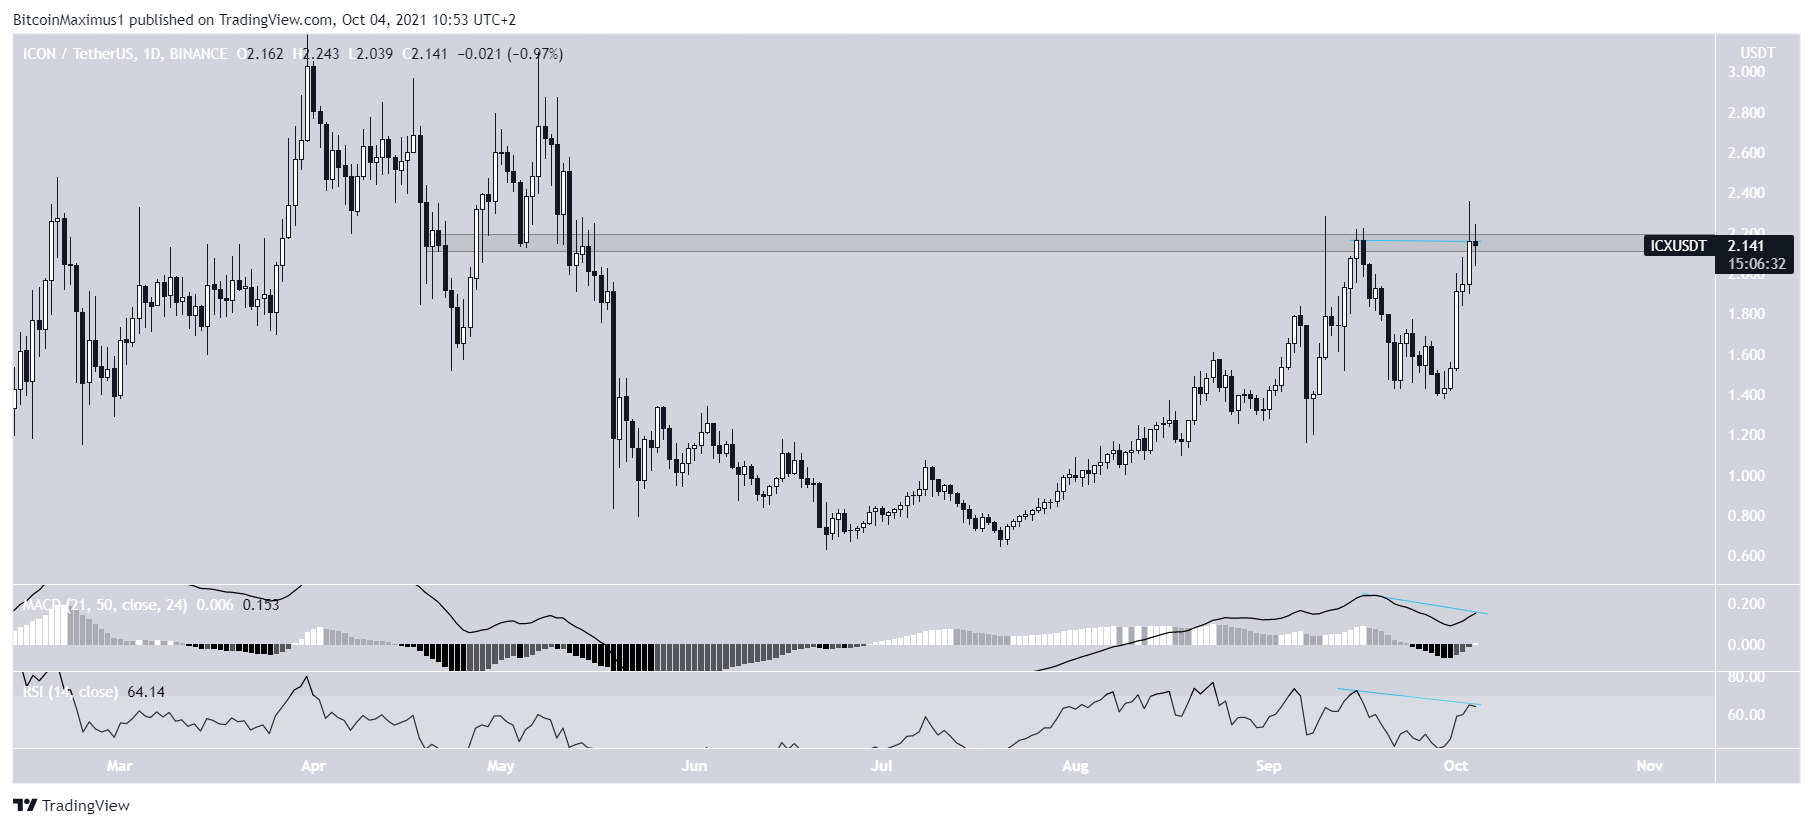
On Sept 15, ICX reached a high of $2.22. However, it was rejected by the $2.15 resistance area and fell shortly after.
On Oct 3, ICX reached a high of $2.36 but again fell below the $2.15 area. This created a double top pattern, which is combined with a bearish divergence in the RSI and MACD.
Until ICX manages to reclaim the $2.15 area, the trend cannot be considered bullish.
XTZ
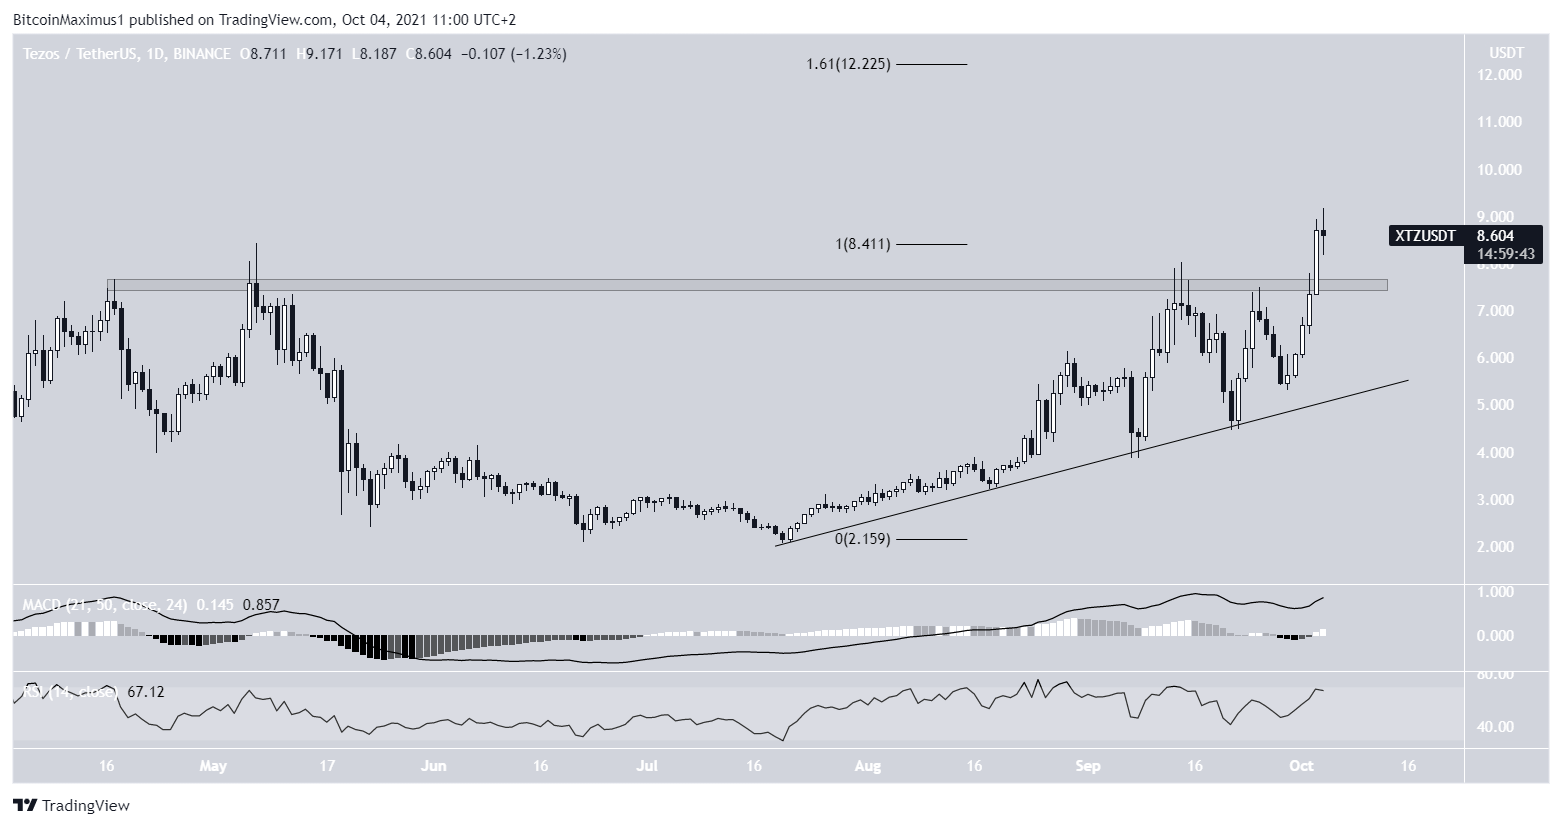
XTZ has been increasing above an ascending support line since July 17. After failing to reach a new all-time high on Sept 14, it broke out on Oct 3 and proceeded to reach a new all-time high price of $9.17.
The breakout is supported by the increasing MACD and RSI. The next closest resistance area is found at $12.22, This is the 1.61 external Fib retracement resistance level.
For BeInCrypto’s latest Bitcoin (BTC) analysis, click here.
Disclaimer
In line with the Trust Project guidelines, this price analysis article is for informational purposes only and should not be considered financial or investment advice. BeInCrypto is committed to accurate, unbiased reporting, but market conditions are subject to change without notice. Always conduct your own research and consult with a professional before making any financial decisions. Please note that our Terms and Conditions, Privacy Policy, and Disclaimers have been updated.


