

The Ethereum (ETH) price has fallen since reaching a new yearly high on July 14. The decrease puts the previous upward movement at risk and suggests that a short-term breakdown could transpire.
The fear of a breakdown is increased by the fact that a whale transferred 61,000 ETH from his cold storage to the Kraken exchange. A sale of this magnitude could have a bearish effect on the price, potentially causing a breakdown from the current short-term pattern.
Ethereum Price Struggles to Hold Above Support
The Ethereum daily time frame technical analysis appears to give mixed signals. Both indicator readings and price action contribute to this situation.
On June 21, the Ethereum price broke out from a descending resistance line (dashed), reaching a peak of $2,029 on July 14. This high seemed to indicate a breakout from the $1,900 resistance area, which is a crucial level.
- Read More: Ethereum (ETH) Price Prediction
The initial breakout from the line and resistance area suggested a potential bullish trend reversal that could lead to new highs for ETH.
However, shortly after reaching the $2,029 high, Ethereum fell. It is currently trading inside the $1,900 area, potentially validating it as support. The price risks breaking down from a short-term ascending support line despite this possibility.
If this occurs, it will also cause a breakdown below the $1,900 horizontal area.
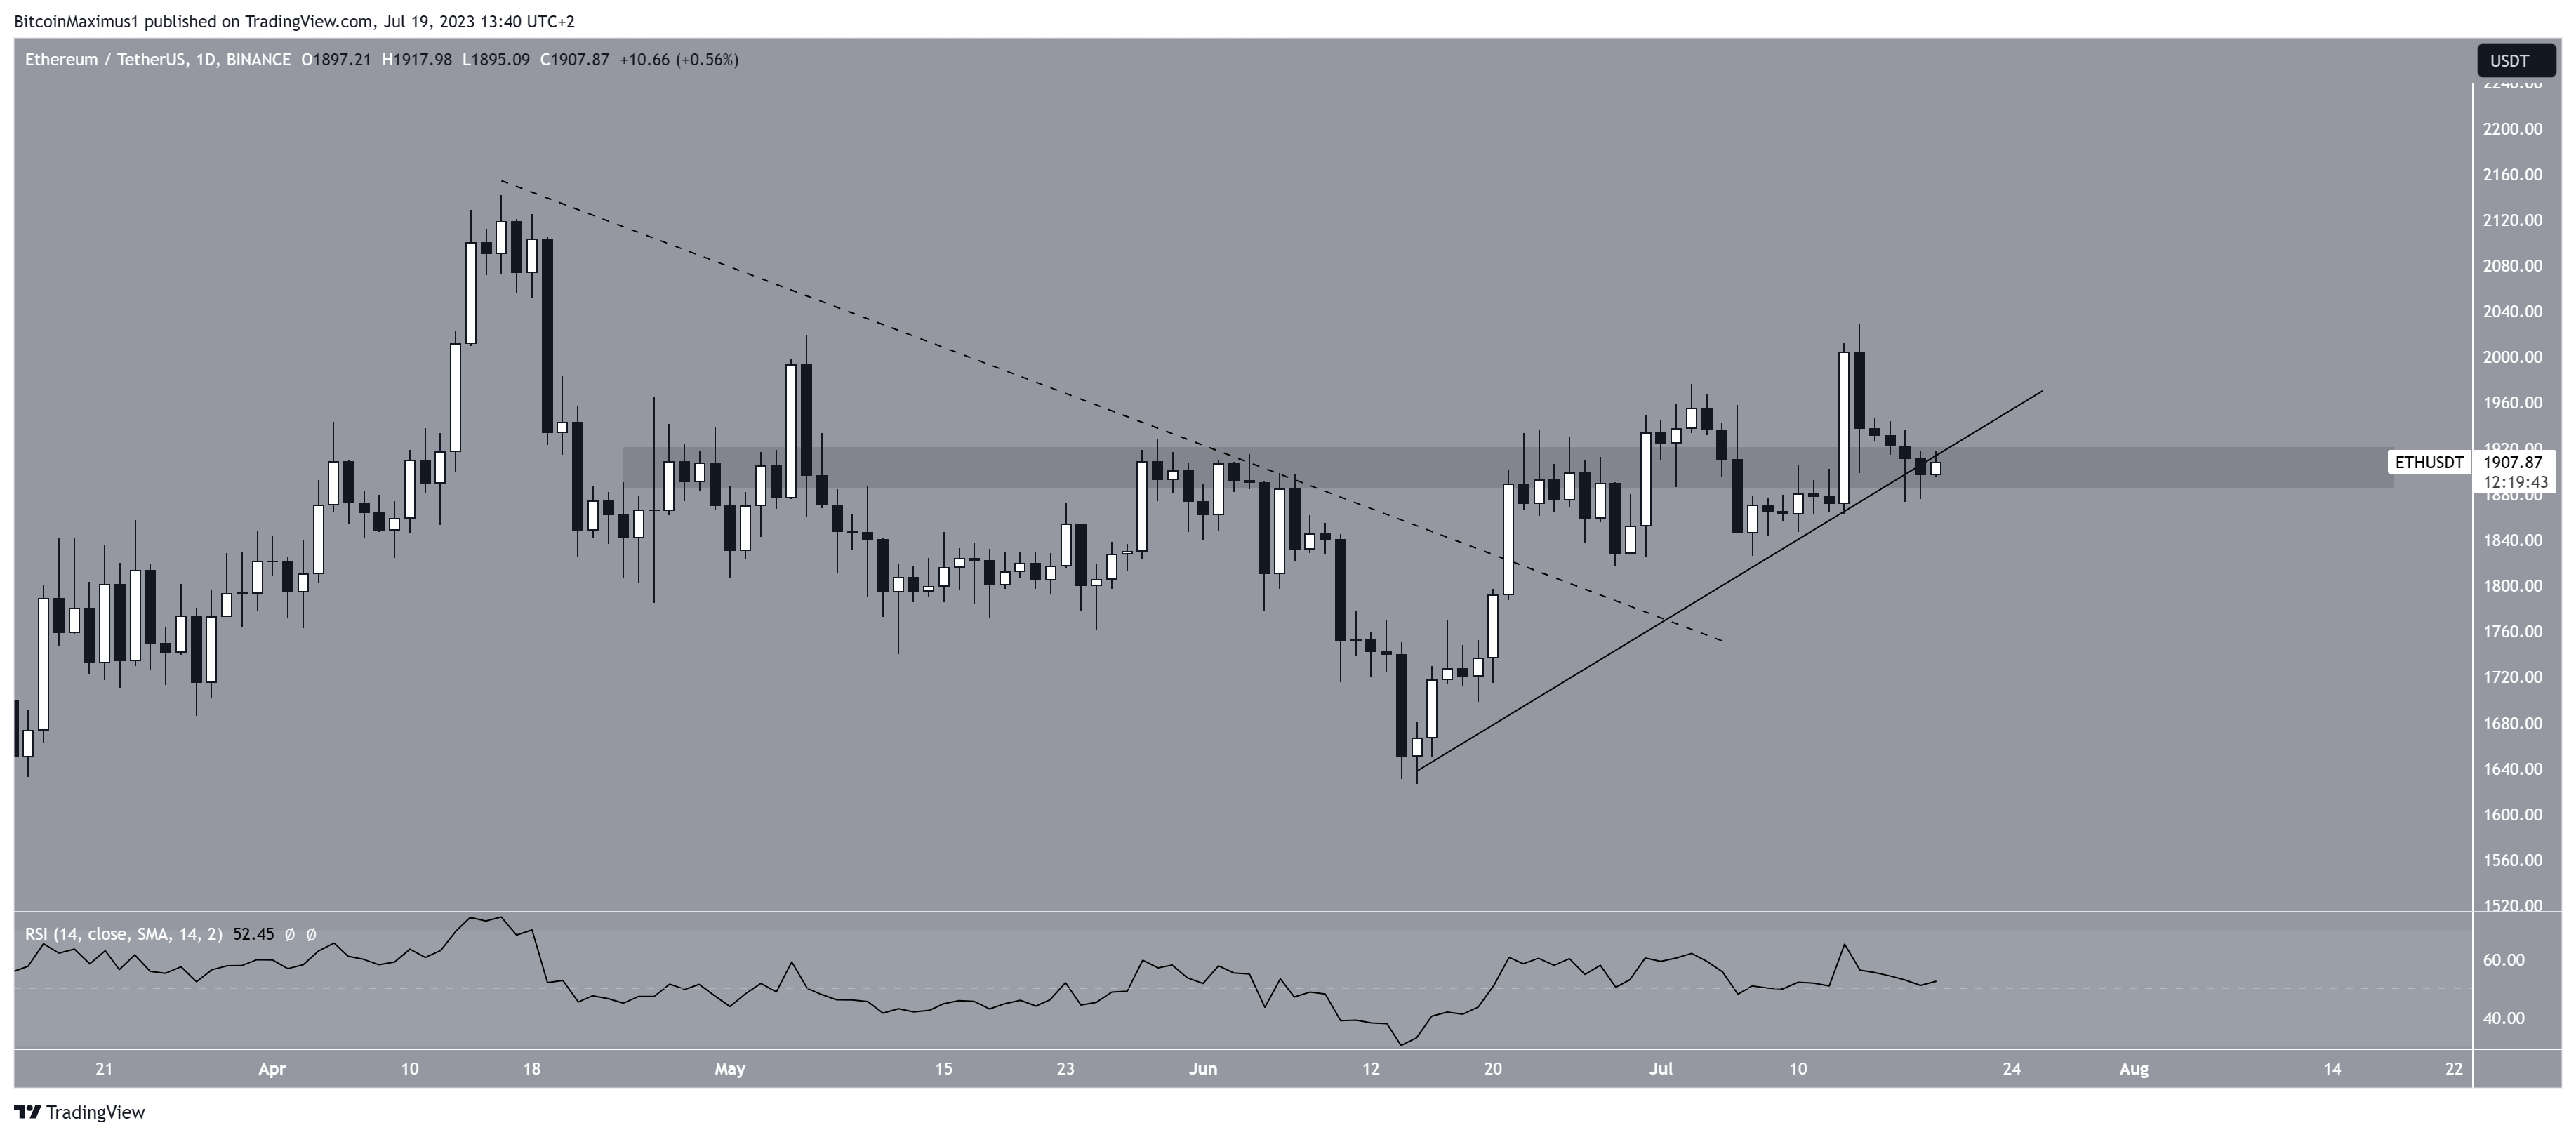
Technical indicator readings are bullish. The daily Relative Strength Index (RSI), which traders rely on to evaluate market conditions, provides a bullish reading.
When the RSI value is above 50 and shows an upward trend, it indicates a positive situation for bullish investors. Conversely, a value below 50 implies the opposite.
The RSI is currently increasing and is above 50, indicating that the direction of the trend is bullish
ETH Price Prediction: Breakdown or Bounce?
The technical analysis on the shorter-term six-hour time frame presents conflicting readings stemming from the price action and the Elliot Wave count.
According to the wave count, the ETH price appears to have completed a five-wave upward movement (white) between June 15 and July 3. It underwent a correction inside an A-B-C structure (black).
The correction’s containment within an ascending parallel channel makes this scenario quite probable. However, uncertainty remains regarding whether the correction is fully completed or if the ETH price will experience another decline.
Currently, waves A:C have shown an exact 1:1 ratio, suggesting that the correction might be finished. Nevertheless, if the price breaks down from the channel, it could lead to further decline, possibly reaching the $1,785 support, with waves A:C having a 1:1.61 ratio.
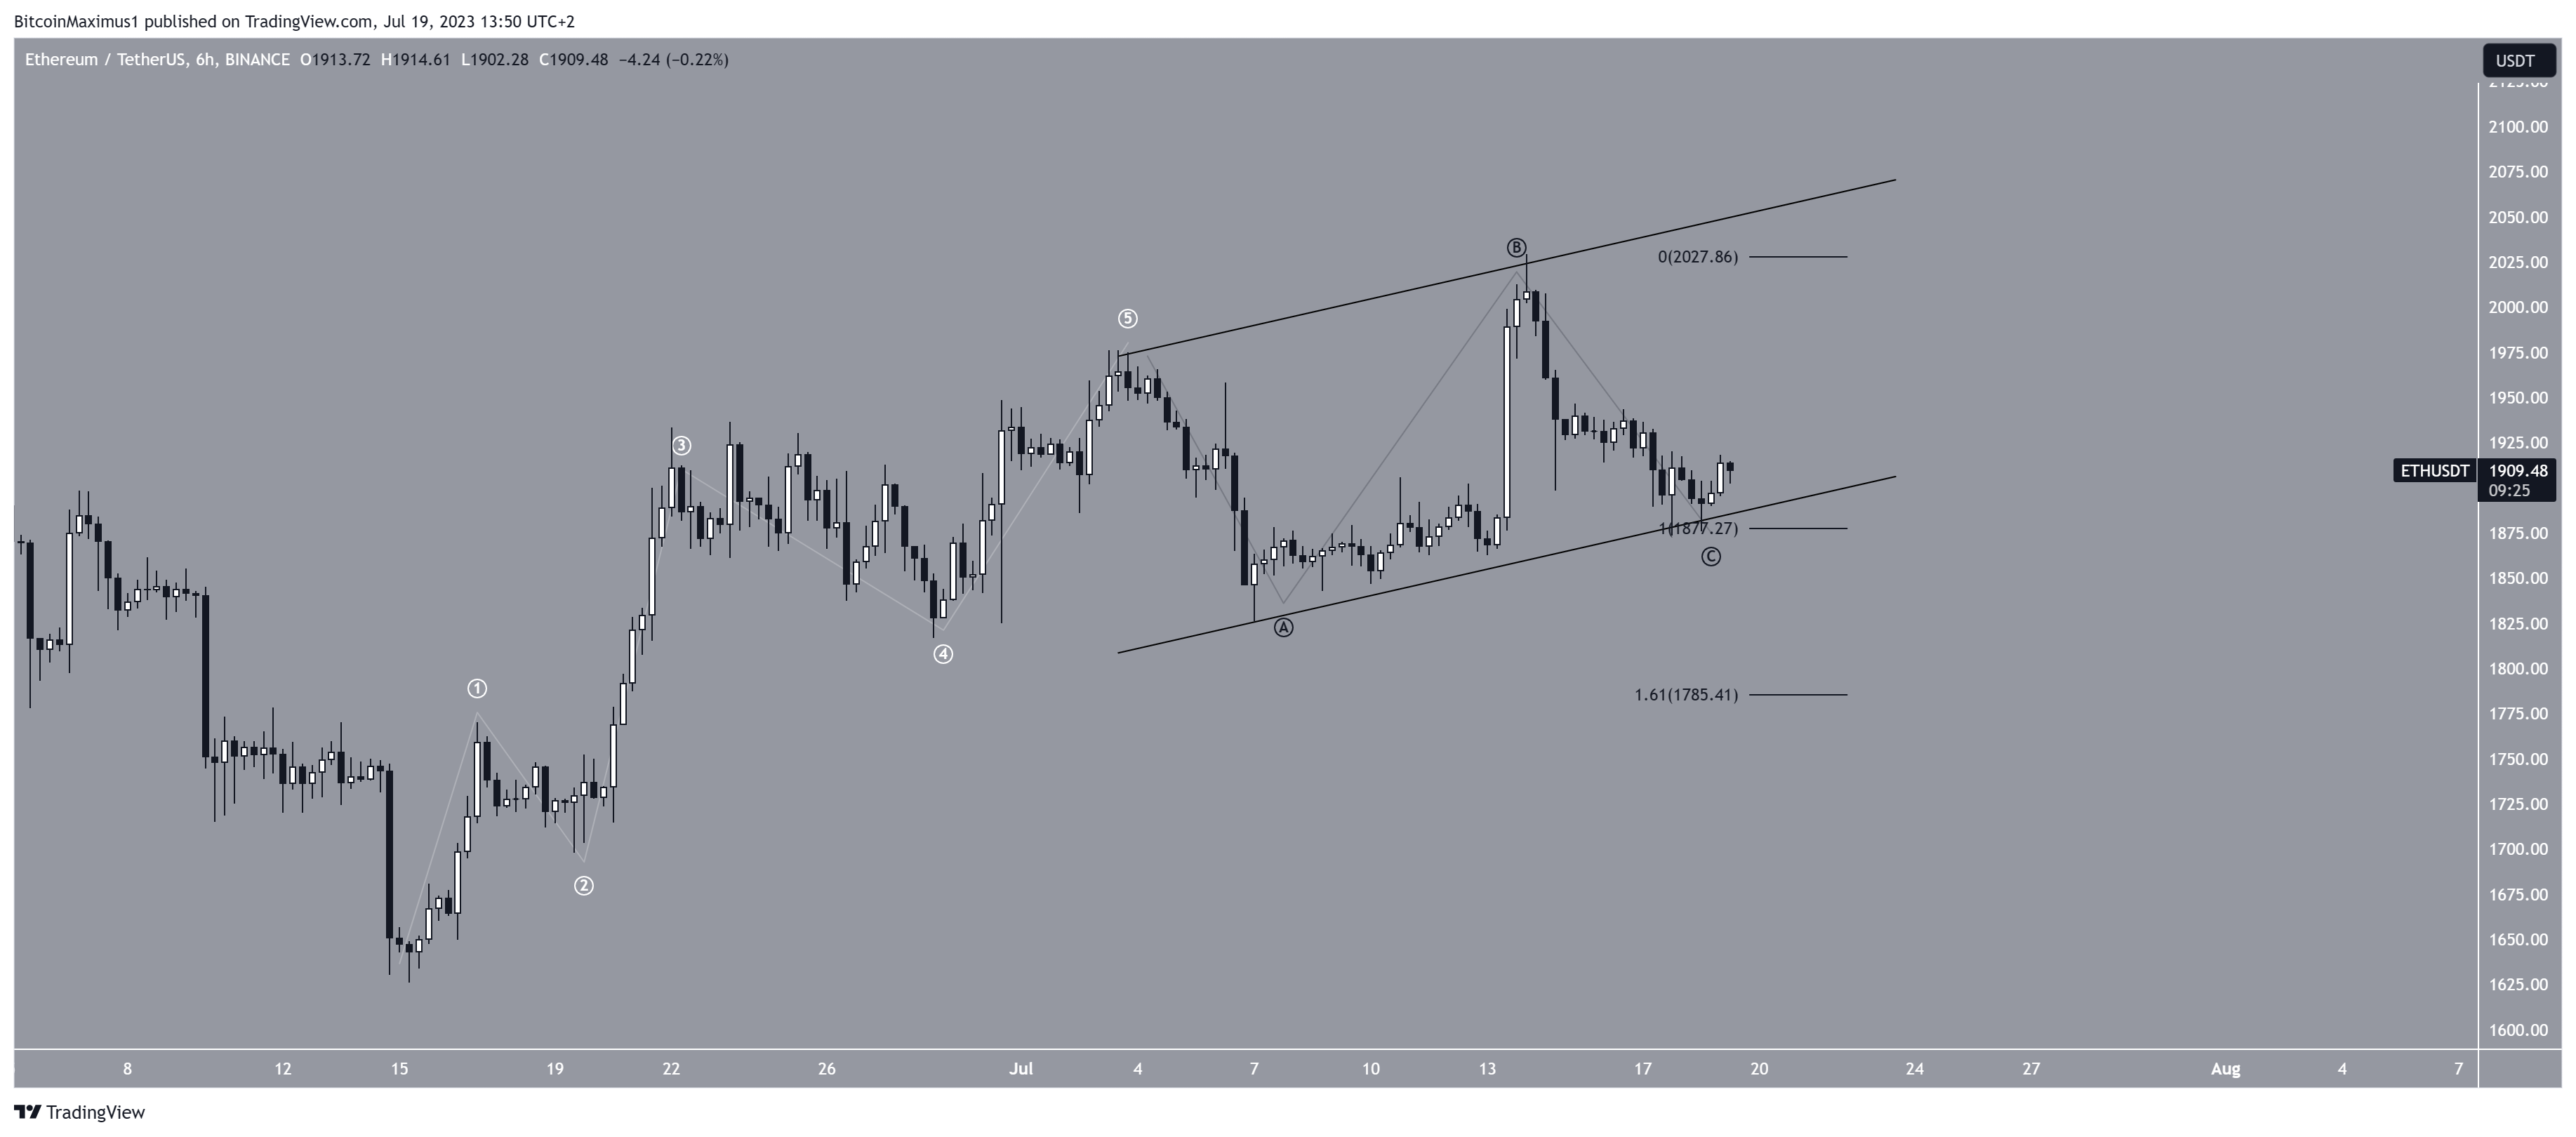
Consequently, the future ETH price prediction hinges on whether the token breaks down from the channel or experiences a bounce. In the event of a breakdown, ETH could drop to $1,790.
Conversely, if the price bounces, it could lead to a rise toward a new yearly high and potentially reach the next resistance at $2,500.
Read More: How To Make Money in a Bear Market
For BeInCrypto’s latest crypto market analysis, click here.
Disclaimer
In line with the Trust Project guidelines, this price analysis article is for informational purposes only and should not be considered financial or investment advice. BeInCrypto is committed to accurate, unbiased reporting, but market conditions are subject to change without notice. Always conduct your own research and consult with a professional before making any financial decisions. Please note that our Terms and Conditions, Privacy Policy, and Disclaimers have been updated.
