


The Ethereum (ETH) price has been on a downward trend since April when it moved above the $1,950 resistance area and then fell below it.
The readings from the weekly timeframe are decisively bearish, but the ones from the daily timeframe suggest that a bounce could occur soon.
Ethereum Price Deviation Leads to Decrease
The analysis of the weekly time frame gives a predominantly negative sentiment. The primary factor contributing to this outlook is the deviation (red circle) and subsequent decline below the resistance at $1,950. This downward shift is typically associated with substantial downward market movements.
This signifies that the buyers could not sustain the upward momentum, making the $1,950 threshold breakout illegitimate.
The price movement reinforced this bearish trend by affirming the $1,950 level as a resistance point at the start of July (red icon). This created a bearish candlestick.
If this downward trajectory persists, a long-standing ascending support line exists at $1,450. This line has been in effect since June 2022. A descent toward this level would equate to an 18% decrease.
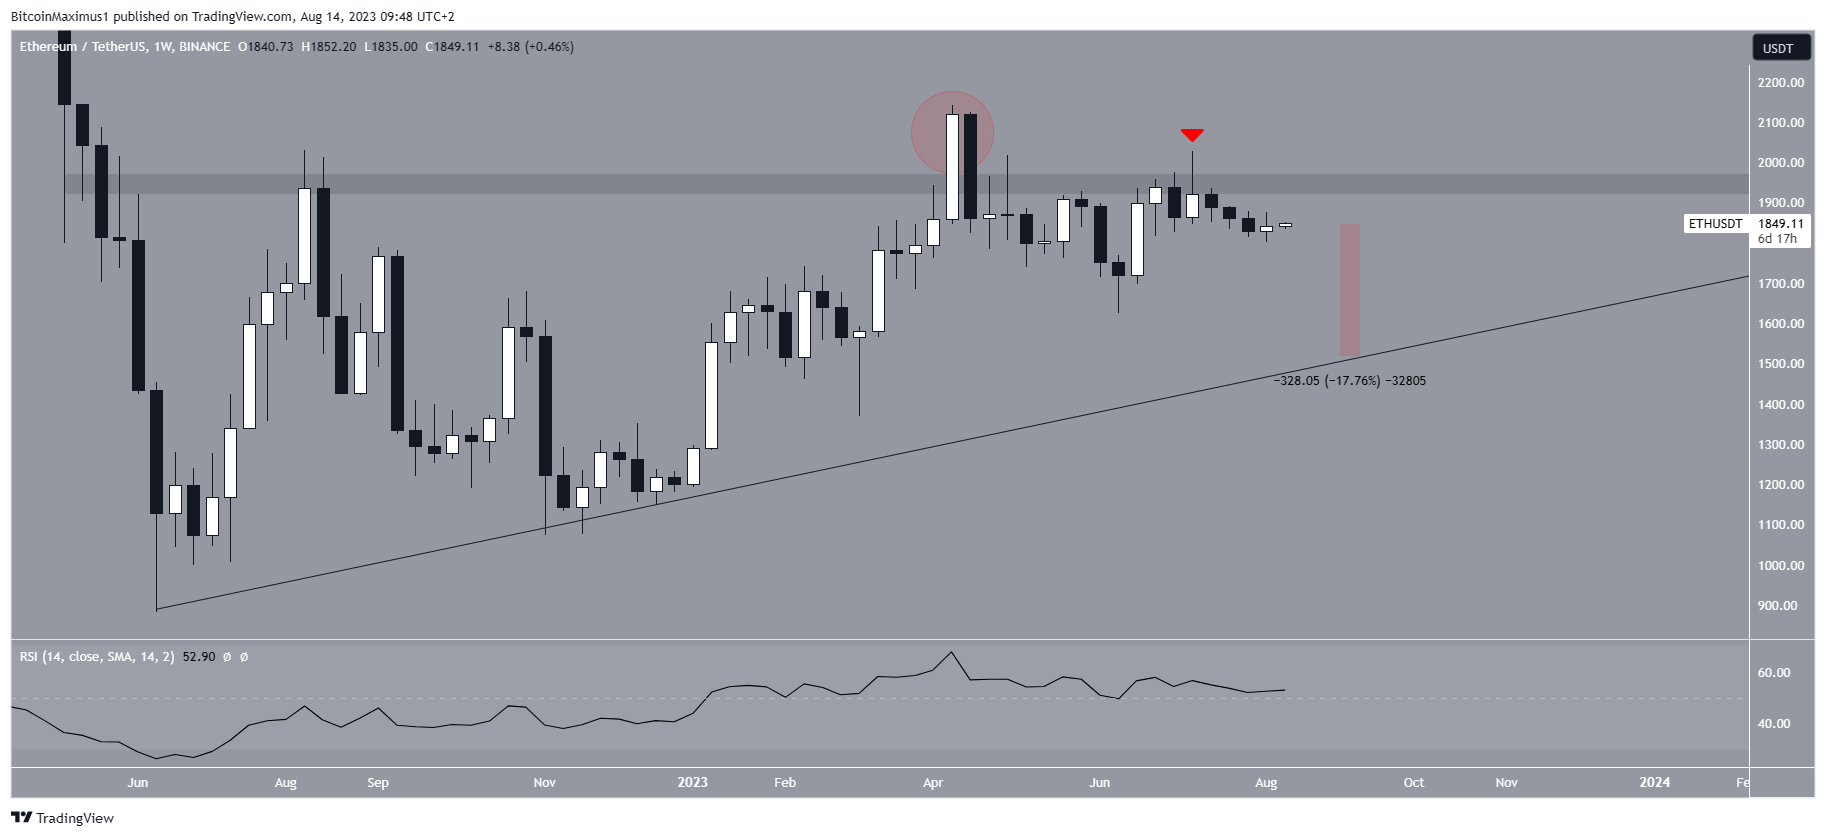
Despite the appearance of bearish price action, the weekly Relative Strength Index (RSI ) displays a somewhat bullish inclination. The RSI is a momentum gauge employed to identify overbought or oversold market conditions. Traders utilize it to make decisions about accumulating or divesting from an asset.
A rising trend and an RSI reading above 50 indicate that bullish forces are still in control, whereas readings below 50 suggest the opposite.
The RSI currently hovers just above 50 without displaying a definitive directional movement. This signifies a neutral trend, but the fact that the indicator remains above 50 leans towards a bullish stance.
Check out the 9 Best AI Crypto Trading Bots to Maximize Your Profits.
ETH Price Prediction: Bounce or Breakdown?
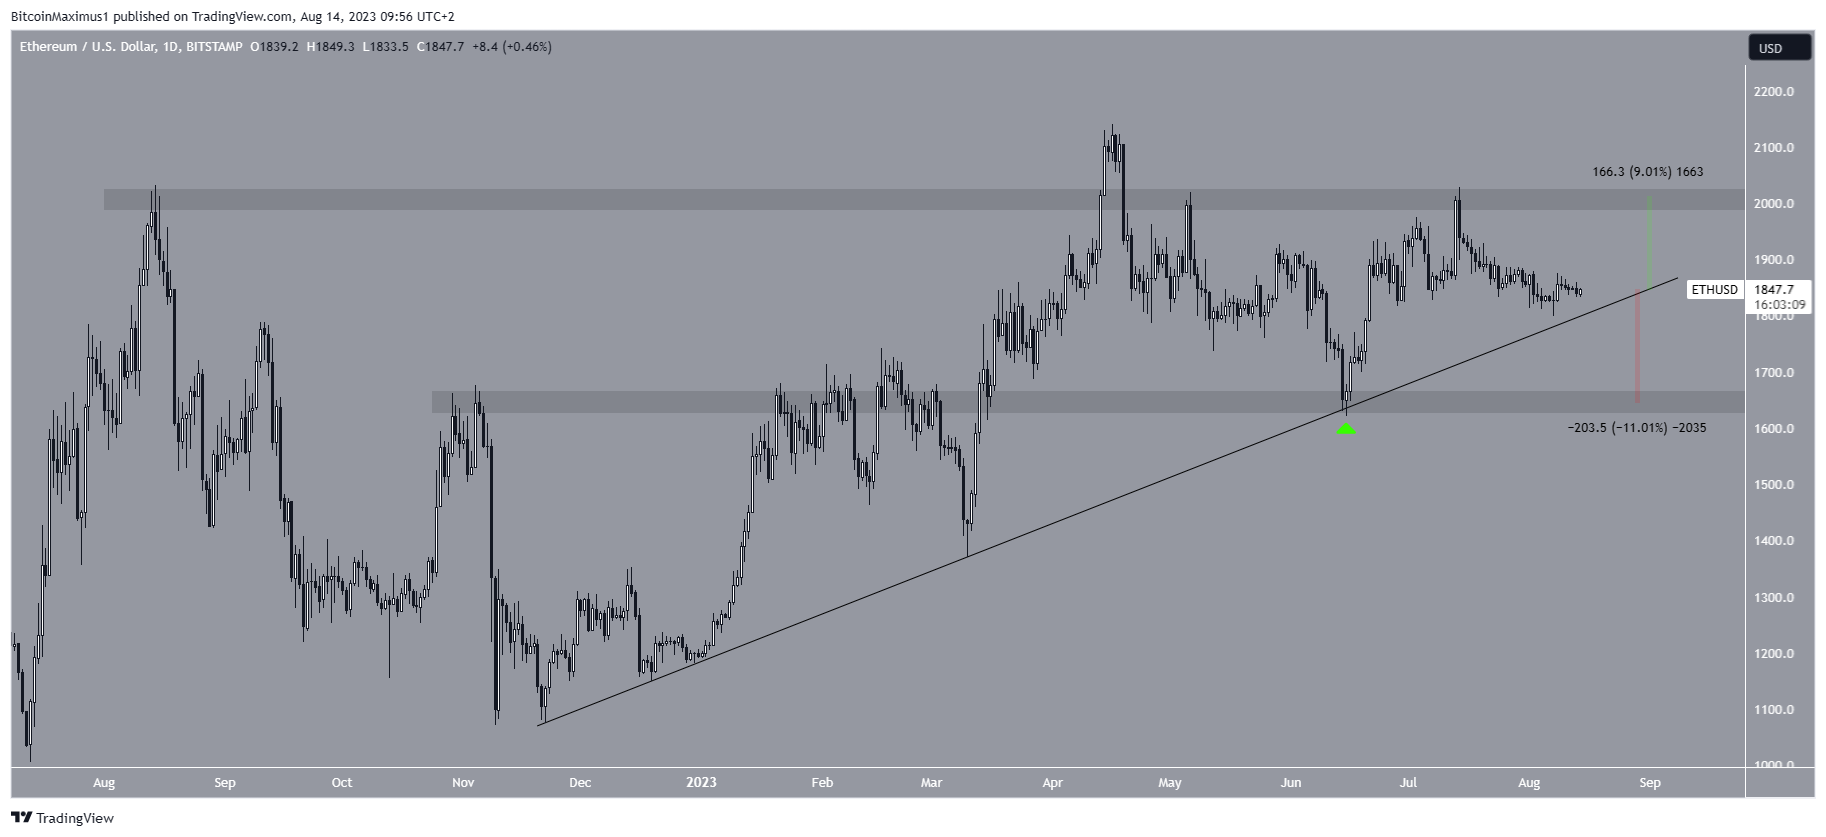
While the weekly timeframe is bearish, the daily timeframe provides a mostly neutral outlook. The price has followed a shorter-term ascending support line since December 2022. The line has been validated numerous times so far, most recently on June 15 (green icon). The bounce also validated the $1,650 area as support.
The ETH price is now approaching the ascending support line again. Whether it bounces or breaks down will be crucial in determining the future trend’s direction. A bounce can lead to a 9% increase toward the $2,000 resistance, while a breakdown will likely cause an 11% drop to the $1,650 support.
Since the resistance is very close to the $1,950 long-term resistance, a decisive close above it will be required to confirm the bullish trend reversal.
Therefore, the ETH price prediction will determine whether Ethereum bounces at the ascending support line or breaks down from it.
A bounce will likely lead to another test of the $2,000 resistance area, while a breakdown could lead to a price drop to $1,650.
Looking to be profitable? Learn How To Make Money in a Bear Market.


