

On January 5, 2019, the Ethereum price reached a high of ₿0.0419. A gradual decrease ensued. Since then, the price has created several lower highs and lows.
 At the time of writing, the ETH price was trading near ₿0.027.
Where will it go next? Keep reading below and find out.
For our previous analysis, click here.
If you are interested in trading Ethereum on our partner exchange, follow this link to get signed up on XCOEX.
At the time of writing, the ETH price was trading near ₿0.027.
Where will it go next? Keep reading below and find out.
For our previous analysis, click here.
If you are interested in trading Ethereum on our partner exchange, follow this link to get signed up on XCOEX.
Ethereum Price: Trends and Highlights for June 2
- ETH/BTC is trading inside a descending channel.
- It is following a short-term ascending support line.
- Daily moving averages have made several bearish crosses.
- The ETH price is in a long-term support area.
- A significant bullish divergence has been created in the RSI and the MACD.
Ethereum Price in a Descending Channel
The price of ETH is analyzed at daily intervals from Dec 2018 to July 2019.
On January 5, 2019, the Ethereum price reached a high of ₿0.0419. A gradual decrease ensued, which is still continuing at the time of writing.
During this period, the price has been trading inside the ascending channel outlined below.
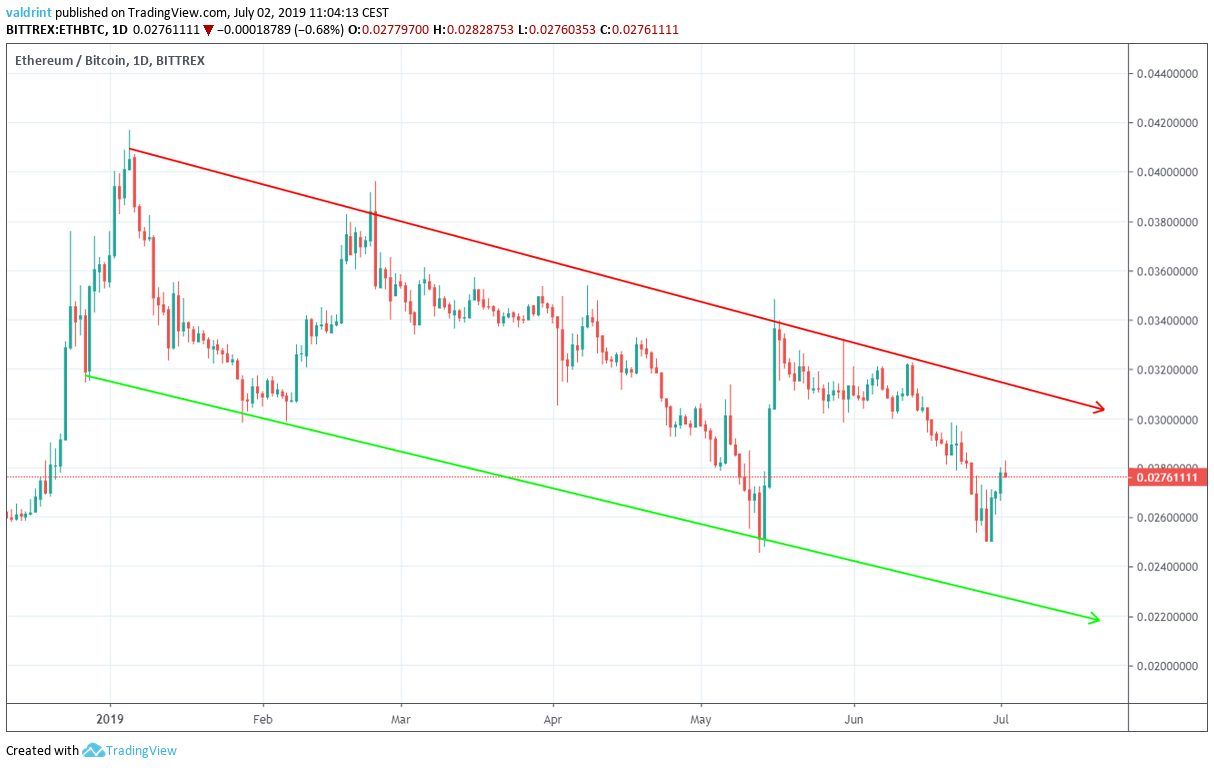 At the time of writing, it was trading in the middle of the channel, after several unsuccessful attempts at a breakout in May/June.
The resistance line is currently near ₿0.030.
In the short-term, the ETH price recently broke out from an ascending triangle.
At the time of writing, it was trading in the middle of the channel, after several unsuccessful attempts at a breakout in May/June.
The resistance line is currently near ₿0.030.
In the short-term, the ETH price recently broke out from an ascending triangle.
 It is currently following a very steep resistance line, and has met resistance slightly above ₿0.028.
To conclude, while the ETH price is currently heading for the resistance line of the channel, there is still significant resistance left to clear before it gets there.
It is currently following a very steep resistance line, and has met resistance slightly above ₿0.028.
To conclude, while the ETH price is currently heading for the resistance line of the channel, there is still significant resistance left to clear before it gets there.
Technical Indicators
The price of ETH is analyzed alongside the 10-, 20-, 100- and 200-period moving averages (MA) in order to determine the current trend.
The daily moving averages show that as evidenced by the descending channel, the ETH price is currently in a downtrend.
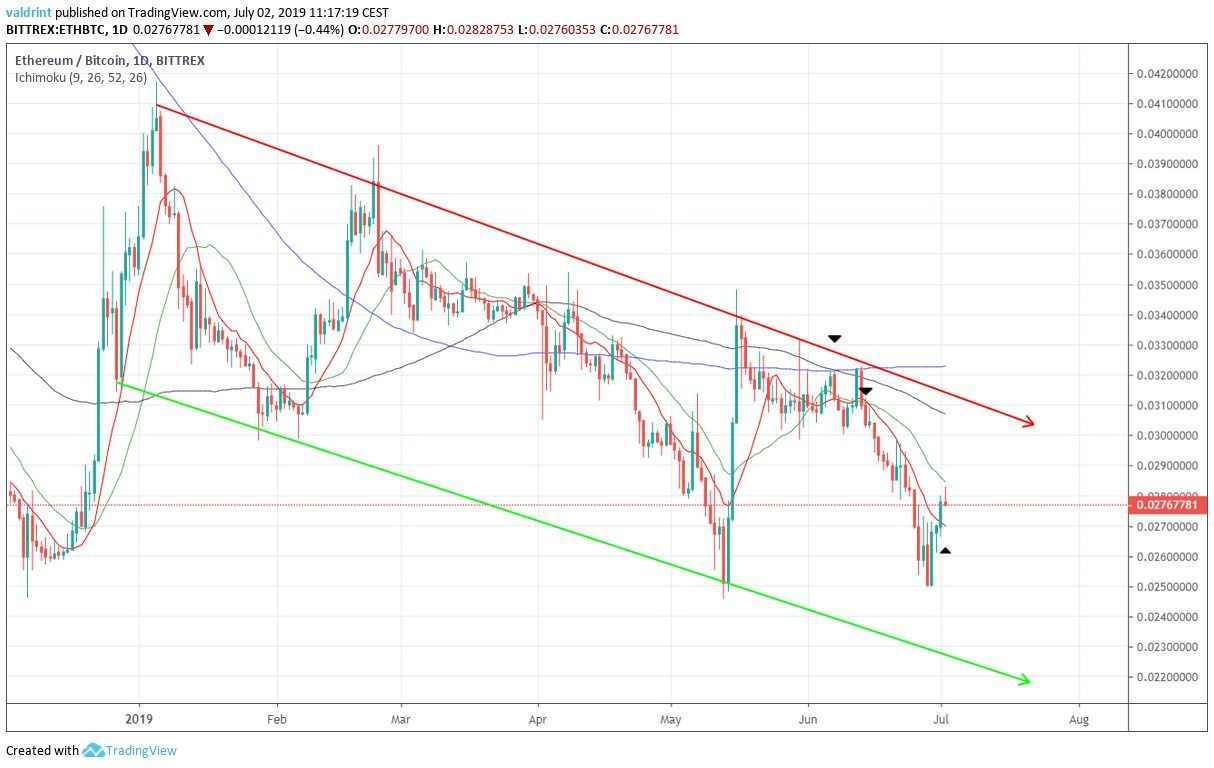 On June 5, a bearish cross occurred between the 100- and 200- period moving averages.
The 10- and 20-period MAs followed suit shortly after.
This means that the Ethereum price is likely in a downtrend.
In a more positive note, the recent increase took the price above the 10-period MA. However, it was unsuccessful in increasing above the 20-period one.
On June 5, a bearish cross occurred between the 100- and 200- period moving averages.
The 10- and 20-period MAs followed suit shortly after.
This means that the Ethereum price is likely in a downtrend.
In a more positive note, the recent increase took the price above the 10-period MA. However, it was unsuccessful in increasing above the 20-period one.
Long-Term
The price of ETH is analyzed at weekly intervals from July 2017 to July 2019 alongside the RSI.
On December 2017, the price of ETH reached a low near ₿0.025. A massive upward move began, which was followed by a decrease.
 The ETH price has visited this level four other times.
Every time, the RSI and the MACD have generated a higher high. This is known as bullish divergence and often precedes price increases.
The divergence is significant in value, occurring in both indicators and in a weekly time-frame, which is not a common occurrence.
Furthermore, it is appearing at a significant support level.
This makes it an ideal place for the beginning of another upward move.
The ETH price has visited this level four other times.
Every time, the RSI and the MACD have generated a higher high. This is known as bullish divergence and often precedes price increases.
The divergence is significant in value, occurring in both indicators and in a weekly time-frame, which is not a common occurrence.
Furthermore, it is appearing at a significant support level.
This makes it an ideal place for the beginning of another upward move.
Summary
The price of Ethereum has fallen to a major support level. This level has not been broken in almost two years. Furthermore, long-term technical indicators show that there is potential for the beginning of an upward move. In a shorter term time-frame, the Ethereum price is trading inside a descending channel and has done so since the beginning of 2019. Do you think the price of Ethereum will begin an upward move? Let us know in the comments below.Disclaimer: This article is not trading advice and should not be construed as such. Always consult a trained financial professional before investing in cryptocurrencies, as the market is particularly volatile. Images are courtesy of Shutterstock, TradingView.
Disclaimer
In line with the Trust Project guidelines, this price analysis article is for informational purposes only and should not be considered financial or investment advice. BeInCrypto is committed to accurate, unbiased reporting, but market conditions are subject to change without notice. Always conduct your own research and consult with a professional before making any financial decisions. Please note that our Terms and Conditions, Privacy Policy, and Disclaimers have been updated.

Valdrin Tahiri
Valdrin discovered cryptocurrencies while he was getting his MSc in Financial Markets from the Barcelona School of Economics. Shortly after graduating, he began writing for several different cryptocurrency related websites as a freelancer before eventually taking on the role of BeInCrypto's Senior Analyst.
(I do not have a discord and will not contact you first there. Beware of scammers)
READ FULL BIO
Sponsored
Sponsored