
Ethereum (ETH) price has remained in a consolidation phase, trading below $3,000 since February 2. Over the past weeks, indicators like RSI, DMI, and EMA suggest that ETH lacks strong momentum, with neither buyers nor sellers taking full control.
The narrowing gap between its EMA lines hints at a potential shift, but ETH must overcome key resistance levels to regain bullish momentum. Meanwhile, if support levels fail to hold, a deeper correction toward $2,160 could be on the table.
Ethereum RSI Has Been Neutral For Two Weeks
Ethereum Relative Strength Index (RSI) is currently at 54.2, staying neutral since February 3. RSI measures price momentum, with values between 30 and 70 indicating a balanced market.
Ethereum has remained within this range, suggesting neither buyers nor sellers have taken control. This means ETH has yet to enter an overbought zone above 70 or an oversold zone below 30.
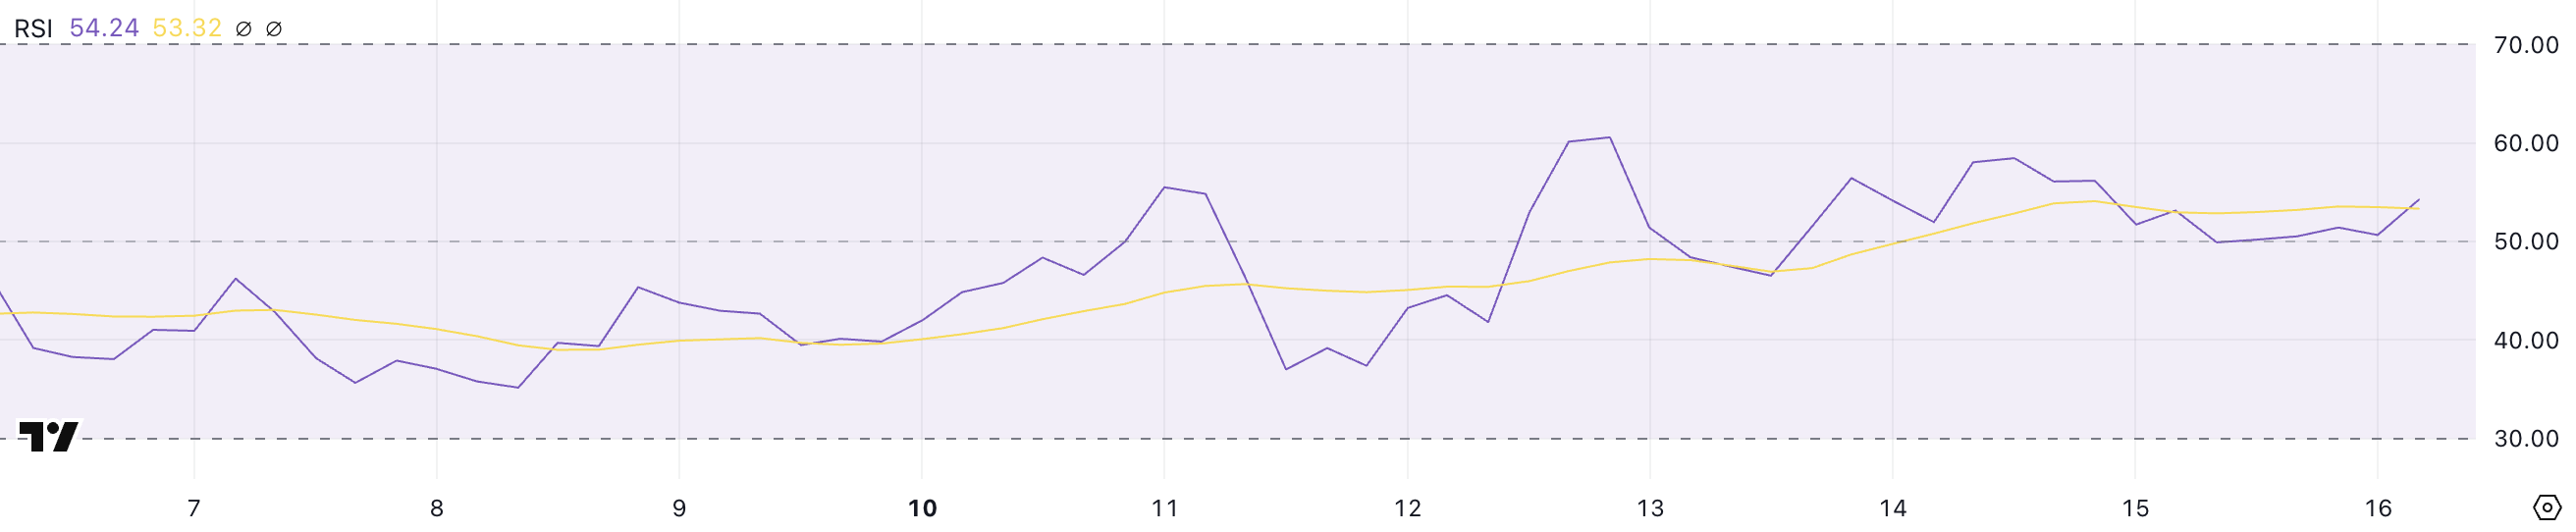
RSI ranges from 0 to 100, with key levels at 30 and 70. A reading above 70 signals overbought conditions, while below 30 suggests oversold levels. At 54.2, ETH is in neutral territory, meaning price action lacks strong momentum.
For ETH price to reach $3,000, the RSI would likely need to move toward 60 or higher, indicating increased buying pressure. A push above 70 could signal strong bullish momentum, helping ETH break key resistance levels.
ETH DMI Shows the Lack of a Clear Direction
Ethereum Directional Movement Index (DMI) shows its Average Directional Index (ADX) at 11.8, steadily declining since February 12, when it was at 32.8.
ADX measures trend strength, with values above 25 indicating a strong trend and below 20 suggesting a weak or no trend. The steady decline signals fading momentum, meaning ETH lacks a clear directional push.
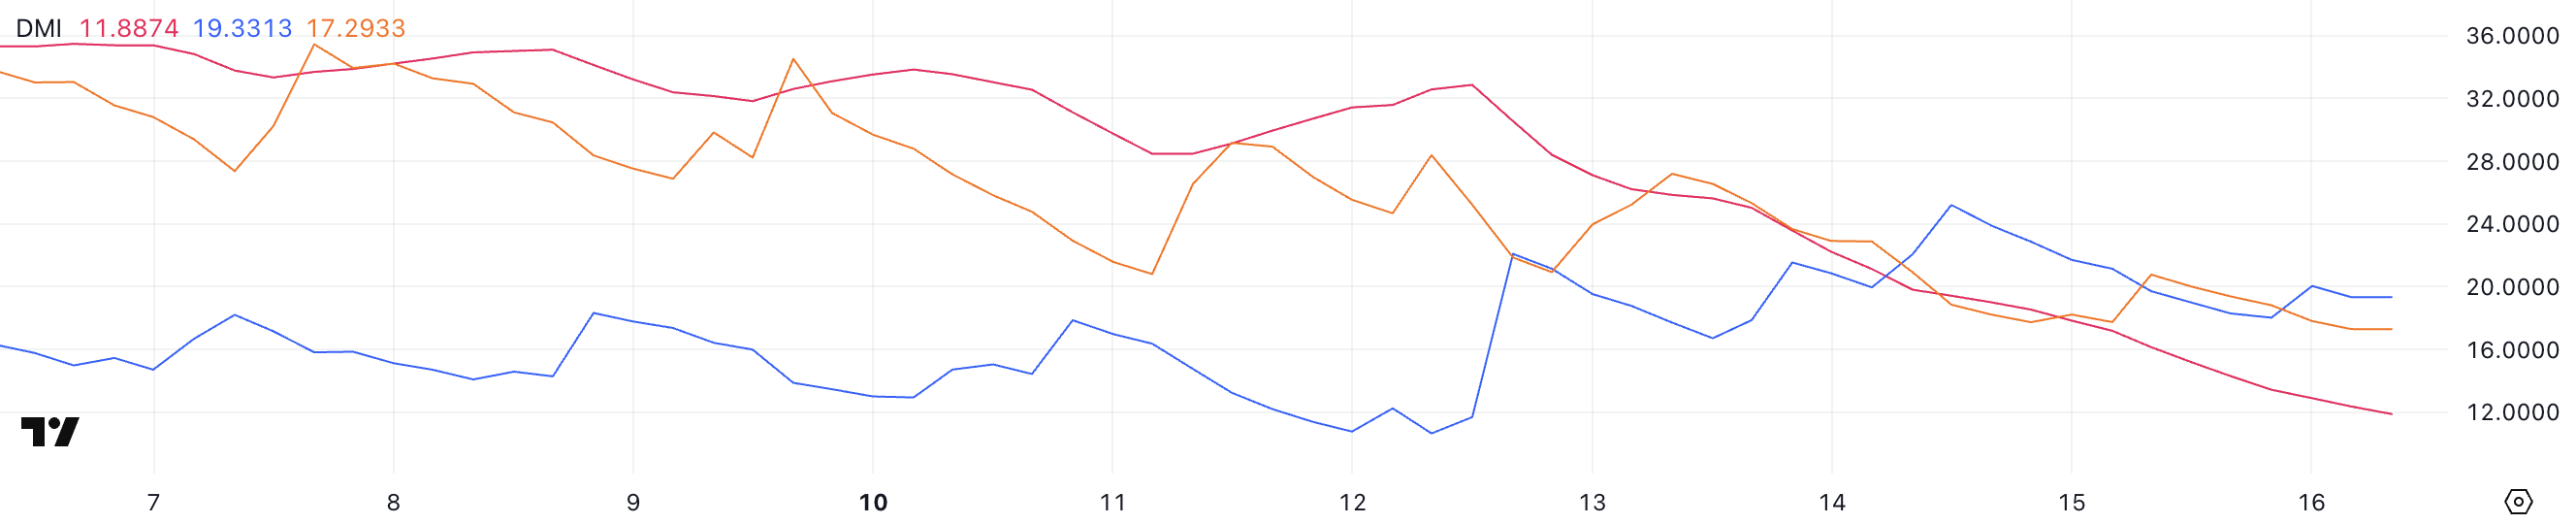
ADX is part of the DMI, which also includes the +DI (positive directional indicator) and -DI (negative directional indicator). +DI is at 19.3, down from 25.2 two days ago, while -DI is at 17.2, down from 18.8.
This suggests both bullish and bearish pressures are weakening. For ETH to regain $3,000, ADX would need to rise above 20, signaling stronger trend momentum, while +DI would have to climb above -DI with a wider gap, indicating renewed bullish strength.
ETH Price Prediction: Will Ethereum Return To $3,000 In February?
Ethereum price has been trading between $2,800 and $2,550 since February 7. Its EMA lines still show a bearish outlook, as short-term lines remain below long-term ones.
However, the gap between them is narrowing, suggesting a potential shift in momentum. For ETH to reach $3,000 in February, it must first break the $2,800 resistance and then sustain a move above $3,020. If momentum strengthens, ETH could even test $3,442, a level last seen in late January.
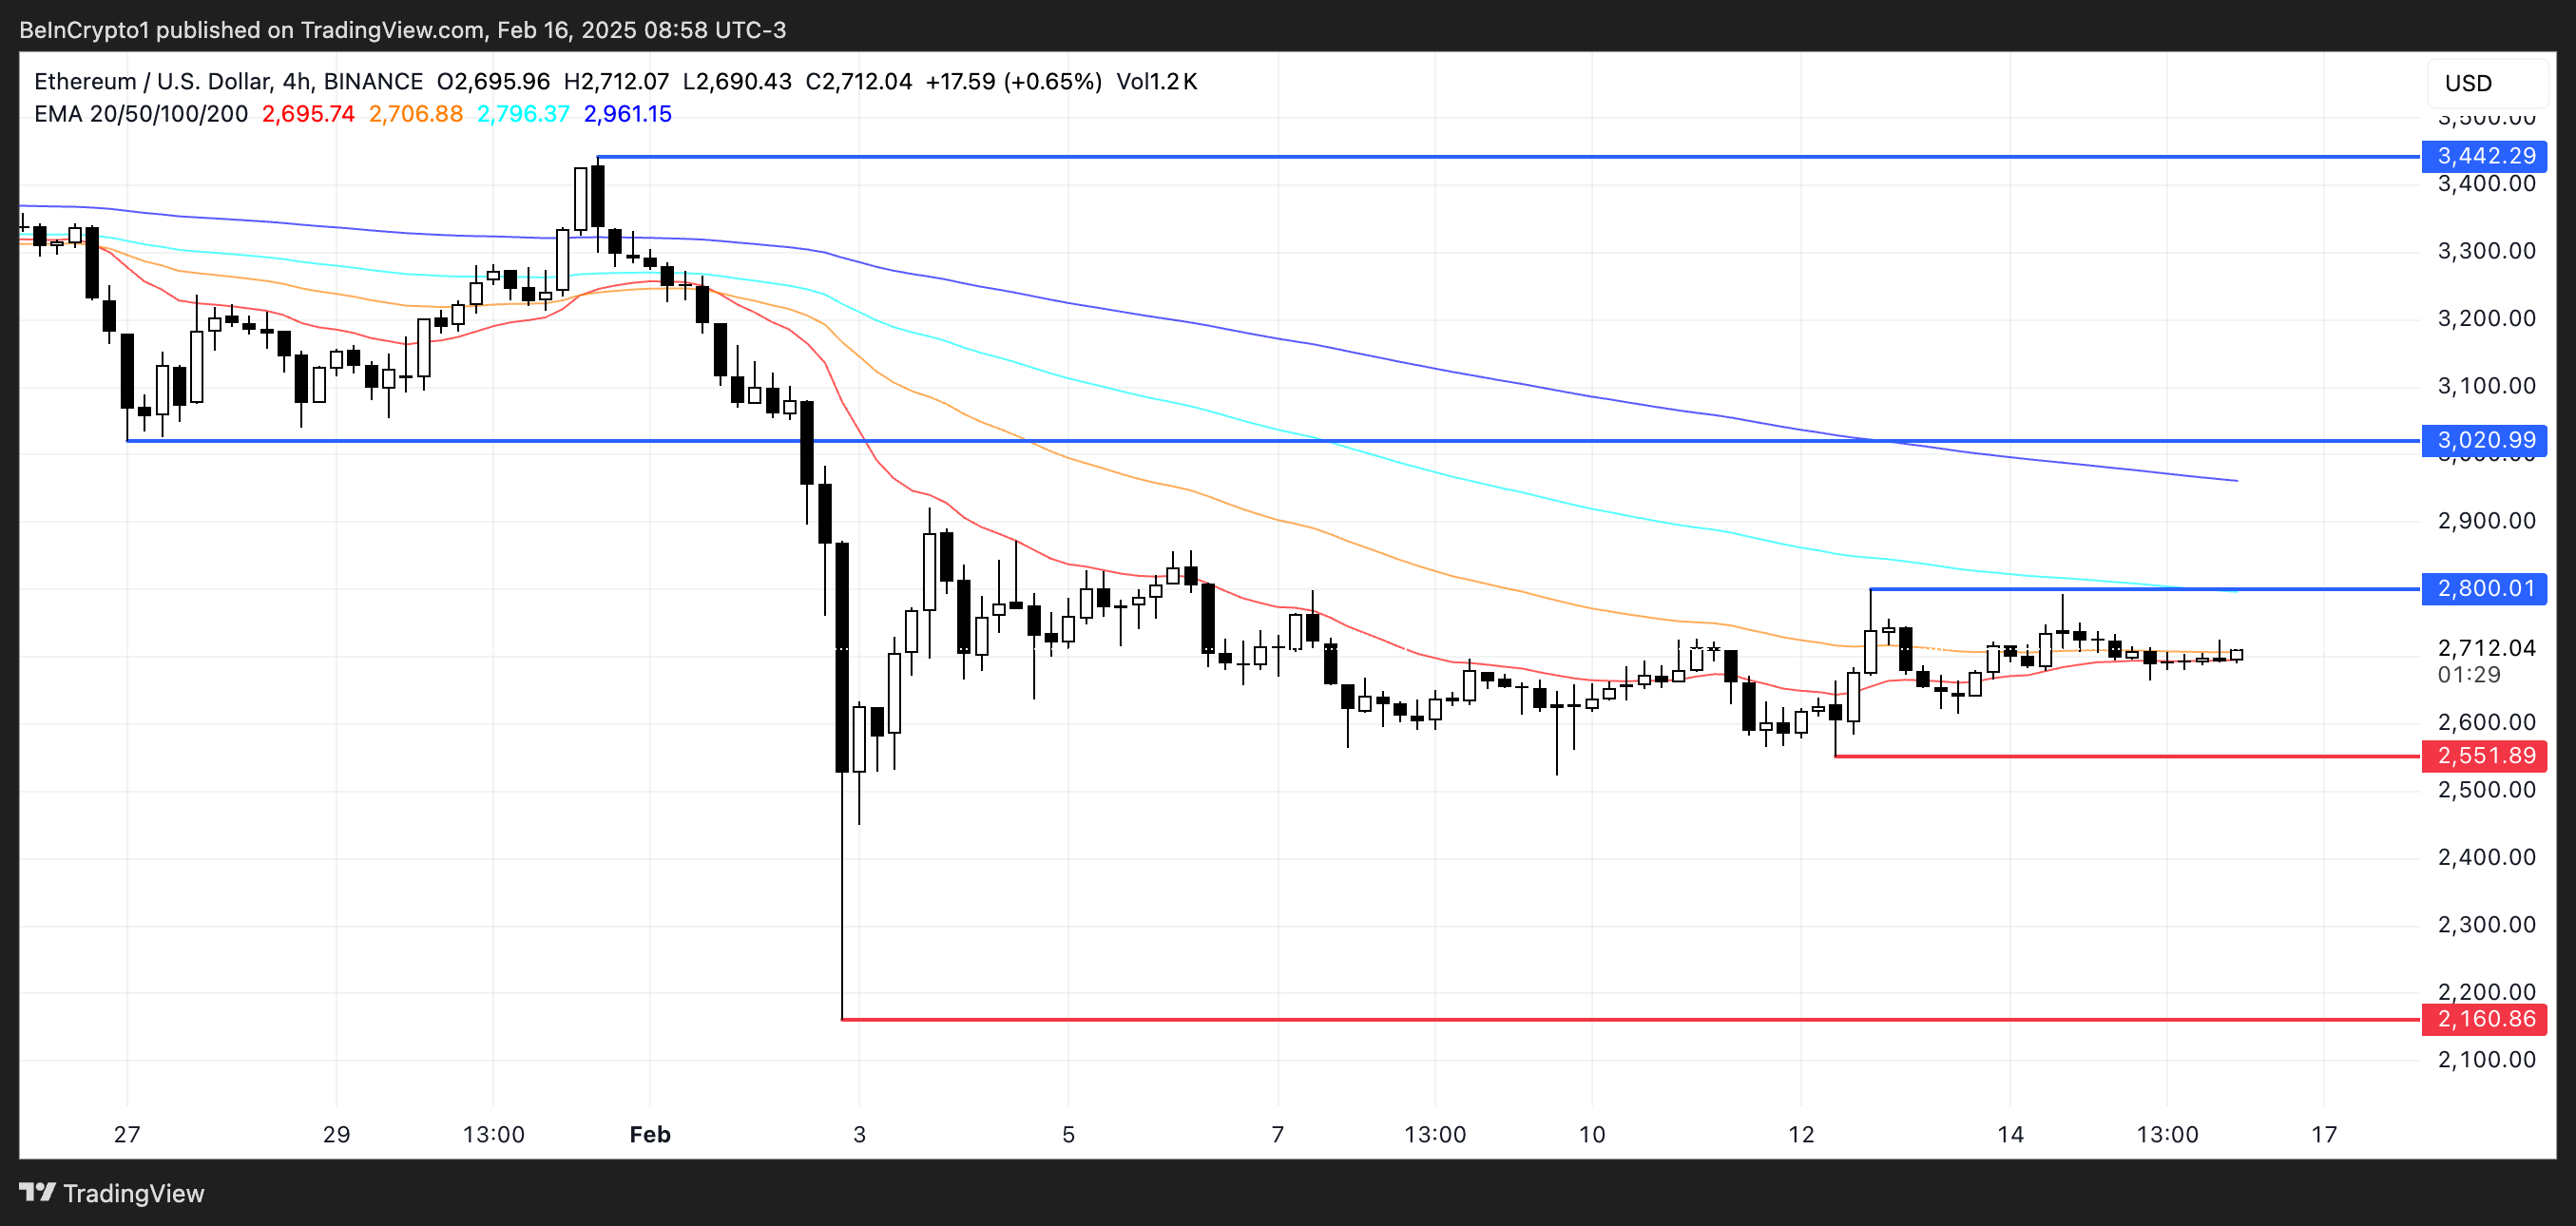
On the downside, if Ethereum retests the $2,551 support and fails to hold, further declines could follow.
Losing this key level may open the door for a drop toward $2,160, a significantly lower support.
