


Since breaking down from a long-term consolidation pattern, Ethereum (ETH) has struggled to sustain an upward movement and create a bullish structure.
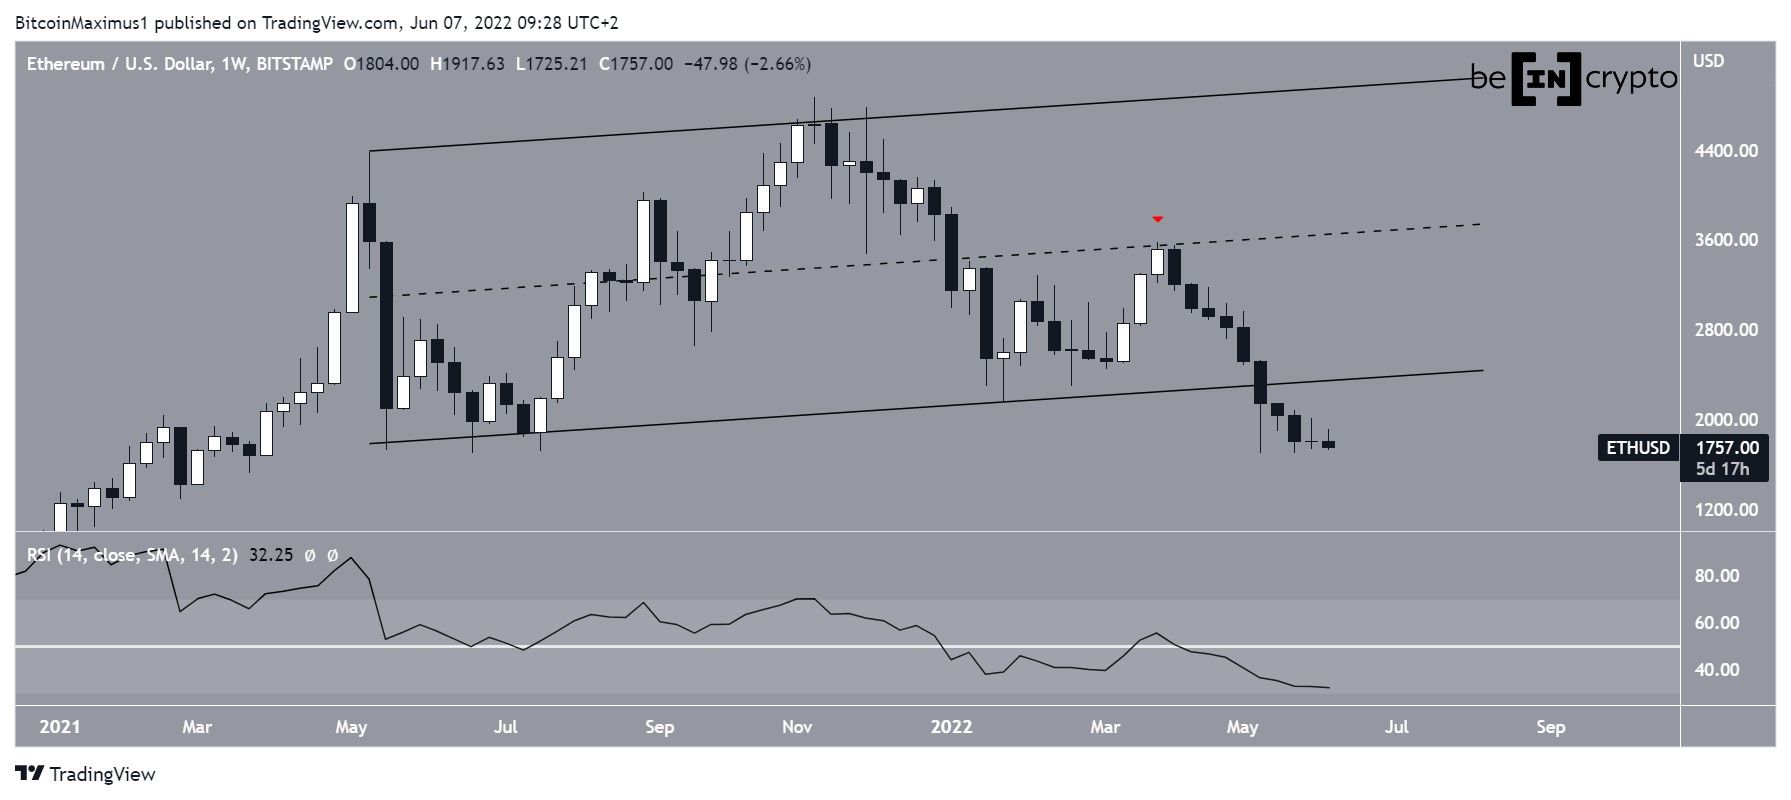
ETH has been falling since reaching an all-time high price of $4,868 in Nov. After bouncing this Jan, the price created a lower high in March (red icon) and has been falling at an accelerated rate since.
The downward movement has so far led to a low of $1,700 on May 12.
An important development is that the price has broken down from an ascending parallel channel which had previously been in place since May 2021. A breakdown from such a long-term structure could cause a similarly long-term drop.
Furthermore, the RSI has decreased below 50, in what is considered a sign of a bearish trend.
Mixed readings
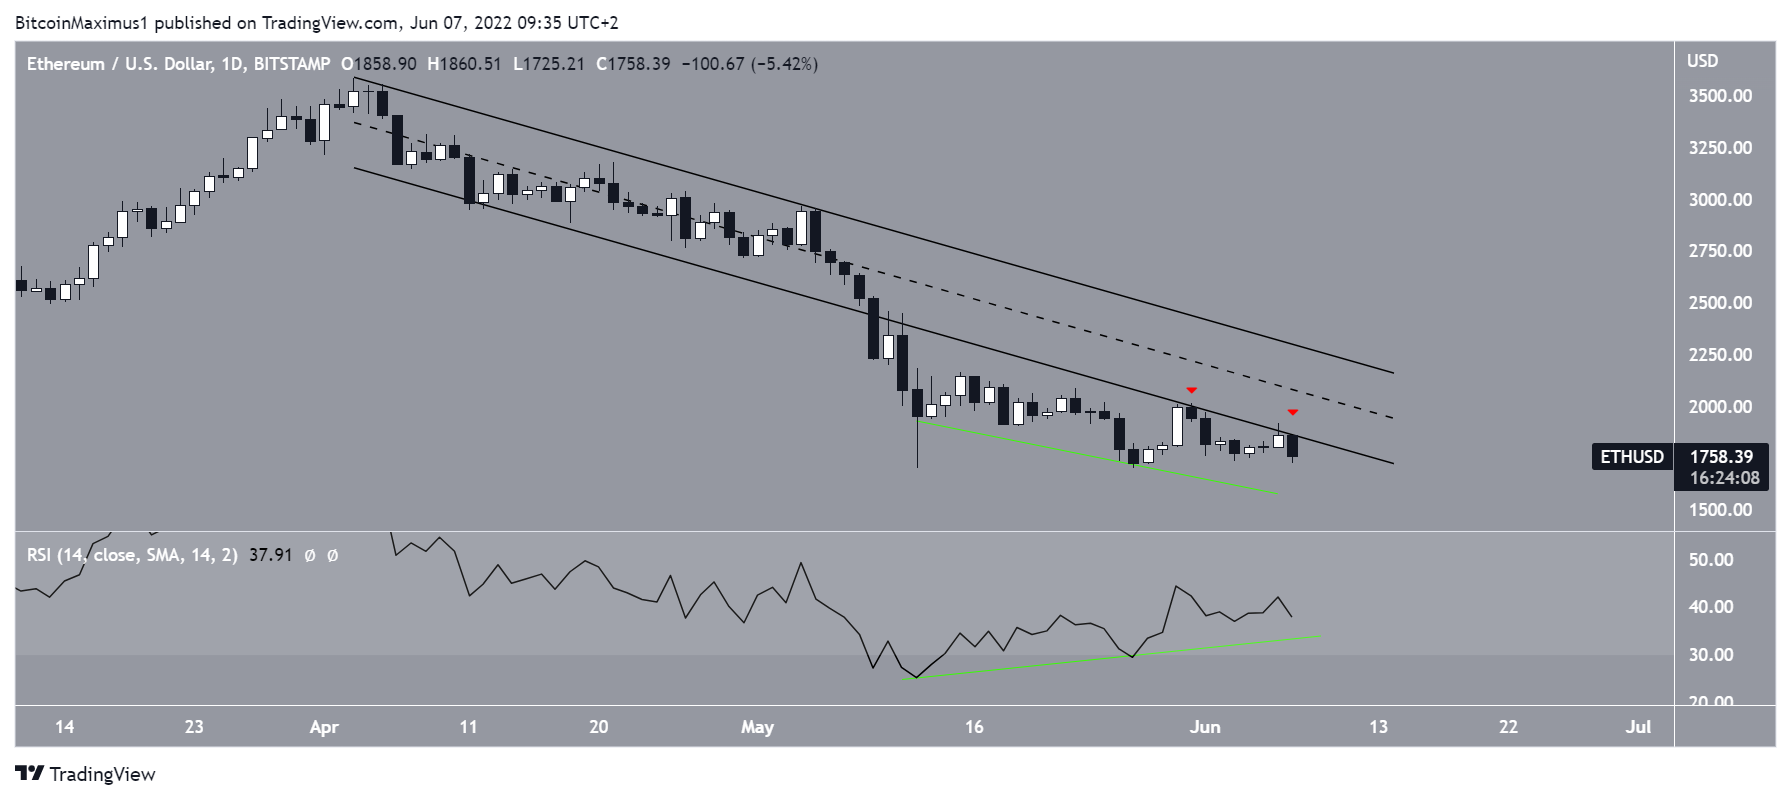
The daily chart provides a mixed outlook. On May 8, the price broke down from a descending parallel channel.
Afterward, it validated it as resistance twice, more specifically on May 31 and June 7 (red icons).
However, the RSI has generated a bullish divergence (green line), whose trendline is still intact.
So, while the price action is bearish, the readings from the RSI are bullish.
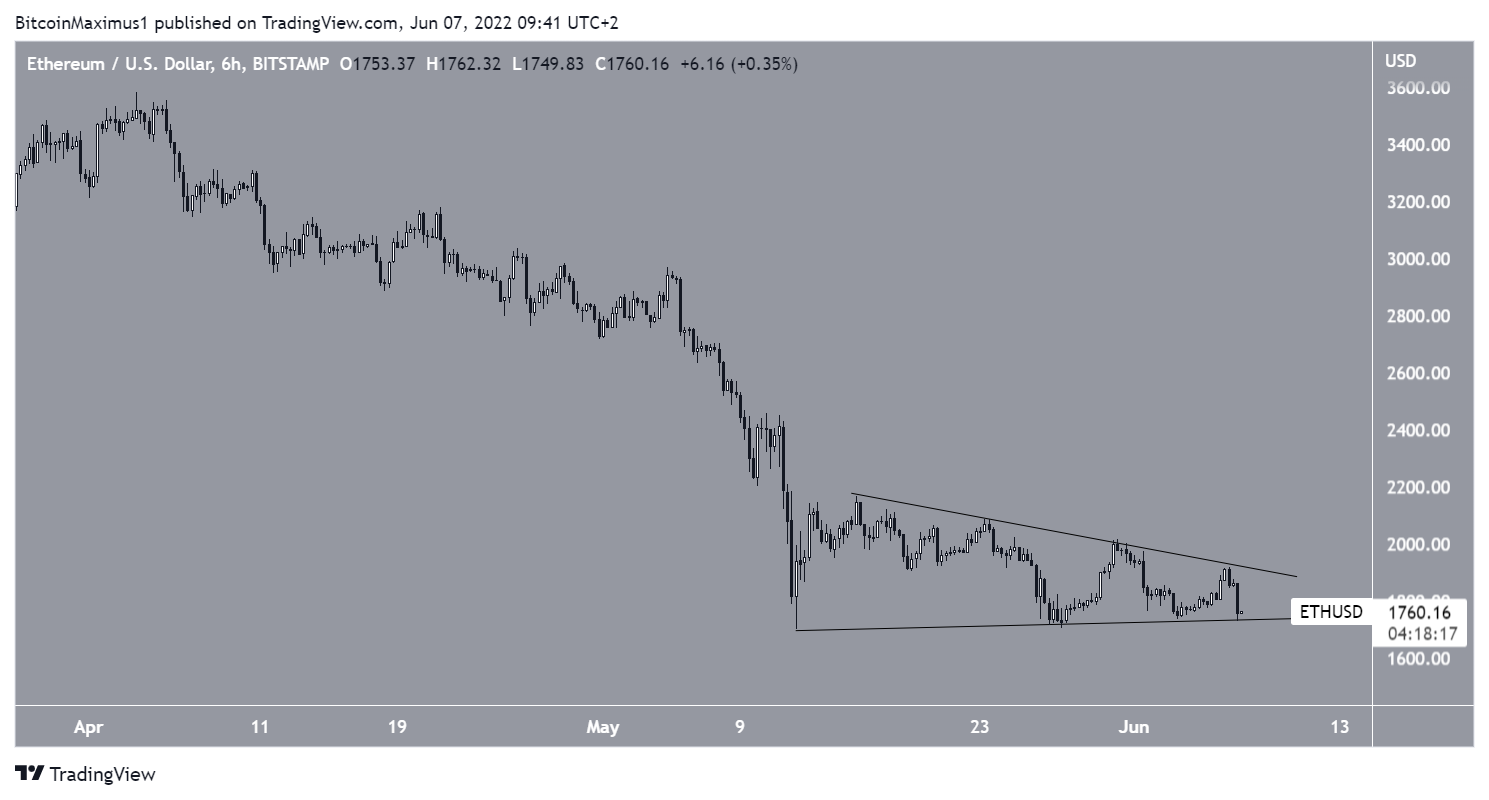
A closer look at the six-hour time frame shows that ETH is trading inside a symmetrical triangle. While this is considered a neutral pattern, it is occuring after a downward movement.
As a result, it is possible that it will lead to the continuation of the downward movement.
ETH wave count analysis
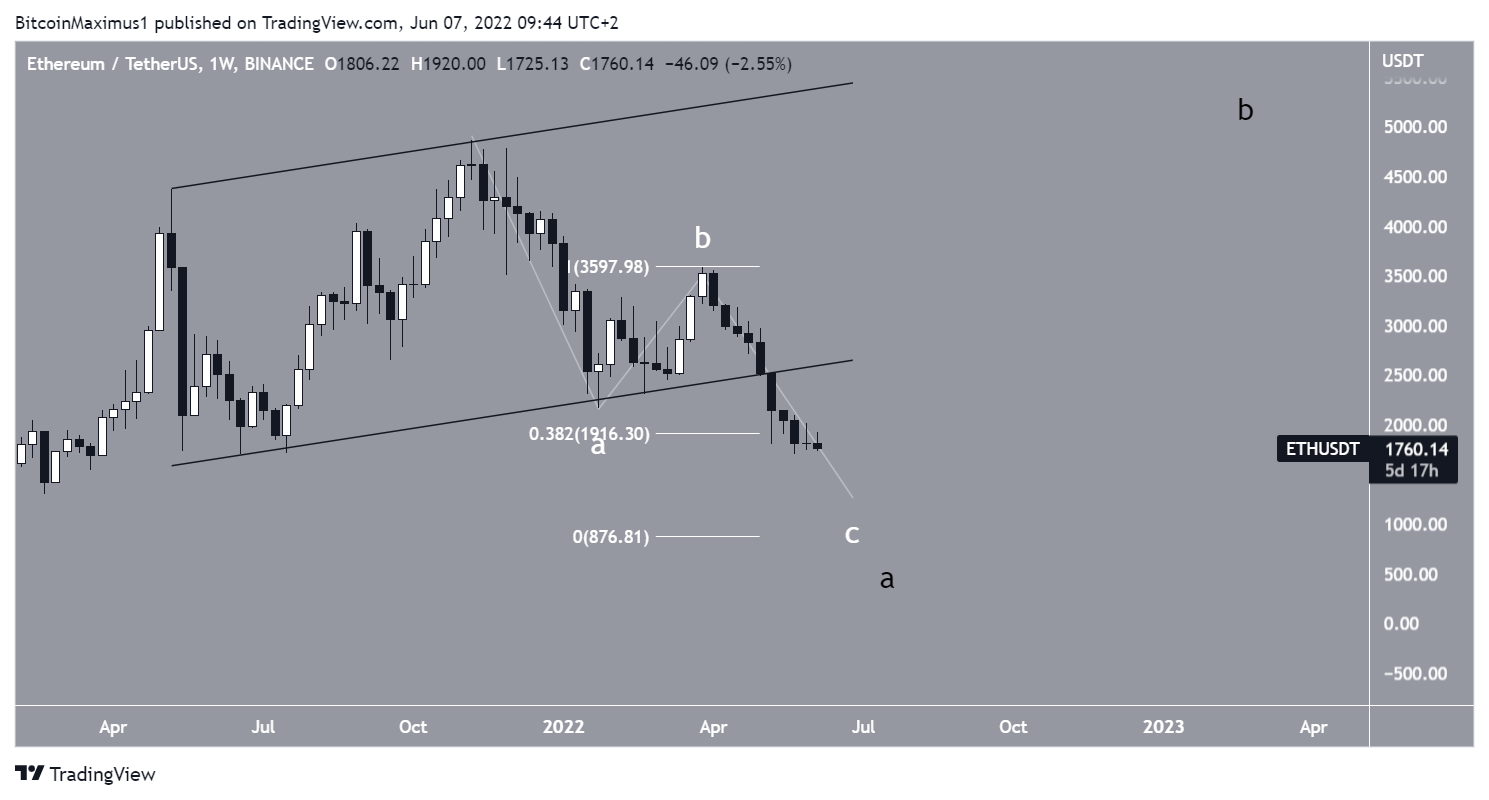
Cryptocurrency trader @TheTradingHubb tweeted a chart of ETH, stating that the price could soon complete wave A of a long-term A-B-C correction.
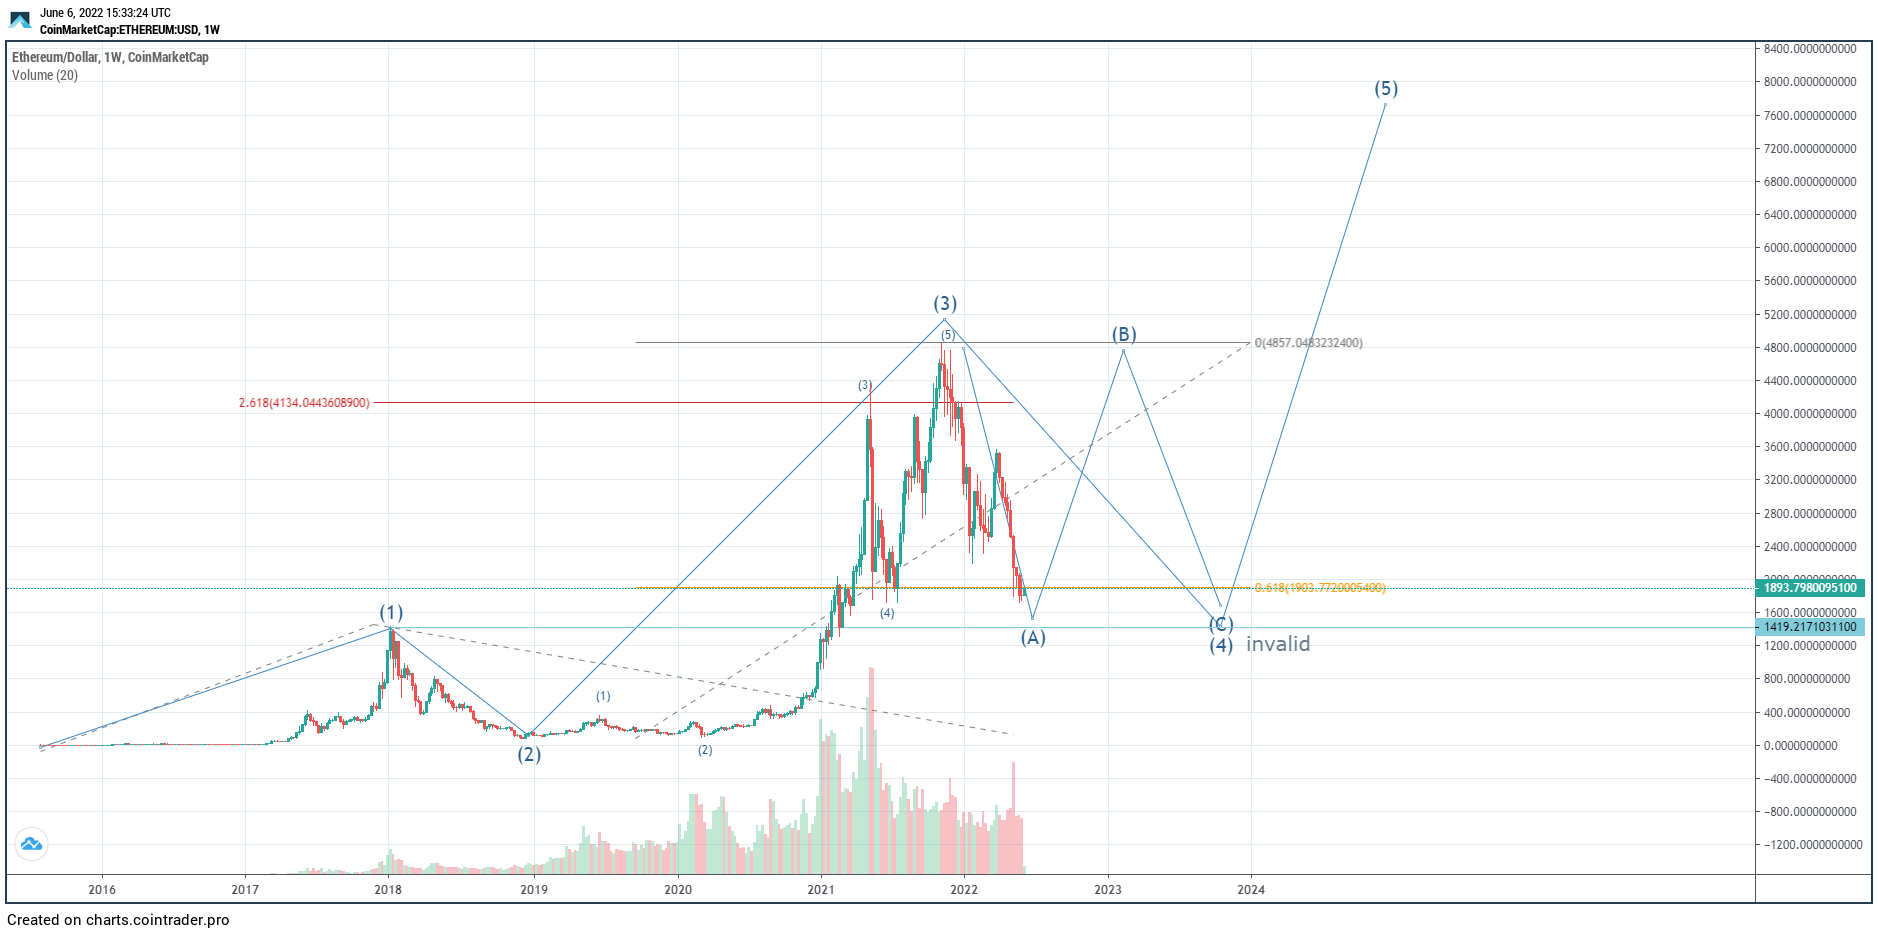
While this is a possibility, it is not yet certain of the A wave is complete.
If the short-term A:C (white) waves have a 1:1 ratio, this would lead to a low of $876 prior to the reversal.
Furthermore, the exact shape of the ensuing retracement is not yet determined.
For Be[in]Crypto’s latest bitcoin (BTC) analysis, click here


