


The Ethereum price recently broke down below a significant support area. Whether it reclaims the support area or validates it as resistance will have major implications for the future ETH price movement.
Technical analyst and trader @cryptodude suggested that the Ethereum chart has just made a clean break below a support area before validating it as resistance. This suggests that further ETH price decreases are in store.
I've always found $ETH 's price action cleaner than bitcoin's. pic.twitter.com/mfORSlfUy8
— the dude (@cryptodude999) December 2, 2019
Will the Ethereum price head downward or will it initiate an upward move in order to reclaim the support area? Continue reading below in order to find out.
Significant Support for Ethereum
The $160 area acted as resistance in the first part of 2019. The Ethereum price broke out afterward and the area acted as support twice — in October and November. Afterward, the price broke down and validated it as resistance.
However, a similarly-failed flip of the support area occurred in May. The Ethereum price broke out before validating the area as support. However, it could not hold the lower levels and immediately moved upward.
The Ethereum price would soon have to undergo a similar movement if it wants to reclaim the support area and move towards the resistance line of the channel it has been trading in since July.
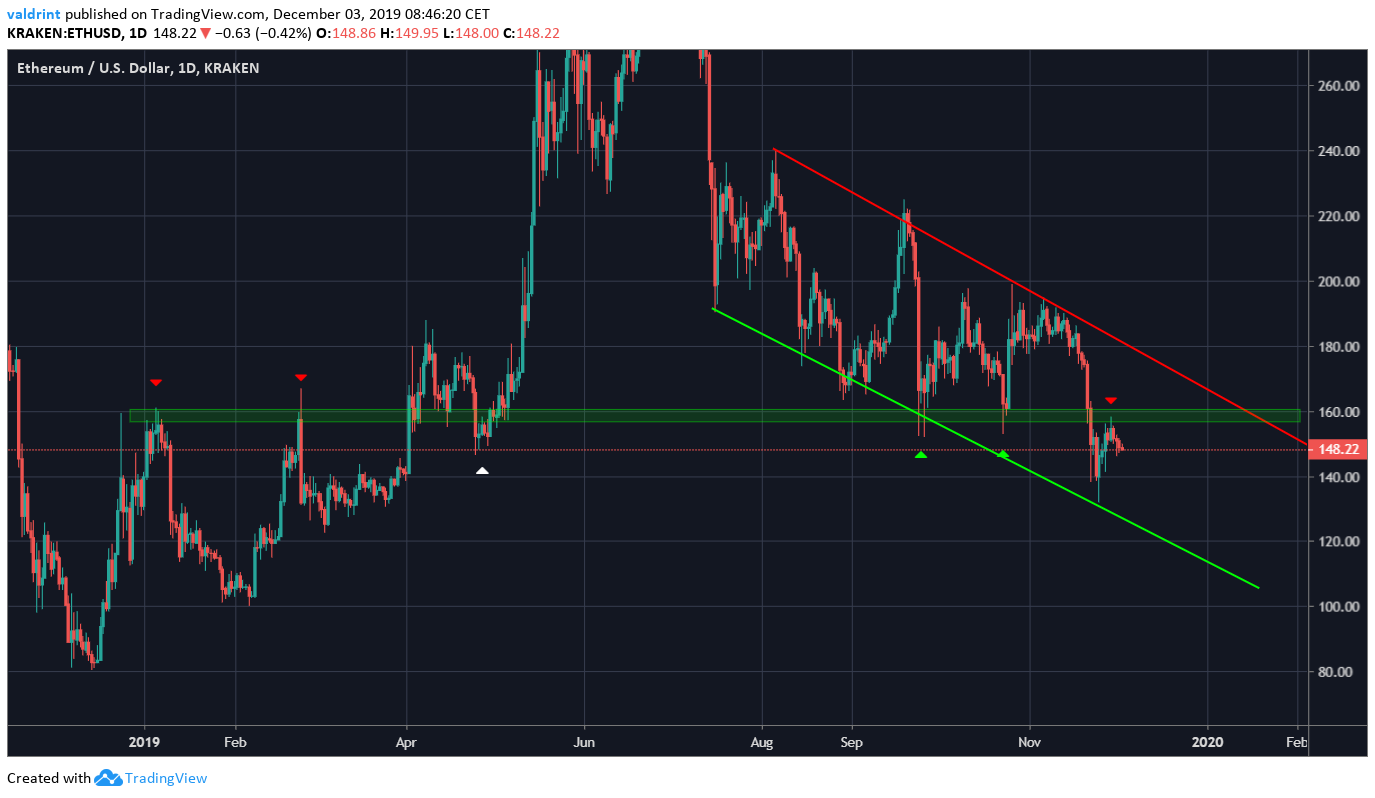
A similar movement would have us making a lower low inside the channel before beginning an upward move.
A similar sentiment is given by another technical analyst, @rektcapital, who outlined the importance of the $160 support area.
All the signs were there
And even though the resistance flip wasn't picture-perfect, the sentiment remains the same:
ETHUSD has flipped the bottom of its Weekly $160-$360 into a new resistance and has recently rejected price#Crypto $BTC pic.twitter.com/jRDtSUBMrc
— Rekt Capital (@rektcapital) December 3, 2019
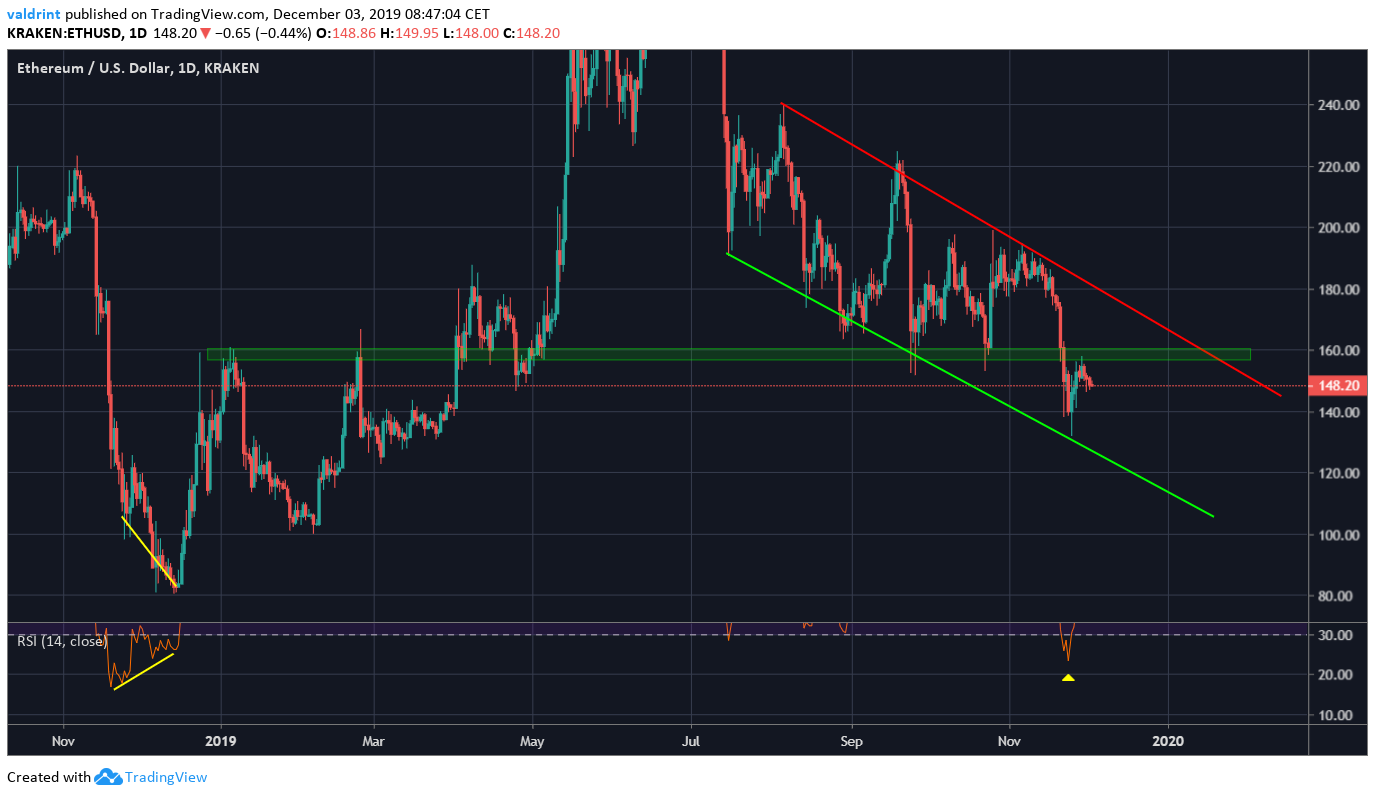
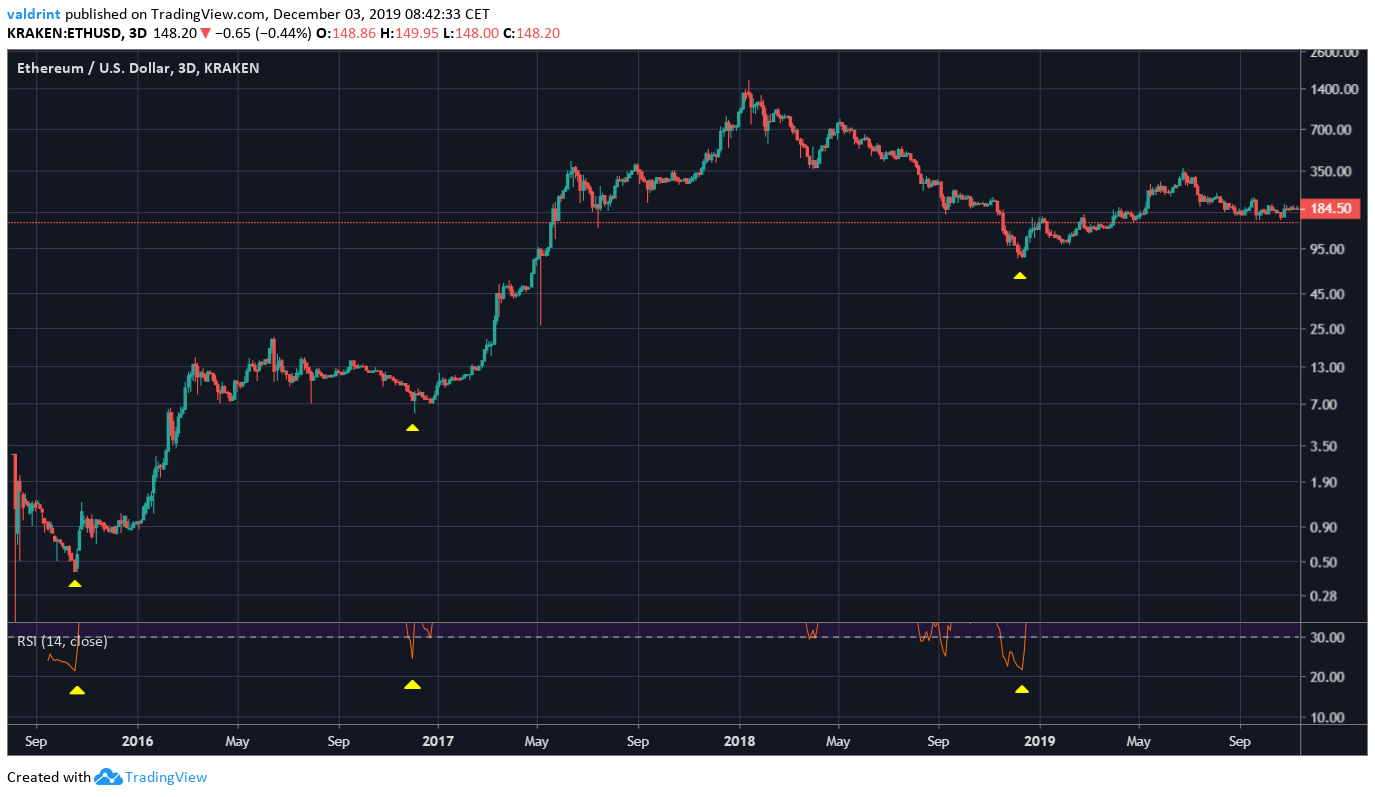
Oversold RSI
The three-day RSI has been deeply oversold only on three occasions. Each time, the low coincided with the bottom before the beginning of the new market cycle. It seems as if December 2018 was that bottom.
However, what remains to be seen is if the market cycle ended in June (which would make it very short) or if that was just the first wave and the current movement is a correction.
To conclude, while the market movement suggests a bearish outlook for ETH, the RSI in different time-frames warns that the bottom is near. Whether the price reclaims the $160 support area will go a long way in determining whether another upward move is near.
Disclaimer: This article is not trading advice and should not be construed as such. Always consult a trained financial professional before investing in cryptocurrencies, as the market is particularly volatile.


