


The Polkadot (DOT) price has increased by 23% since falling to a new yearly low on June 10. The upward movement cleared several resistance levels.
Due to the swiftness and magnitude of the upward movement, a long-term correction that began in February may be complete. The movement over the next few weeks will be crucial for determining the long-term trend.
Read More: Best Crypto Sign-Up Bonuses in 2023
Polkadot Price Creates Long-Term Bullish Pattern
The Polkadot price has fallen under a descending resistance line since May 2022. The line has caused numerous rejections, most recently on April 17, 2023. The rejection accelerated the decline and led to a new yearly low of $4.20 in June.
However, the DOT price regained its footing and created a bullish engulfing candlestick last week. This is a type of bullish candlestick in which the entire previous period’s decrease is negated inside a large, bullish candlestick.
This also created a double bottom pattern with respect to the price in January. The double bottom is considered a bullish pattern.
The DOT price has nearly reached the resistance line, now at $5.50.
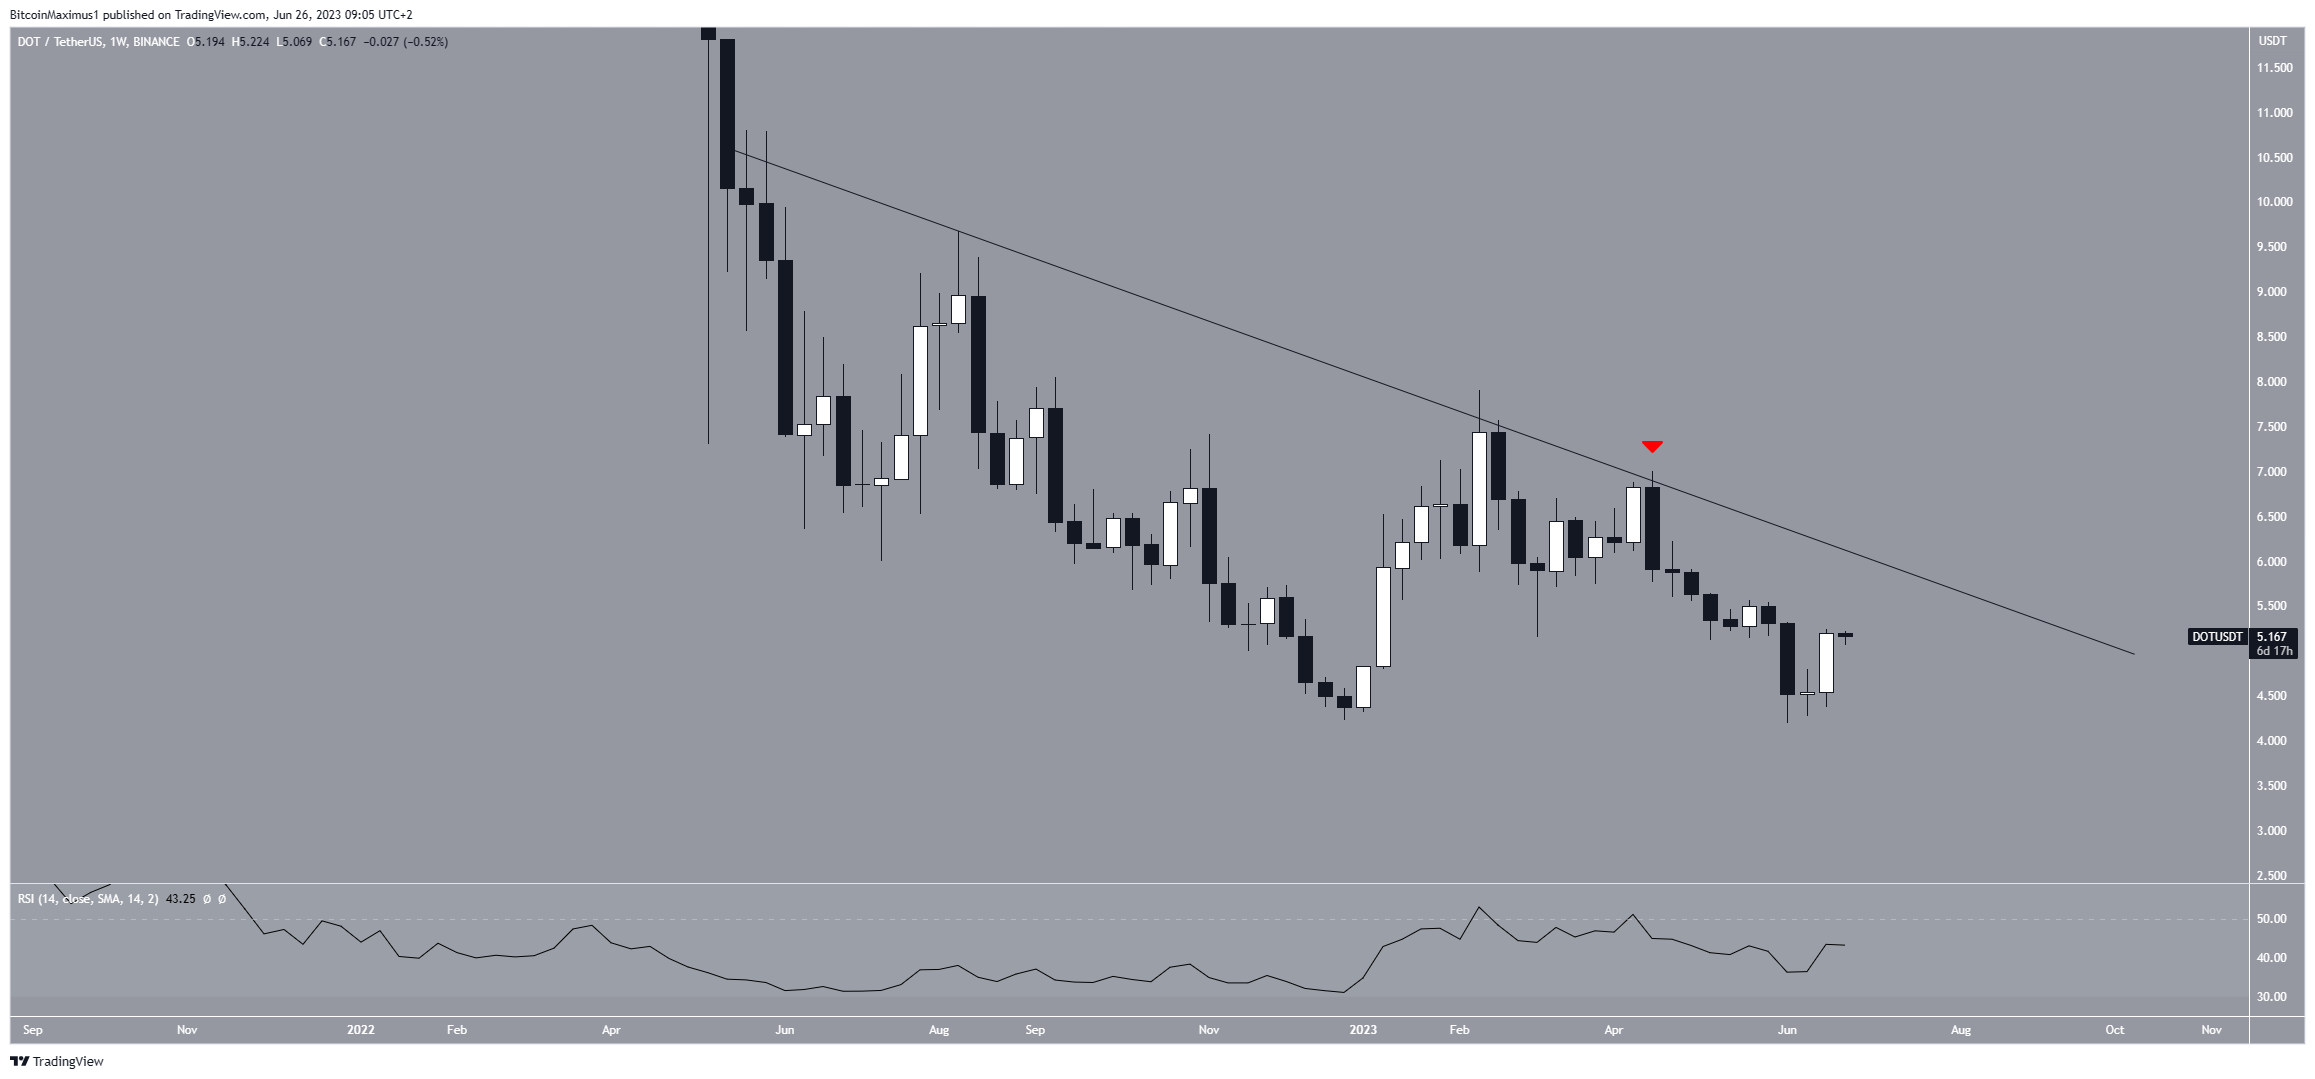
The weekly RSI does not help in determining the direction of the trend. By using the RSI as a momentum indicator, traders can determine whether a market is overbought or oversold and decide whether to accumulate or sell an asset.
Bulls have an advantage if the RSI reading is above 50 and the trend is upward, but if the reading is below 50, the opposite is true.
Even though the indicator is increasing, it is still below 50, indicating an undetermined trend. Moreover, since the price did not close below its yearly lows, there is no bullish divergence despite the significantly higher low in the RSI.
DOT Price Prediction: Has a Bottom Been Reached?
The technical analysis from the daily time frame is more bullish than that from the weekly one. The price action, RSI, and wave count all suggest that the price will increase in the near future.
Firstly, the DOT price broke out from a short-term descending resistance line, a sign that the previous correction is complete. Next, the daily RSI broke out from its own resistance line, a sign often preceding significant upward movements.
Moreover, the wave count is also bullish. Technical analysts employ the Elliott Wave theory as a means to identify recurring long-term price patterns and investor psychology, which helps them determine the direction of a trend.
Since the yearly high of $7.90, the decrease looks like a completed A-B-C corrective structure (black). In it, waves A:C had an exactly 1:1 ratio. This is common in such structures.
Thus, all signs indicate the correction is complete and a new upward movement begins. If that is the case, the DOT price can increase to at least $6.90.
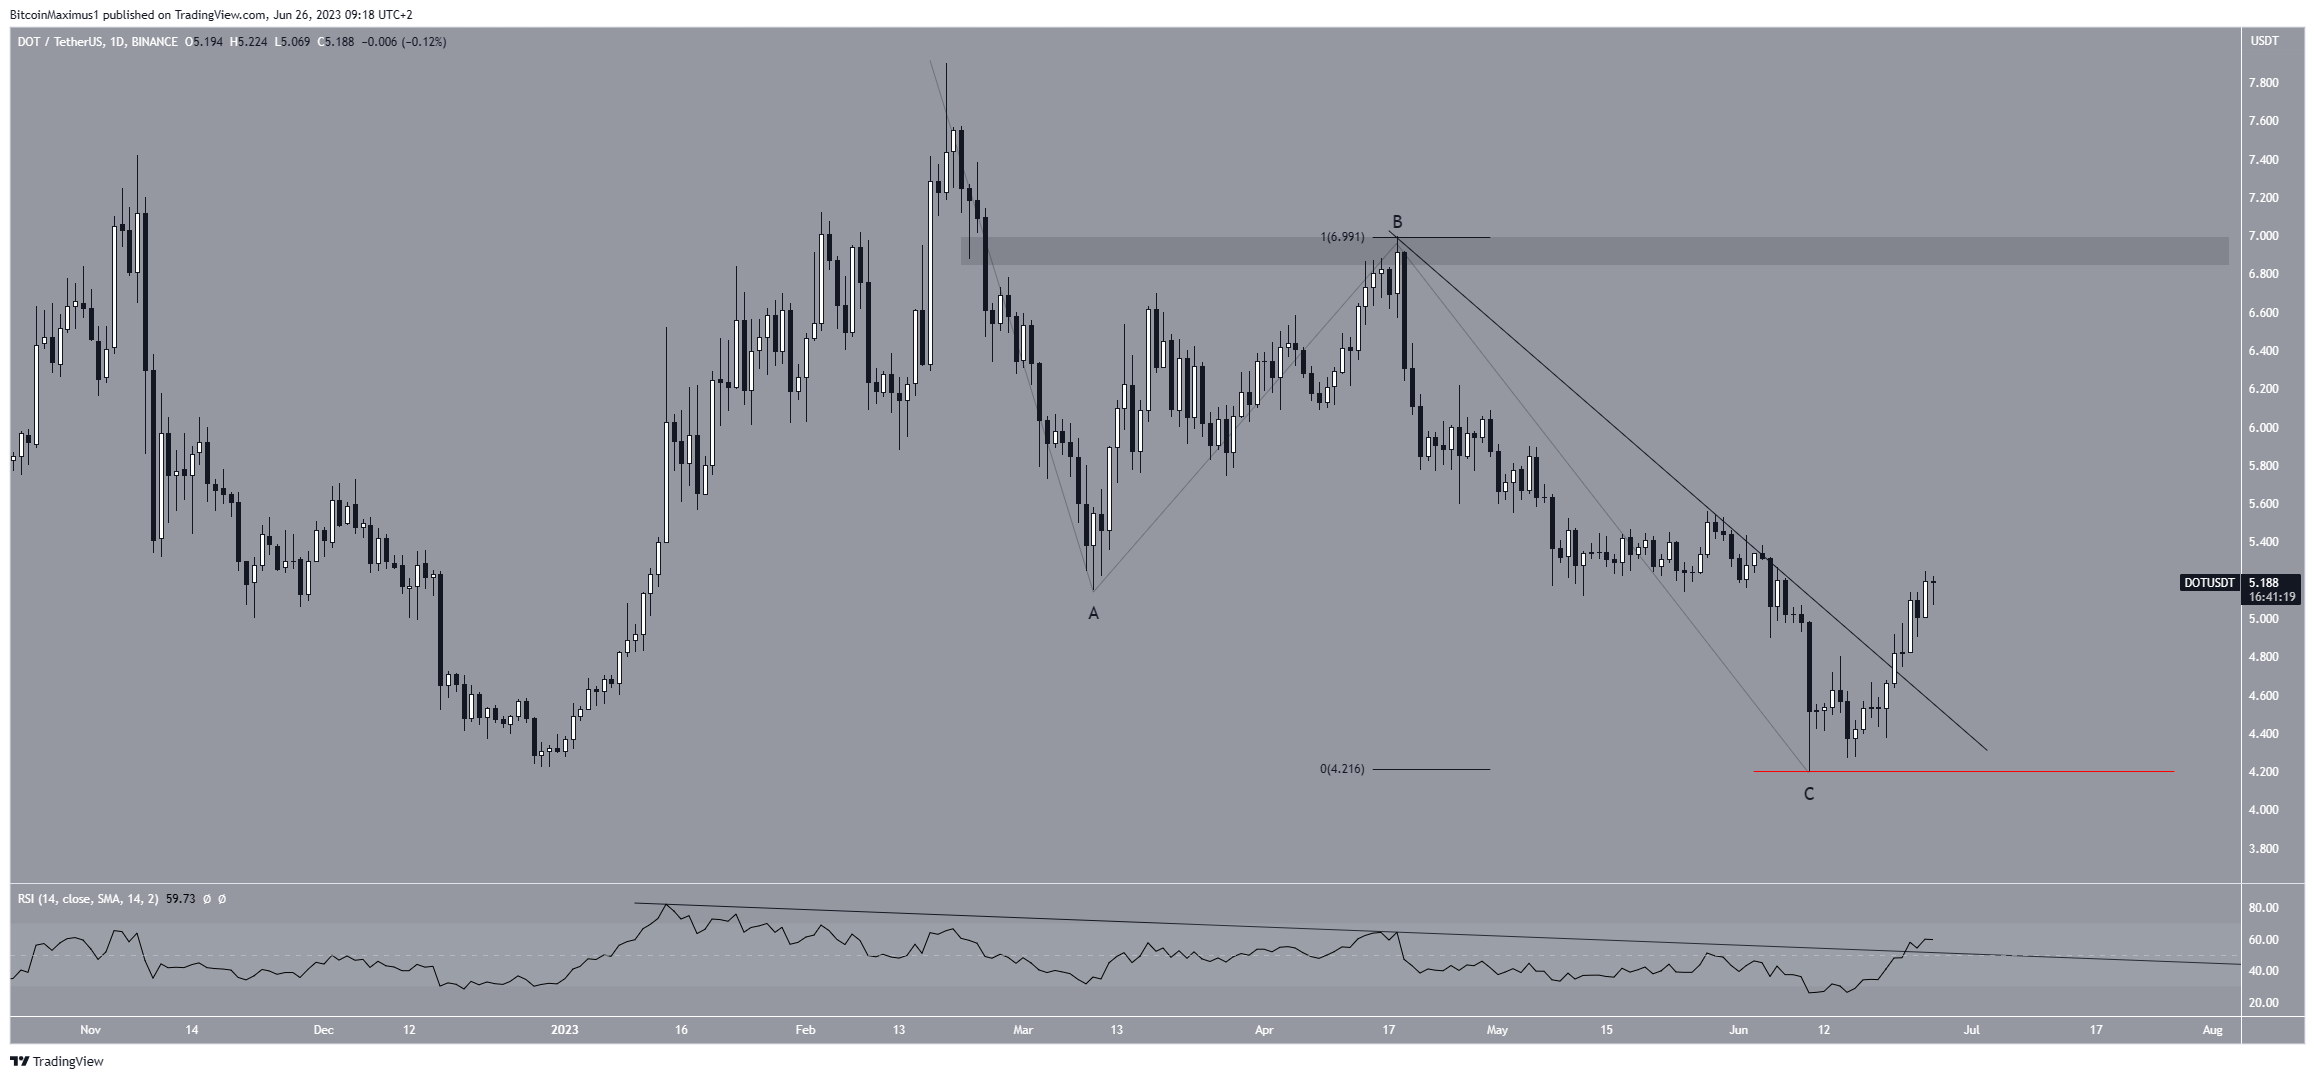
Despite this bullish DOT price prediction, a drop below $4.20 will mean that the breakout is invalid and the trend is still bearish. In that case, the DOT price could decline to $3.
Read More: 9 Best Crypto Demo Accounts For Trading
For BeInCrypto’s latest crypto market analysis, click here


