


The DOGE price faces the possibility of a breakdown from a descending triangle pattern that has been developing over the long term. Such a breakdown could result in a 50% decrease in price.
However, when we shift our focus to the daily timeframe, more optimistic indicators suggest the potential for a reversal in the current bearish trend.
Dogecoin DOGE Price Risks Breakdown From Long-Term Pattern
The weekly technical analysis of DOGE’s price movement reveals that the price has remained slightly above the $0.059 support level since June 2022. This support level has been confirmed multiple times, making it quite significant.
Notably, the most recent confirmations (green icons) showed long lower wicks, which suggest increased buying activity.
However, despite these positive signs, DOGE has been under pressure due to a descending resistance trendline that has been in place since November 2022. When combined with the $0.059 support, it forms a descending triangle pattern, typically seen as bearish.
During this period, DOGE has established several lower highs, indicating a loss of its upward momentum. The DOGE price has almost returned to the $0.059 level, erasing the gains from its recent bounce.
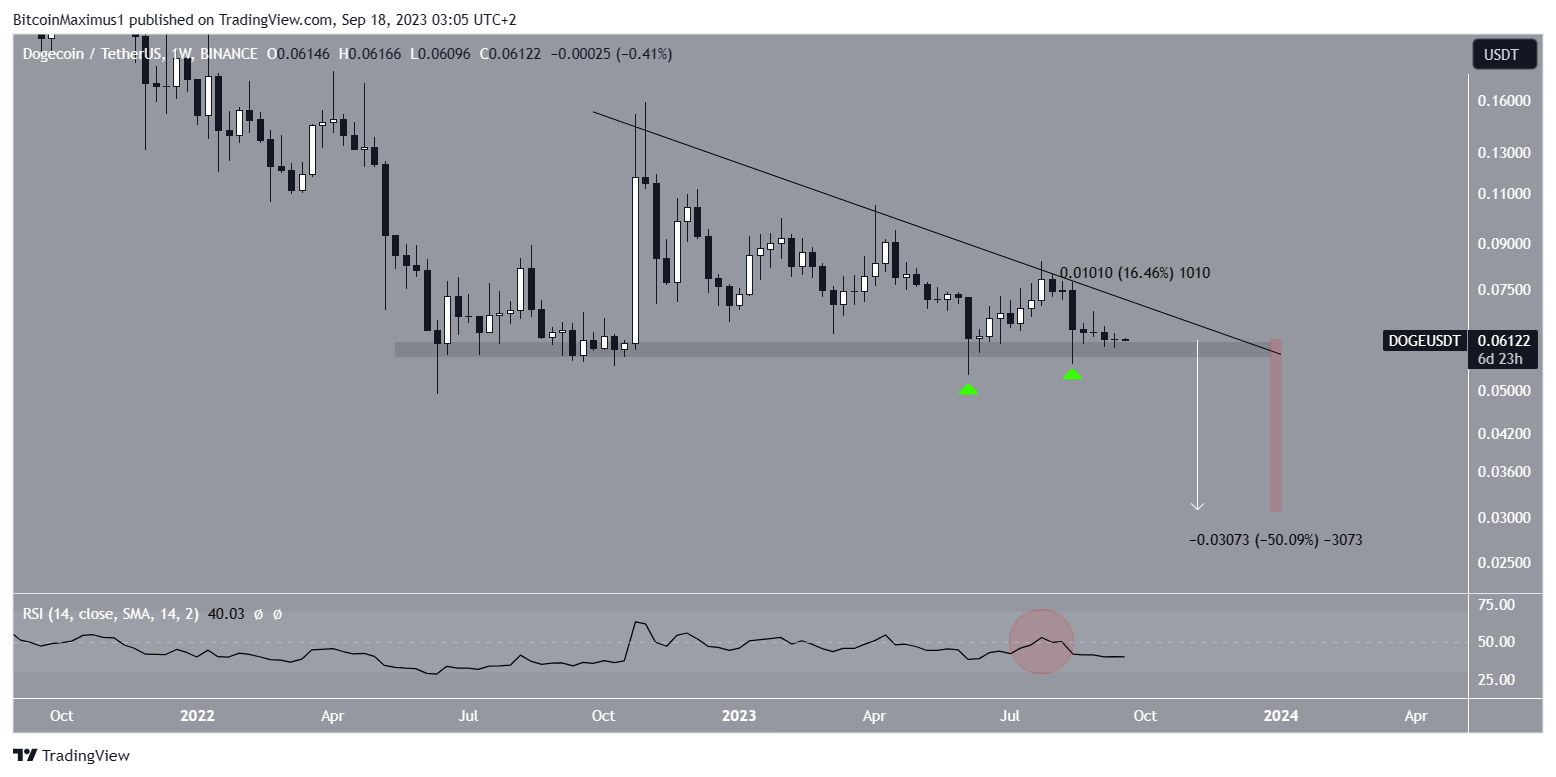
If there is a breakdown that covers the entire height of this pattern (white), it could potentially push DOGE’s price down to $0.030. This would amount to a drop of roughly 50%.
DOGE must close below the $0.059 horizontal support level to confirm this breakdown. On the other hand, a return to the descending resistance line would be an increase of 16%.
The weekly Relative Strength Index (RSI), which measures momentum, aligns with the idea of a possible breakdown. Traders often use the RSI to gauge whether an asset is overbought or oversold, which helps guide their buying or selling decisions. The RSI is currently below the 50 mark (red circle) and is declining, both of which are indicative of a bearish trend.
In the news, FTX is set to liquidate many crypto assets. However, despite reportedly having holdings in Dogecoin, the bankrupt exchange does not have plans to liquidate any.
DOGE Price Prediction: Can Bullish Pattern Spark Reversal?
While the weekly timeframe is bearish, the daily one is still undetermined. Moreover, it allows for the possibility of a bullish trend reversal if the current pattern materializes.
Since August 17, the DOGE price has created a double bottom pattern. The double bottom is considered a bullish pattern, meaning that it is expected to lead to upward movements most of the time.
Furthermore, the first bottom was characterized by a long lower wick, a sign of buying pressure. Then, the second one confirmed a bullish divergence in the daily RSI. This is a bullish development when a momentum increase accompanies a price decrease. It often precedes significant upward movements.
However, the DOGE price has yet to initiate its increase and bounce from the $0.059 horizontal support area.
Check Out the Best Upcoming Airdrops in 2023
However, since these bullish signs are only present in the daily timeframe, it is possible that they will only initiate a short-term bullish trend reversal. The price could increase to only the long-term resistance line at $0.070 before another downward movement.
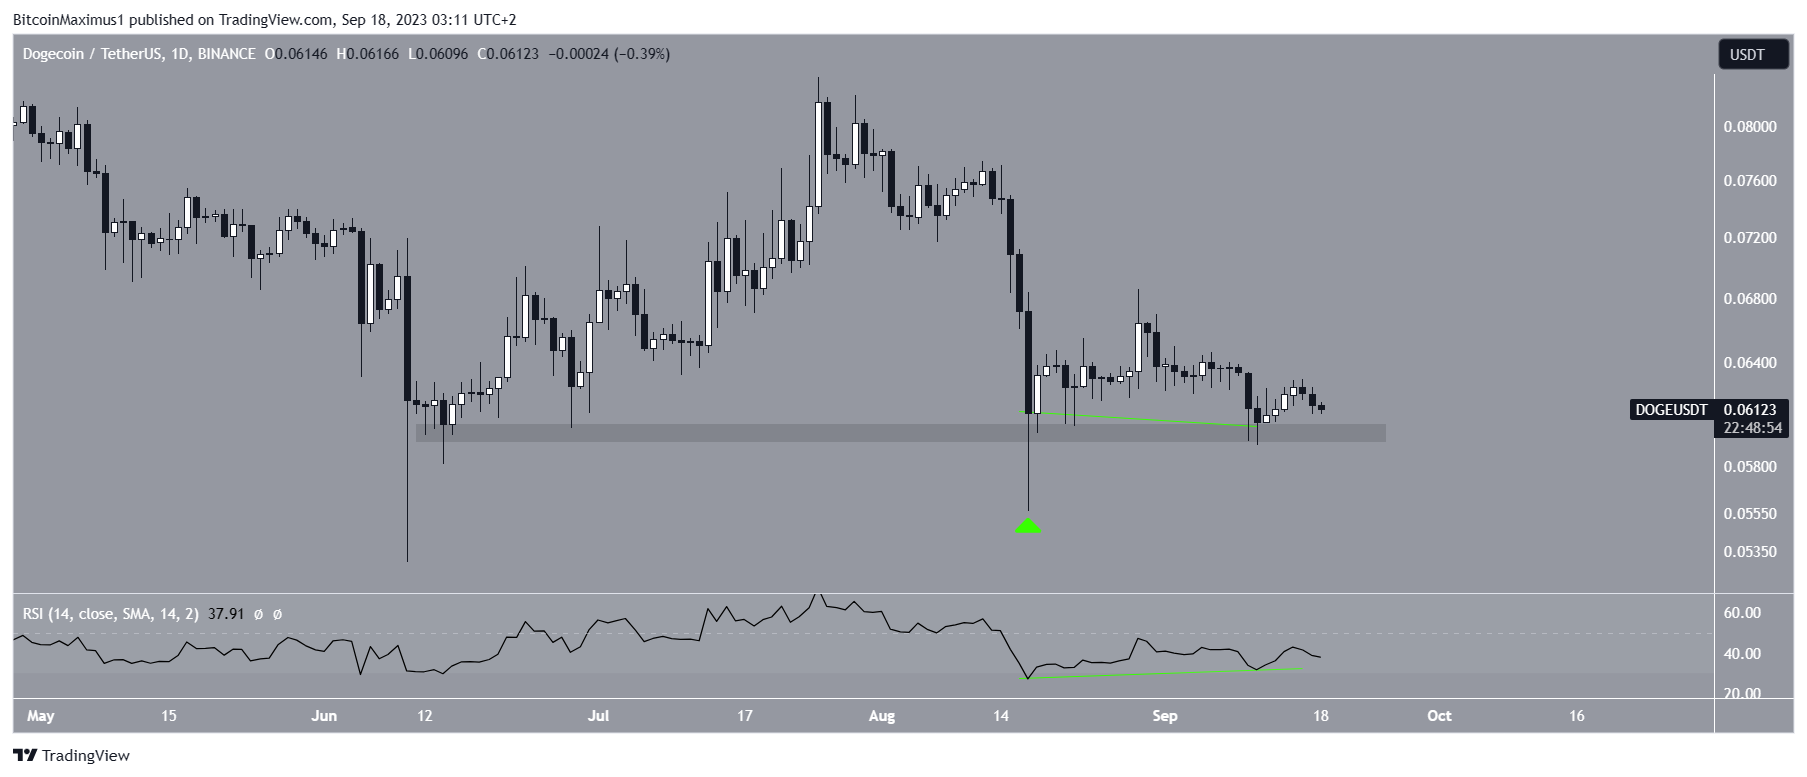
Also, a close below the minor $0.061 area will invalidate the double bottom pattern, likely causing the aforementioned long-term breakdown.
To conclude, the DOGE price prediction will determine whether the price bounces at the $0.059 area or closes below it. A bounce can lead to a 15% increase, while a close below the area could trigger a 50% plunge.


