


On June 26, the Dogecoin price reached a low of 24 satoshis. An upward move ensued. On July 6, DOGE reached a high of 44 satoshis. It has been decreasing since.
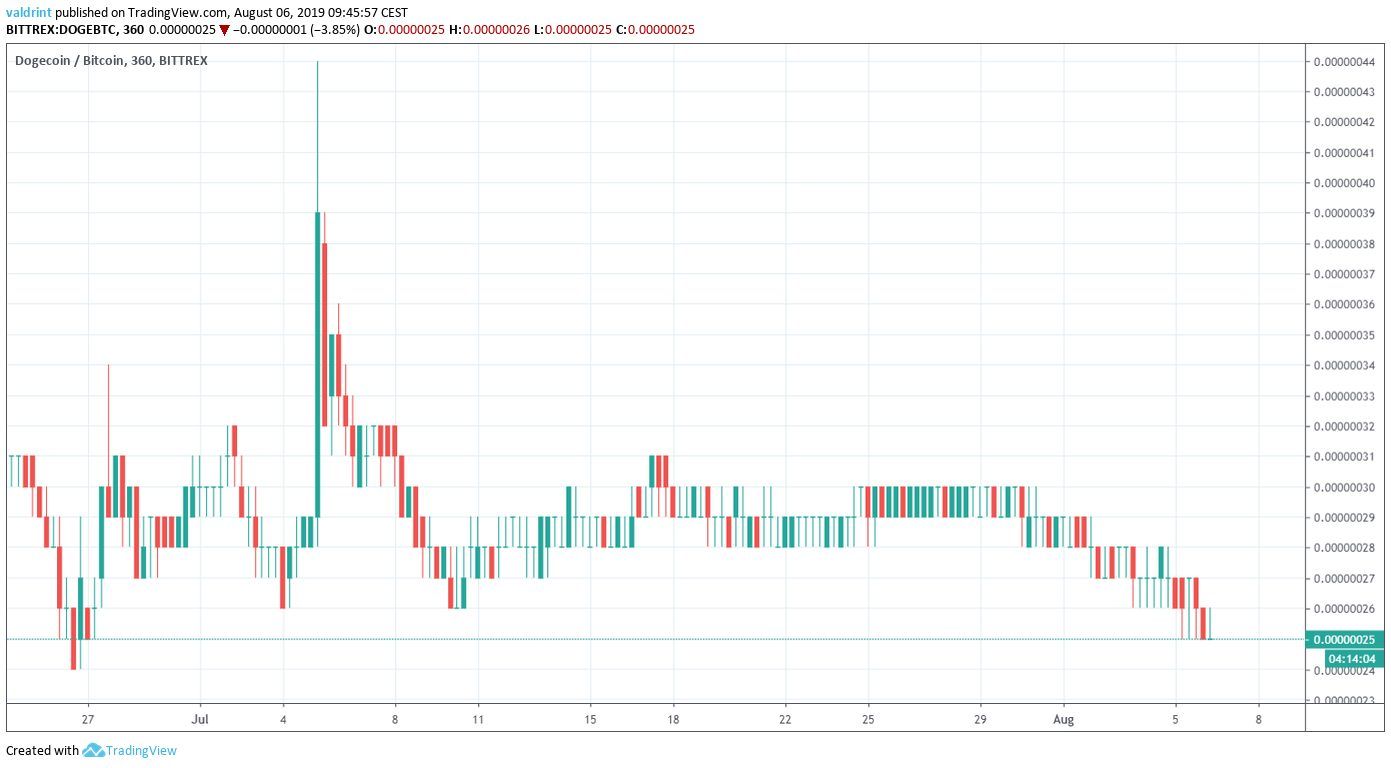
At the time of writing, it was trading at 25 satoshis.
Will Dogecoin initiate a reversal? Continue reading if you want to find out.
For our previous analysis, click here.
If you are interested in trading cryptocurrencies with a multiplier of up to 100x on our new partner exchange with the lowest fees, follow this link to get a free StormGain account!
For those of you who like images and would be more interested in a video analysis, please click below:
Dogecoin Price: Trends and Highlights for August 6
- DOGE/BTC broke down from a symmetrical triangle.
- It is possibly making a double bottom.
- There is support at 25 and 15 satoshis.
- The RSI & MACD have developed bullish divergence.
Previous Movement
Since reaching the aforementioned low on June 26, Doge has been trading inside the symmetrical triangle outlined below.
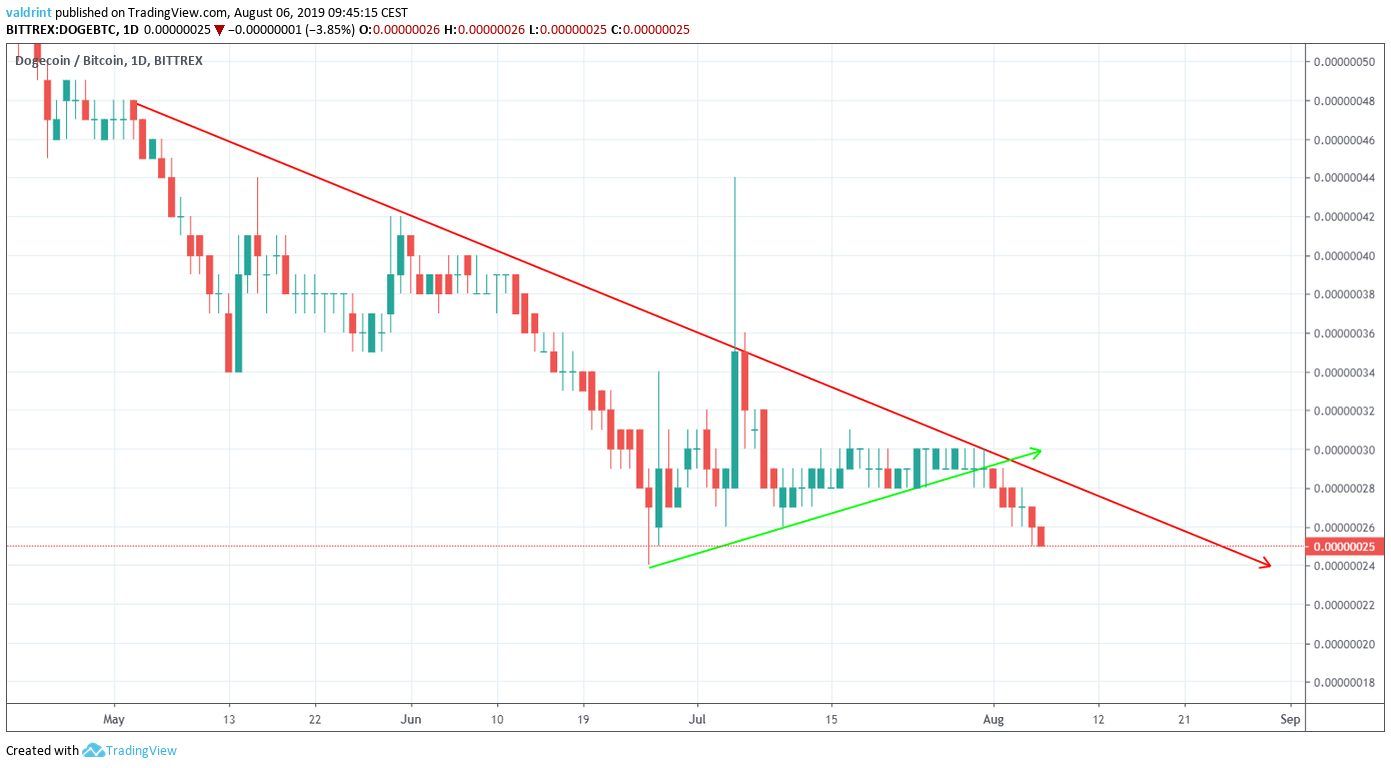
On August 1st, it reached the point of convergence between resistance and support lines.
From there, the Dogecoin price broke down.
It is currently decreasing, reaching values very close to those of the beginning of the triangle.
Long-Term Support
A look at the weekly time-frame shows that DOGE is trading inside a very significant support area.
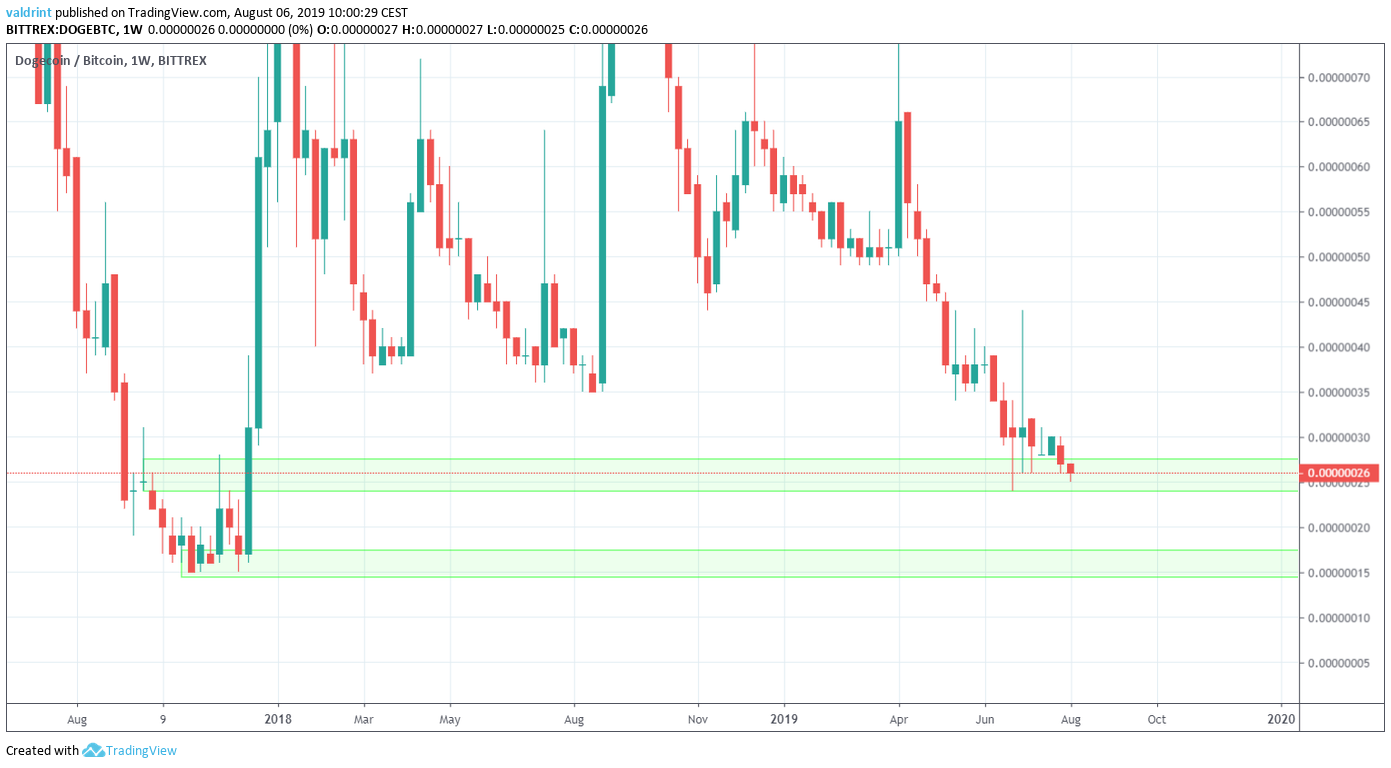
The support area is found at 25 satoshis.
The previous time the Dogecoin price reached it, it began an upward move and reached a high of 44 satoshis, an increase of close to 80%.
The second support area is found near 15 satoshis.
Developing Divergence
A look at the RSI and MACD shows that both have been generating bullish divergence.
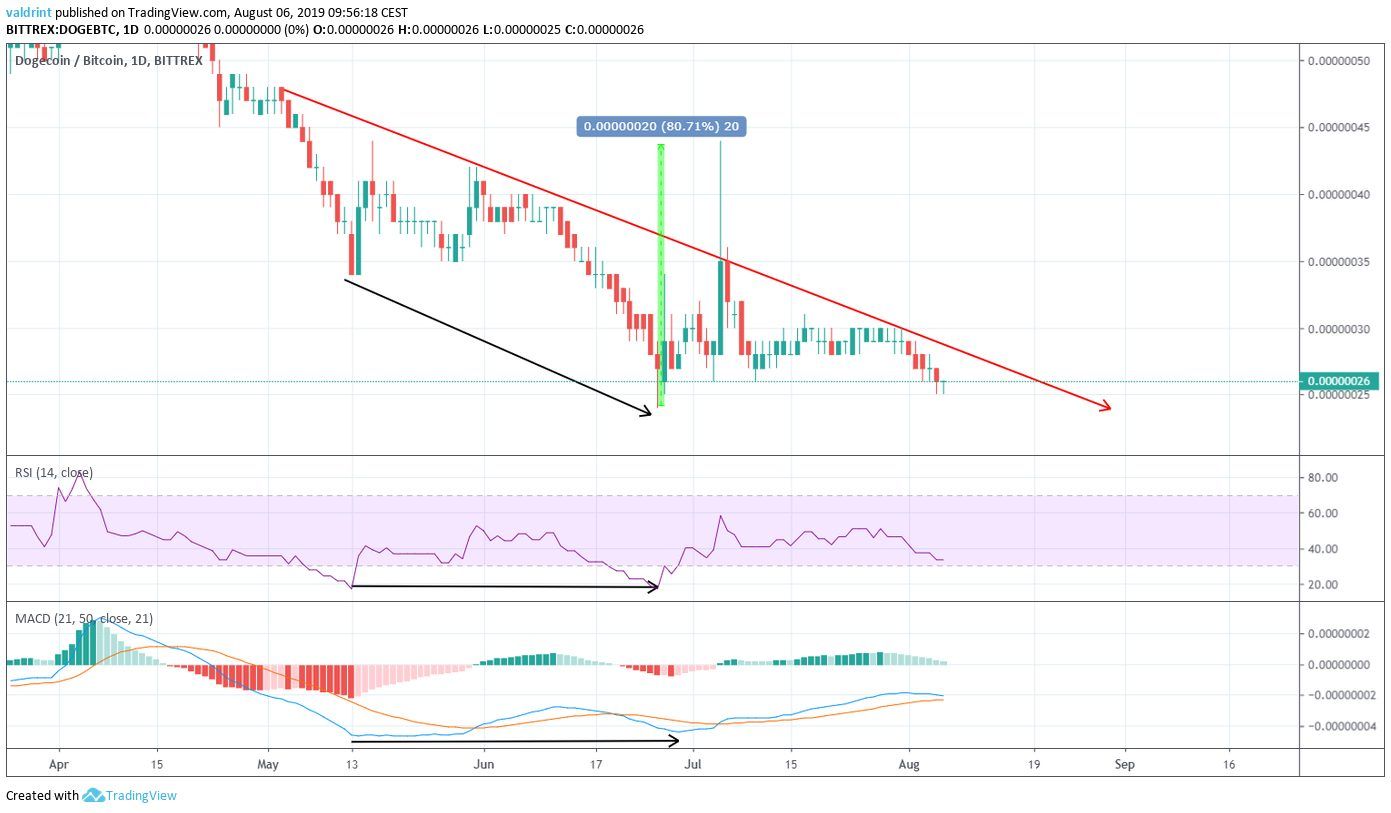
The first instance of this divergence was visible in the period from May 13 to June 26.
An upward move followed that amounted to a total increase of 80%.
Currently, there is another instance of a divergence developing.
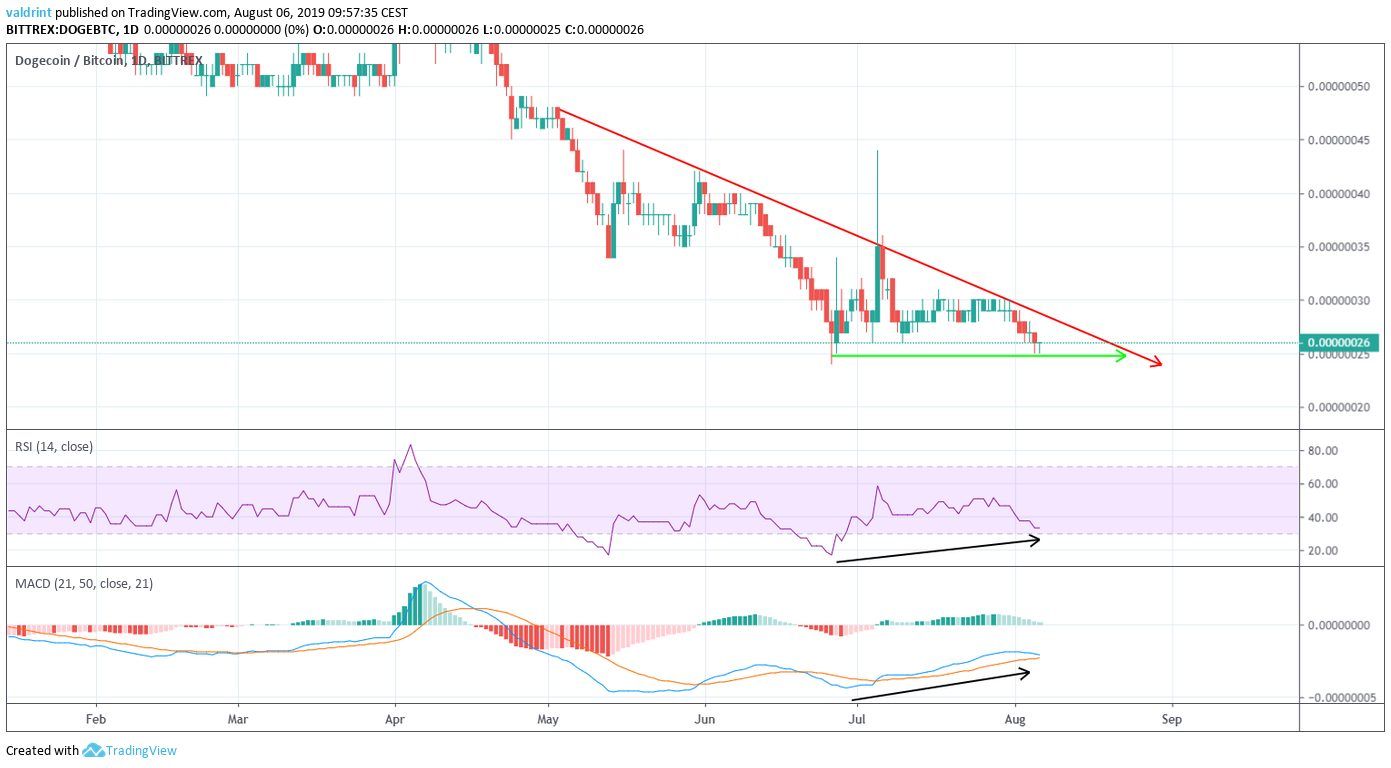
While the Dogecoin price is possibly making a double bottom on a horizontal support line, both the RSI and the MACD have generated higher values.
However, the horizontal support line would create a descending triangle, which is a bearish pattern, making a price breakout unlikely.
Instead, we drew a line parallel to the resistance line in order to find our possible support line.
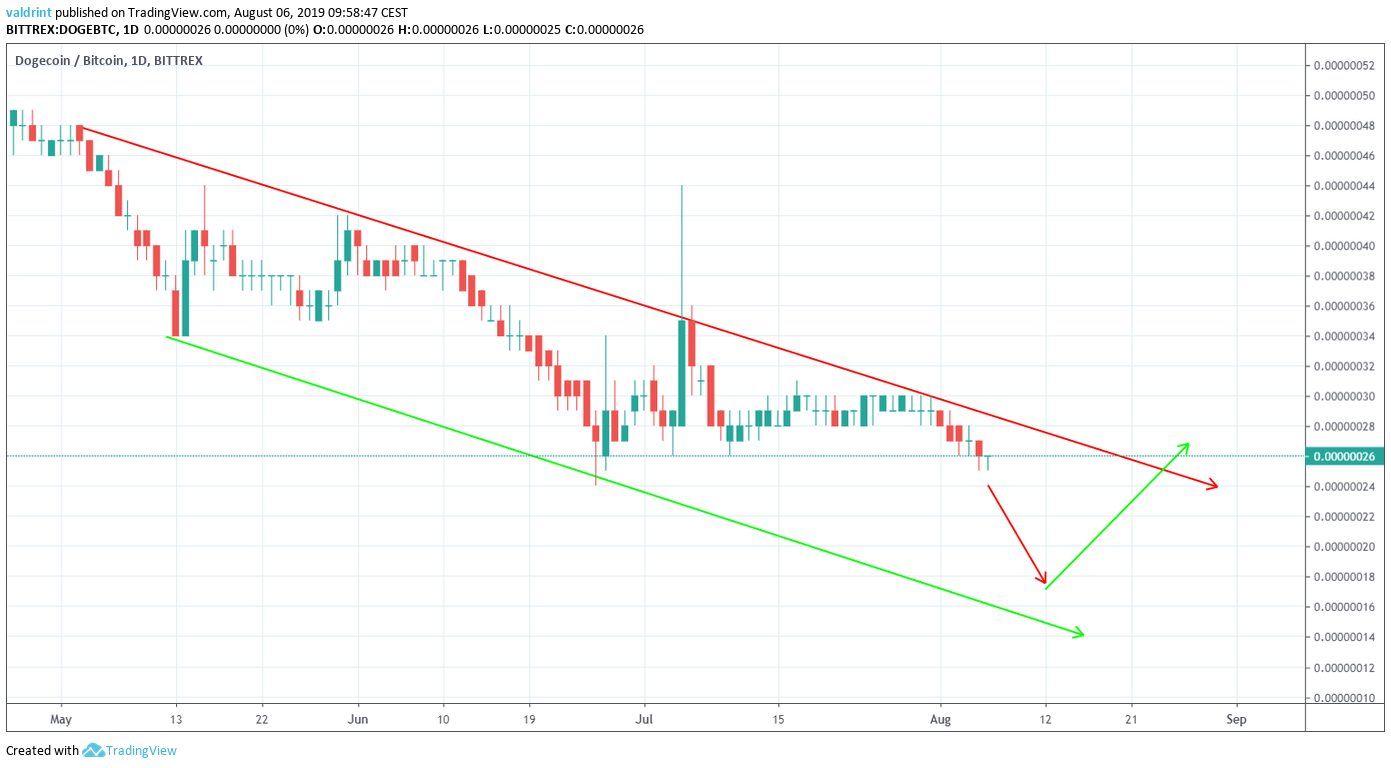
This created the descending channel outlined above.
Additionally, the support line of the channel is near 15, coinciding with the second support line outlined in the first section.
Therefore, we believe that the Dogecoin price will decrease until it touches the support line, before beginning an upward move.

Dogecoin Price Summary
The Dogecoin price is trading inside a significant support area, possibly inside a descending channel.
According to our analysis, it is likely to continue decreasing until it touches the support line of the channel.
Do you think DOGE will break out from the triangle? Let us know in the comments below.
Disclaimer: This article is not trading advice and should not be construed as such. Always consult a trained financial professional before investing in cryptocurrencies, as the market is particularly volatile.
Images are courtesy of Shutterstock, TradingView.


