

Dogecoin (DOGE) has deviated above an important resistance area before falling below it. On the other hand, Shiba Inu (SHIB) has managed to successfully move above its own resistance area.
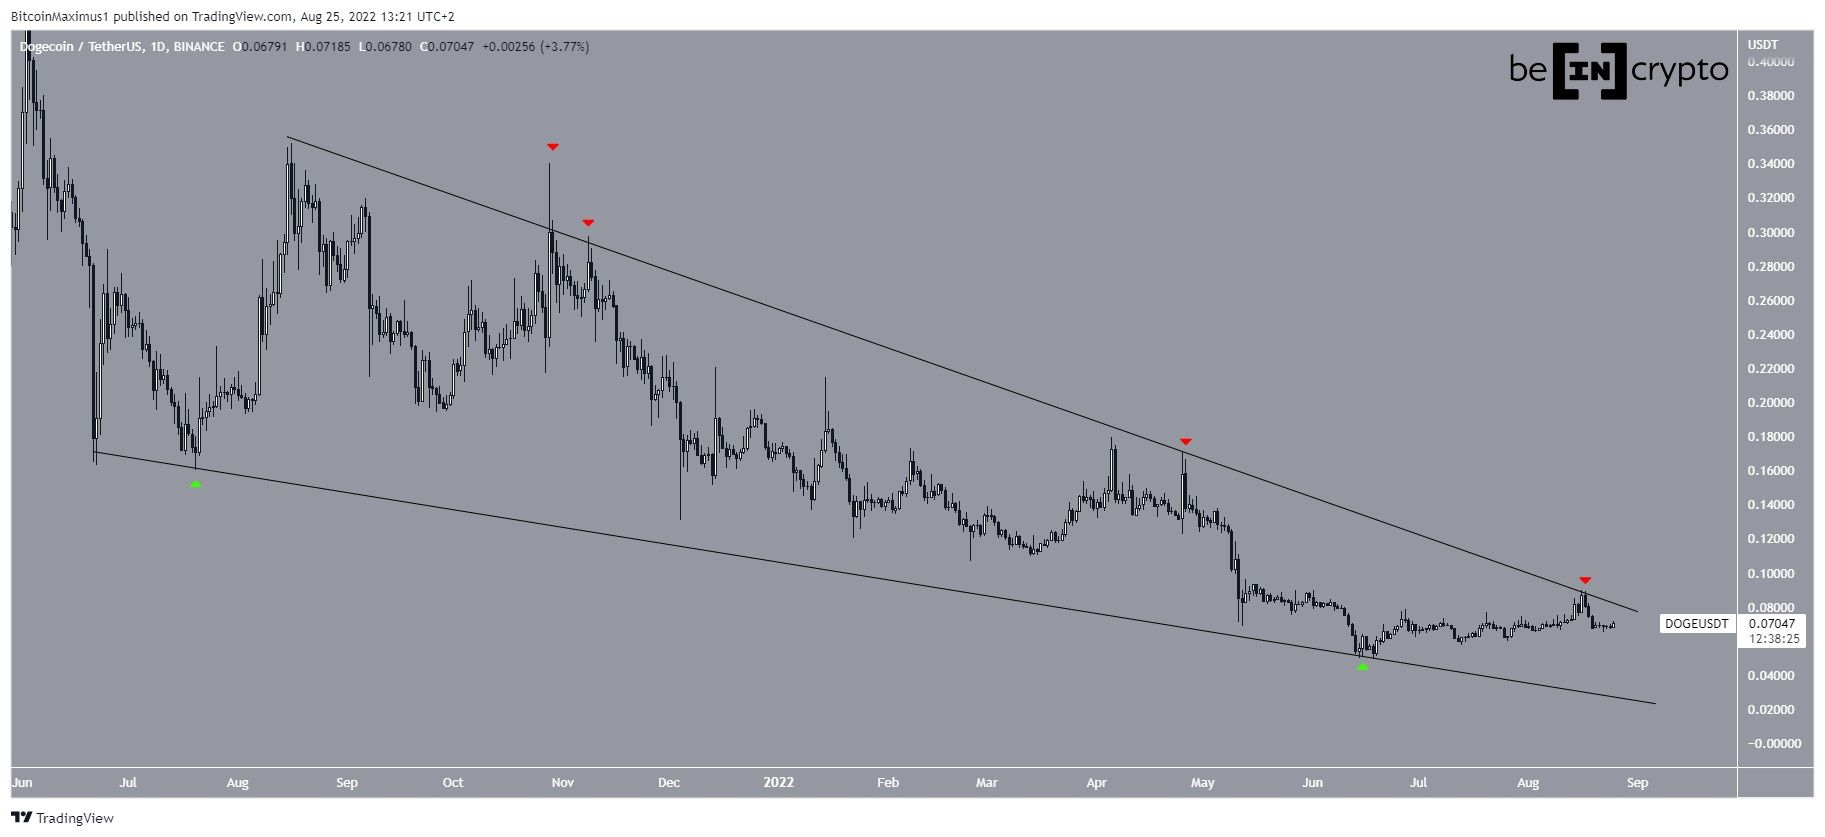
DOGE
DOGE has been falling inside a descending wedge since June 2021. The wedge is considered a bullish pattern, meaning that an eventual breakout from it would be likely.
So far, both the resistance (red icons) and the support line (green icons) of the wedge have been validated numerous times. Most recently, the price validated the resistance line on Aug 16 and has been decreasing since.
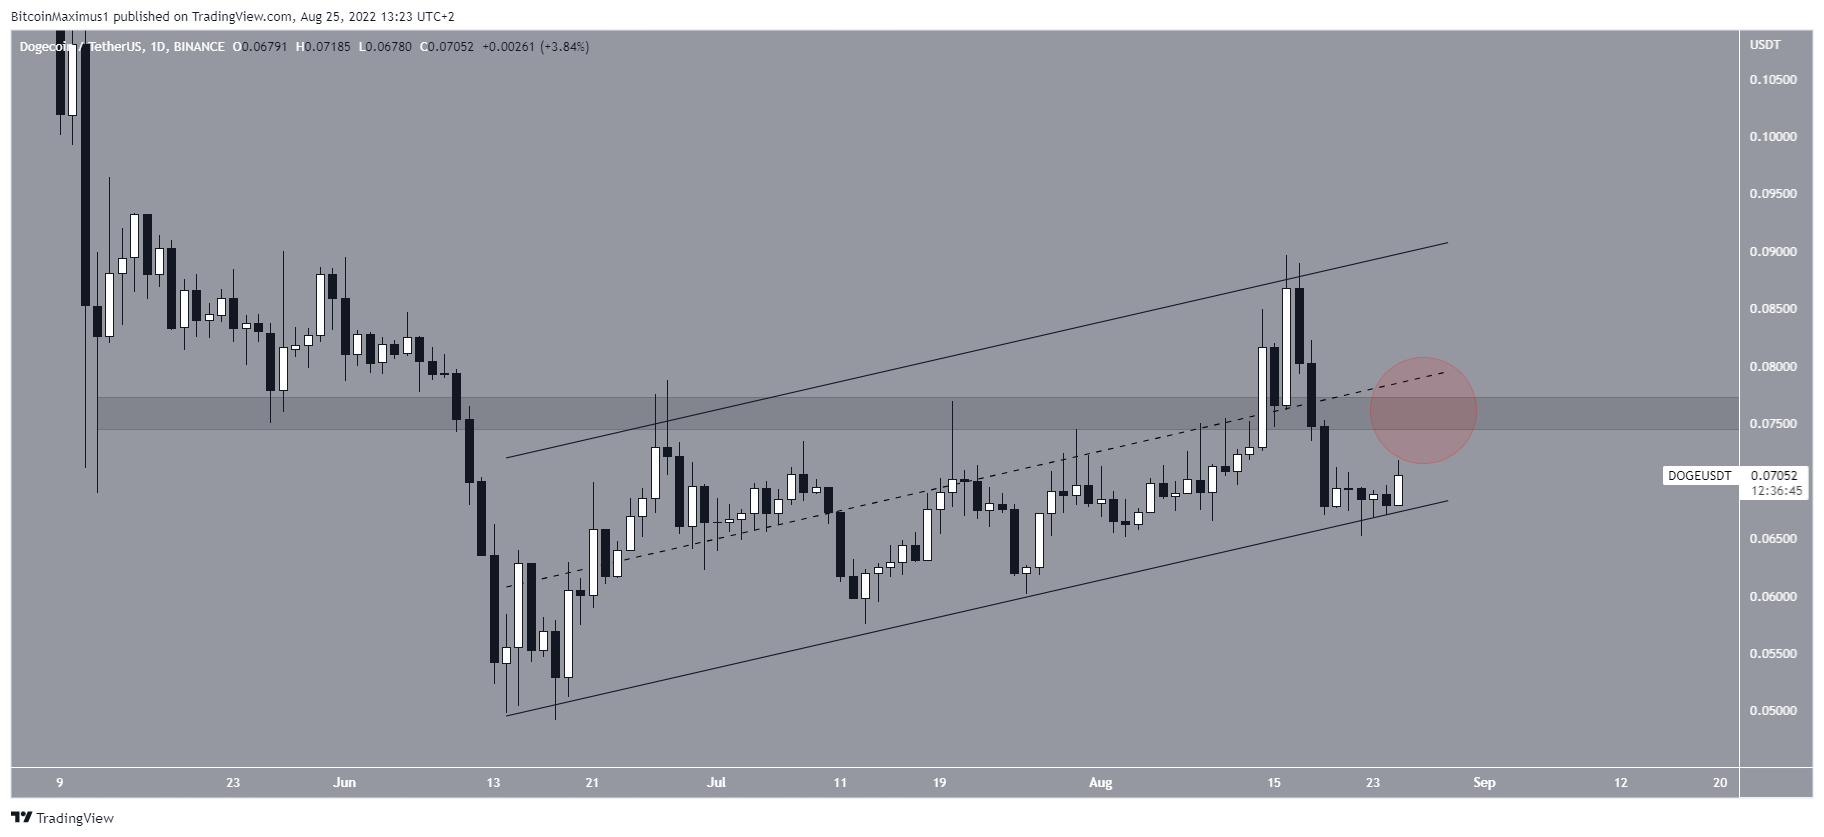
A closer look at the DOGE movement supports the possibility that the price will decrease.
The main reason for this is the deviation and subsequent decrease below the $0.075 area. Now, the area is expected to act as resistance once more.
Furthermore, DOGE is trading in the lower portion of an ascending parallel channel, which usually contains corrective movements. The previously outlined $0.075 resistance area coincides with the middle of the channel, increasing its potency.
So, despite the fact that the previously outlined wedge is considered a bullish pattern, a decrease toward its support line seems to be more likely than an eventual breakout.
A breakdown from the channel would confirm this possibility while an increase above $0.075 would suggest that a breakout is instead more likely.
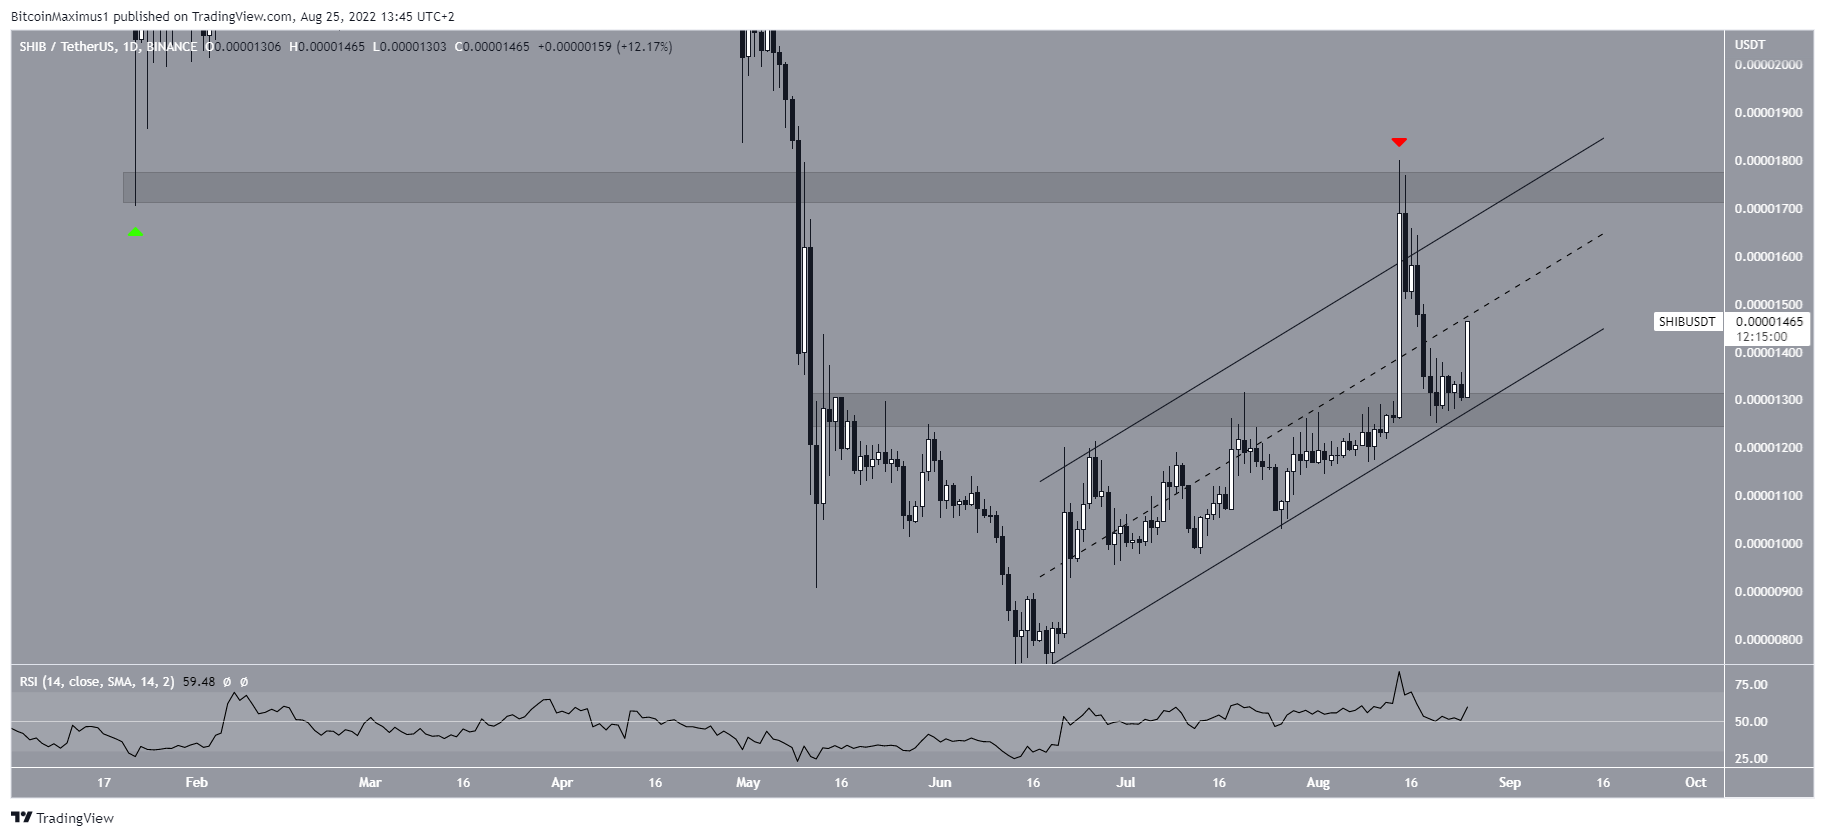
SHIB
SHIB has also been increasing inside an ascending parallel channel since June 18. However, unlike DOGE, it has managed to break out above its own resistance at $0.0000125 and validate it as support afterward.
Currently, SHIB is attempting to move above the middle of its ascending parallel channel. If it is successful in doing so, the next resistance would be at $0.0000175, also coinciding with the resistance line of the channel.
The daily RSI is currently right at the 50 line, providing a fairly neutral assessment.
So, whether SHIB breaks out or down from the channel and its horizontal areas in the process will likely determine the direction of the future trend.
For Be[in]Crypto’s latest Bitcoin (BTC) analysis, click here
Disclaimer
In line with the Trust Project guidelines, this price analysis article is for informational purposes only and should not be considered financial or investment advice. BeInCrypto is committed to accurate, unbiased reporting, but market conditions are subject to change without notice. Always conduct your own research and consult with a professional before making any financial decisions. Please note that our Terms and Conditions, Privacy Policy, and Disclaimers have been updated.
