


The bankrupt crypto exchange FTX is seeking to gain court approval to liquidate $3.4 billion in cryptocurrencies. This liquidation approval is likely to come by September 13.
However, FTX’s court documents suggest that the exchange will likely offload a maximum of $100 million in digital assets weekly. This could make the potential bearish effect on the market more gradual as opposed to a sharp fall in asset prices if FTX were to liquidate all of its assets immediately.
As of January 17, FTX held $685 million in Solana (SOL), $67 million in Aptos (APT), and $42 million in Dogecoin (DOGE), among other assets. In this article, we will take a look at the price movement for all three coins and determine the potential impact of the FTX liquidation.
Solana (SOL) Price Risks Breakdown From 256-Day Support Line
The SOL price has increased alongside an ascending support line since the beginning of the year. While doing so, the price reached a new yearly high of $32.13 on July 14.
However, the price has moved downwards since. After creating a lower high (red icon), SOL accelerated its rate of decrease, reaching a low of $17.36 on Sept.11.
The low validated the ascending support line for the first time since June 15 (green icon). So far, the line has been in place for 256 days. Whether the price breaks down or bounces can determine the future trend.
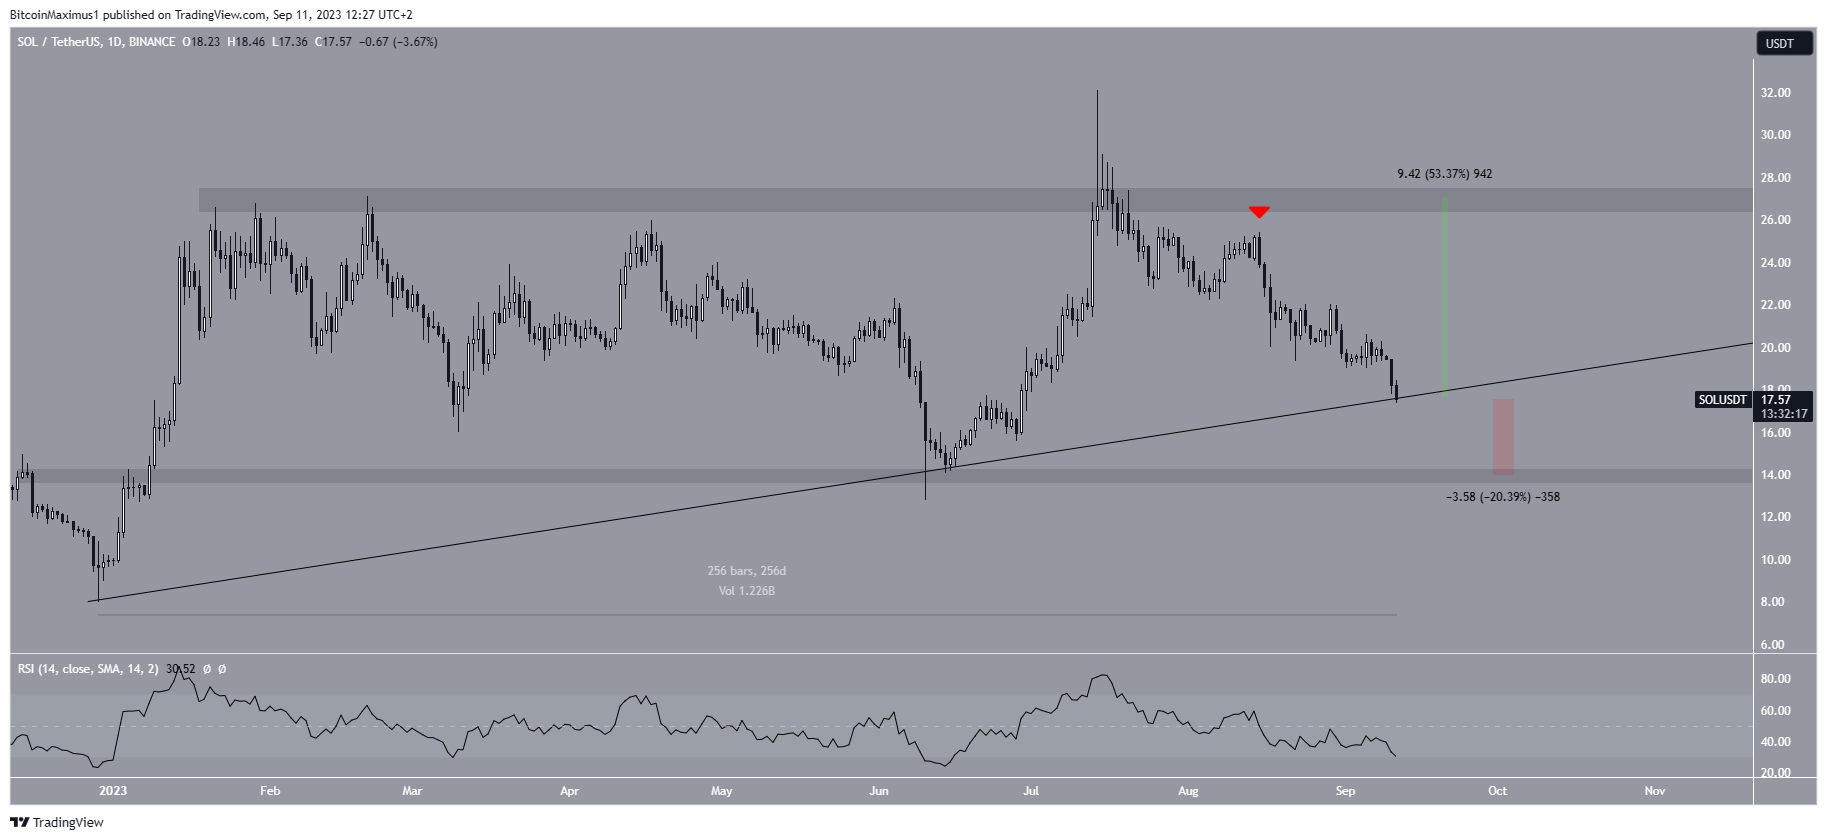
The daily RSI is bearish, suggesting that the price will break down. Market traders employ the RSI (Relative Strength Index) as a momentum indicator to detect overbought or oversold conditions in a market and make decisions regarding asset accumulation or selling.
Readings above 50 in conjunction with an upward trend suggest that bulls maintain an advantage, while readings below 50 indicate the opposite, signaling potential bearish conditions.
A 20% drop to the next closest support at $14 could occur if a breakdown occurs. On the other hand, a strong bounce can lead to a 50% increase that takes the price to the $27 resistance area.
Dogecoin (DOGE) Returns to Support After Rejection
The DOGE price had increased alongside an ascending support line since June 10. However, the price broke down from this line on August 15, indicating that the previous upward movement had ended. The breakdown led to a low of $0.055 on August 17.
The price bounced afterward, creating a very long lower wick (green icon) and reclaiming the $0.060 horizontal support area.
Despite the bounce, DOGE was rejected by the 0.382 Fib retracement resistance level at $0.066 (red circle). After the rejection, the price again fell to the $0.060 horizontal support area.
Similarly to SOL, the daily RSI is bearish. The indicator is below 50 and falling, both signs of a bearish trend.
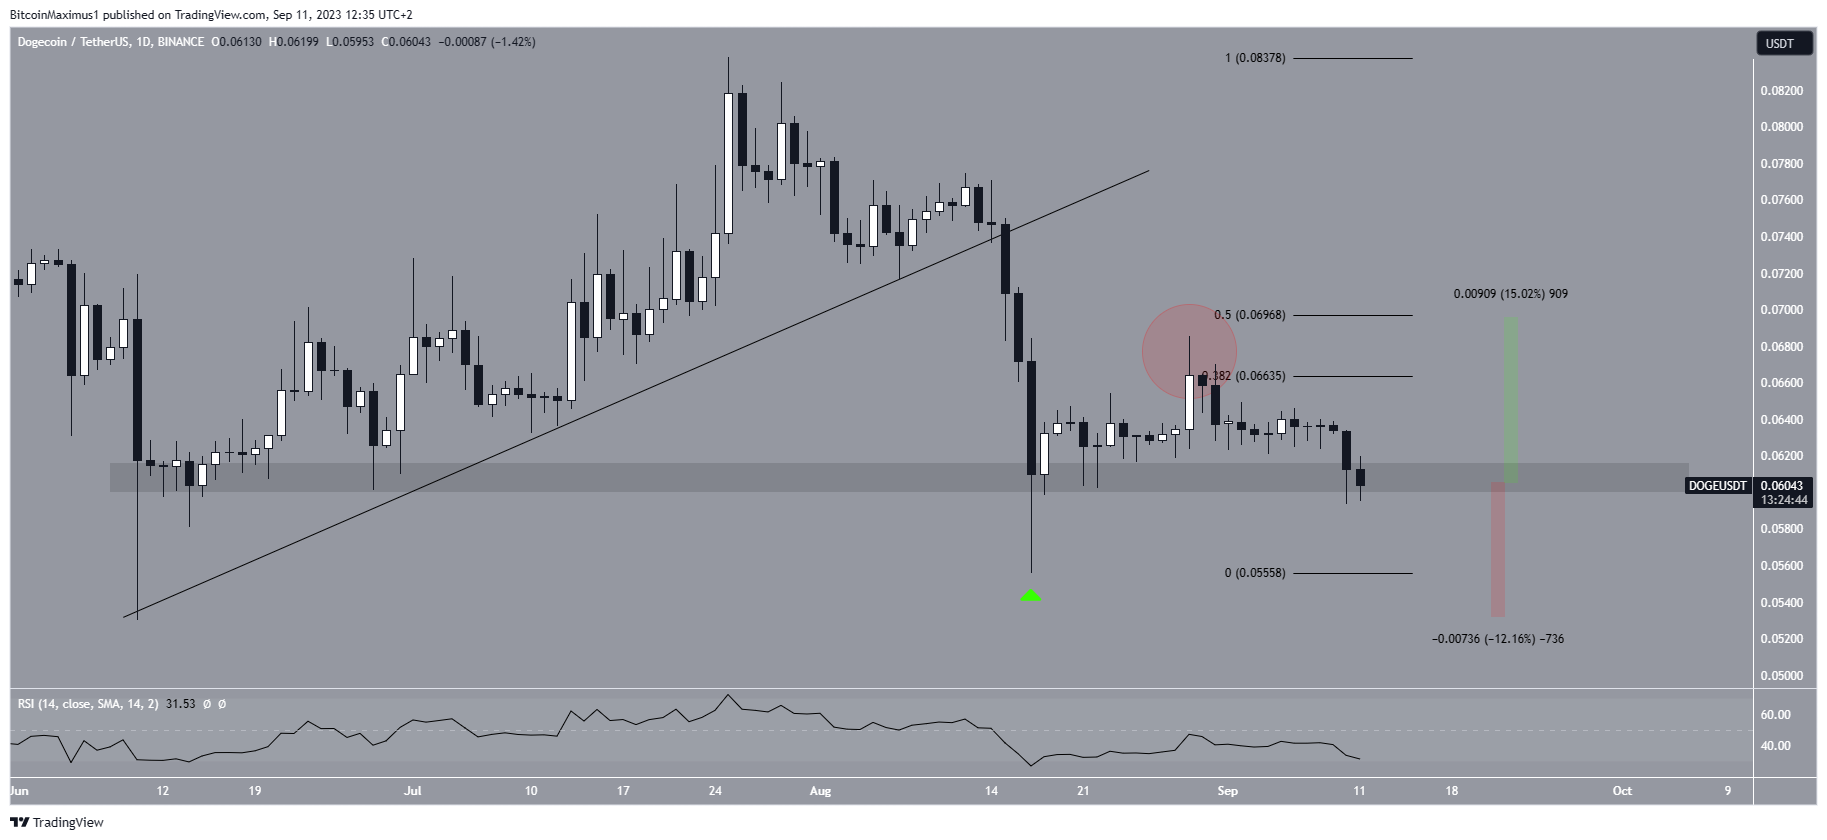
If DOGE breaks down, a 12% drop to the yearly low at $0.053 will be expected. On the other hand, if the movement regains momentum, the meme coin can increase to the 0.5 Fib retracement resistance level at $0.070.
Aptos (APT) Price Approaches Yearly Low
The APT price has fallen since its all-time high of $20.40 on January 24. Initially, the downward movement stopped on June 10 at a low of $5.40. The ensuing bounce (green icon) caused the price to reclaim the $5.80 horizontal area and validate it as support.
Read More: 9 Best Crypto Demo Accounts For Trading
However, the price failed to maintain the support area and broke down in September. Similarly to SOL and DOGE, the daily RSI Is bearish, showing no signs of an impending bullish trend reversal.
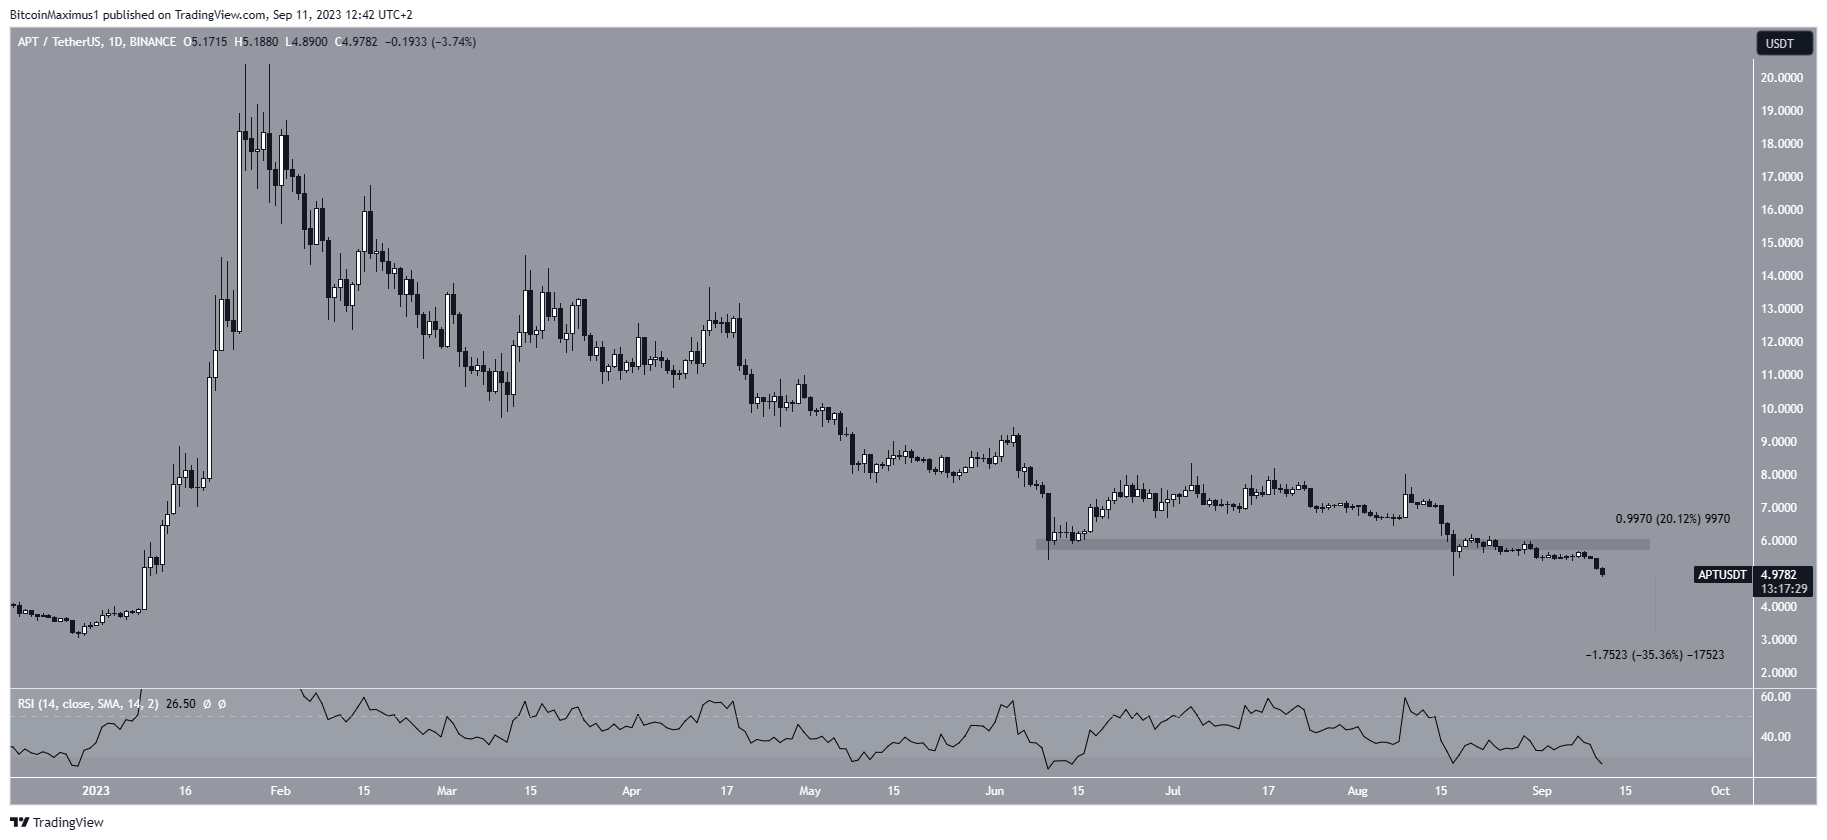
If the decrease continues, Aptos can fall by another 35% and reach its yearly low at $3.30. On the other hand, if a bullish reversal transpires, APT can increase by 20% and validate the $5.80 area, which is now expected to provide resistance.


