
Many crypto assets have noted exceptional rallies throughout March and April and have inched close to posting new all-time highs.
BeInCrypto analyzes the potential digital assets that could see another All-Time High (ATH) in May as the market enters the post-halving month.
BNB Is the Closest to Breaking a 3-Year-Old Record
BNB Coin, the native token of the world’s biggest crypto exchange, Binance, has been attempting to breach the previous ATH of $686. The last time BNB was at this price was nearly three years ago, in May 2021.
BNB has struggled to breach the $640 resistance level in the past two months and is presently trading at $612. However, according to the Relative Strength Index (RSI), there is room for further growth for the altcoin.
RSI measures the speed and change of price movements, indicating overbought (above 70) or oversold (below 30) conditions, aiding in assessing potential trend reversals. As long as BNB is under the overbought zone, it can continue rising.
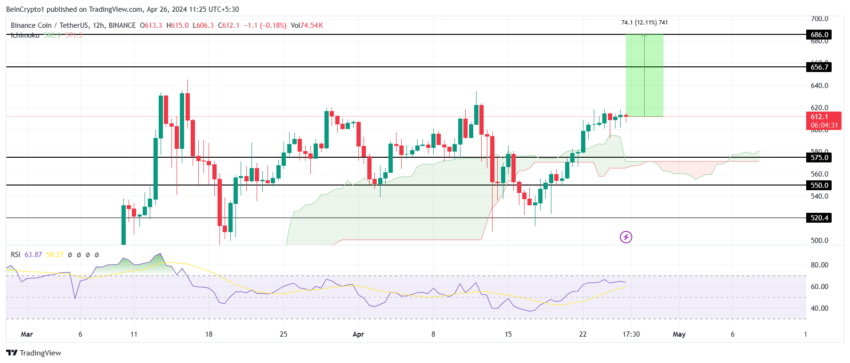
Standing a little over 12% away, BNB Coin has a fair shot at rallying in May.
Read More: Who Is Changpeng Zhao? A Deep Dive Into the Ex-CEO of Binance
However, BNB is vulnerable to corrections since the broader market cues are not explicitly bullish. If the exchange token falls through the support of $520, a bullish outcome would be invalidated.
Bitcoin (BTC) Is Still in the Game
Bitcoin price has been hovering around $70,000 and $65,000 since it posted a rally a month ago. Since then, the cryptocurrency has undergone one of the most anticipated and bullish events in the past four years – halving.
While BTC has not witnessed an immediate surge in value, the supply shock is expected to hit eventually. This would lead to Bitcoin’s price rallying beyond the ATH of $73,737, 14% away from the trading price of $64,530.
Read More: Bitcoin Halving History: Everything You Need To Know
On the larger timeframe, Bitcoin price is following the Wyckoff pattern, according to which the long-term projections for BTC are bullish. Thus, a rally would validate the pattern further.
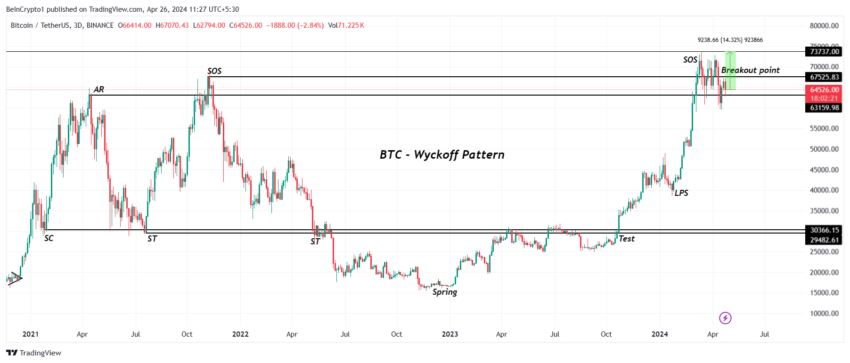
Nevertheless, should the bullishness dissipate before a new ATH is formed, Bitcoin price could fall below $60,000. This would invalidate the bullish outcome, leaving BTC vulnerable to further decline.
Bitget Token (BGB) Is Facing Two Resistances
Bitget Token price is largely focused on breaching through two crucial resistances in the way of posting a new ATH. Since charting the high of $1.38 at the beginning of April, BGB has been facing bearish woes.
As a result, the altcoin is presently trading at $1.19, 15% away from the ATH. This high could be breached if the crypto asset flips the $1.24 resistance into support and bounces off it to test $1.38.
The Moving Average Convergence Divergence (MACD) indicator suggests the same. MACD is a trend-following momentum indicator that shows the relationship between two moving averages. It is helpful in identifying potential buy and sell signals based on crossovers and divergences.
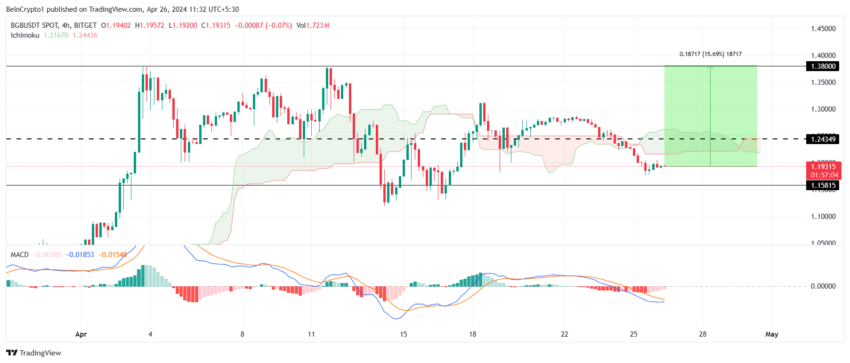
The indicator is at the cusp of a bullish crossover, meaning a bullish outcome for the cryptocurrency.
Read More: Crypto Portfolio Management: A Beginner’s Guide
However, if the support of $1.15 is broken, the bullish thesis would be invalidated, pushing BGB farther away from a new ATH.
Ondo (ONDO) Needs to Break the Consolidation
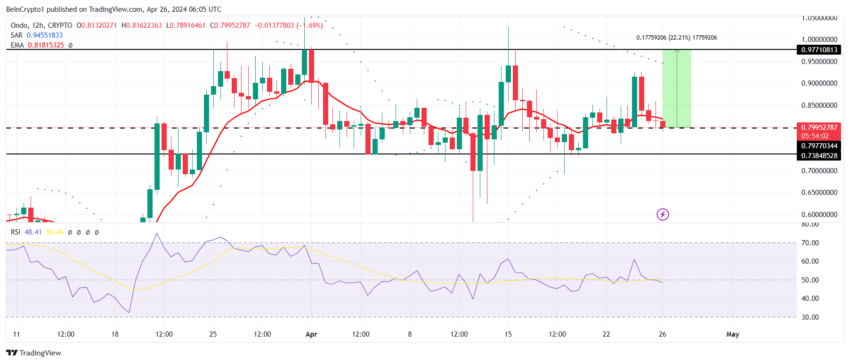
Ondo price has been stuck in consolidation for the past month and a half, trading at $0.799 at the moment. The altcoin is just at the support of $0.797, and bouncing off of it would enable a rise back to the ATH of $0.977. This would mark a potential 22% increase.
The RSI, present above the neutral line of 50.0, indicates bullish support for the altcoin, as it hints at potential room for growth.
Read More: What Are Cryptocurrency Exchange-Traded Notes (ETNs)?
However, if the support of $0.797 is broken and ONDO falls to and below $0.738, the bullish thesis would be completely invalidated. This would push the altcoin below $0.700.
Trusted
Disclaimer
In line with the Trust Project guidelines, this price analysis article is for informational purposes only and should not be considered financial or investment advice. BeInCrypto is committed to accurate, unbiased reporting, but market conditions are subject to change without notice. Always conduct your own research and consult with a professional before making any financial decisions. Please note that our Terms and Conditions, Privacy Policy, and Disclaimers have been updated.