

The Bitcoin price did not continue its decrease from April 20, rather consolidating the next day. However, it has fallen inside the previous trading range, which is a strong bearish indication.
The unprecedented issuance of fiat money by the fed has raised concerns. It is worth mentioning that the Tether Treasury has also ramped-up its USDT issuance, printing more than $1 billion in Tether over the past 25 days alone, amounting to $40 million per day on average. However, volume has remained around the same levels despite this increase in issuance.
In this article, we will take a look at the price movement for 10 cryptocurrencies and analyze their future outlook.
Bitcoin (BTC)
The Bitcoin price has been trading in a range between $6,650 and $7,200 since April 3. At the time of writing, it was trading right at the midpoint (EQ) of this range at $6,900. The price is facing very close resistance from the 50-hour moving average (MA), which has just made a bearish cross along the 200-hour one. The same cross occurred on April 11. Interestingly, the price was also below the EQ at the time, facing resistance both from it and the 50-hour MA. Afterward, the price broke out, validated the resistance line and dropped sharply towards support. If the same movement occurred this time, the price will break out above both the MA and the EQ later today, heading towards the resistance line, before dropping sharply towards support. A movement above the resistance of the range would invalidate the fractal. At the time of writing, this seems unlikely.
Ethereum (ETH)
The Ethereum price has been decreasing since April 19, when it reached a high of $178.89. The downward move has been transpiring alongside a descending resistance line, which has been validated thrice. On April 16, the price reached a low of $166.13, only to bounce back above the $170 area one more time. Since then, the price has been following an ascending channel. The channel and the previously mentioned descending resistance line coincide with each other at $178, making it a very likely level to initiate a trend reversal. This proposed movement would also serve as the right shoulder of a head and shoulders pattern, which is considered a bearish reversal pattern. If the price completes this pattern, it is expected to break down and reach the support line of the long-term ascending channel at $160.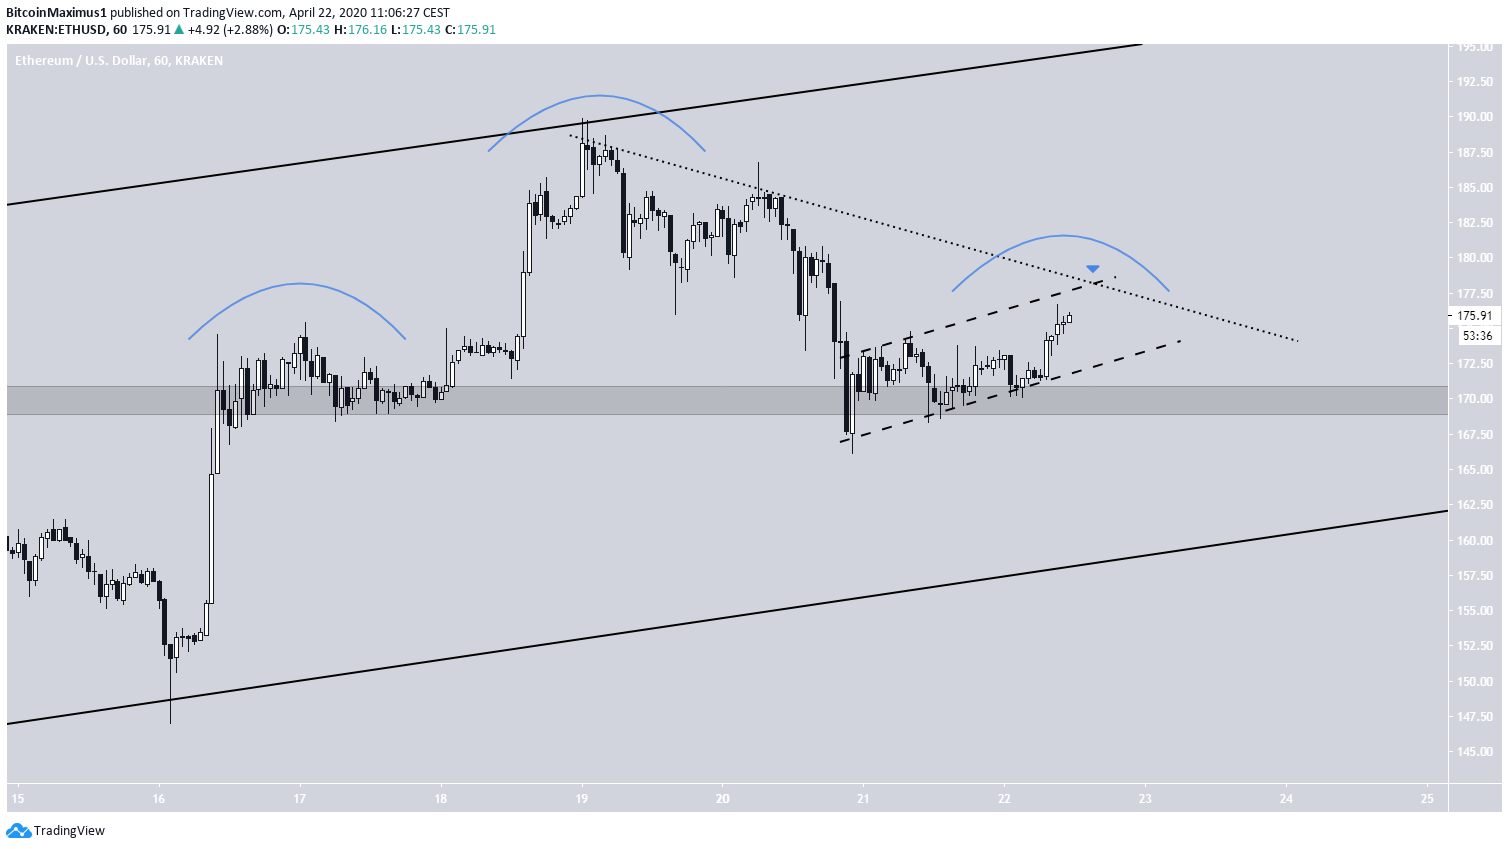
XRP (XRP)
The XRP price is trading slightly above the $0.18 support area. It has been decreasing since reaching a high of $0.205 on April 7. The price broke out from a descending resistance line on April 16. After continuing to increase for a short period of time, the price dropped sharply and validated the line as support, along with the $0.18 support area. This is a customary movement after breakouts and often leads to continuation. Therefore, the price is expected to increase towards the next resistance area at $0.194 and possibly $0.205, which was the level of the high that initiated the descending resistance line.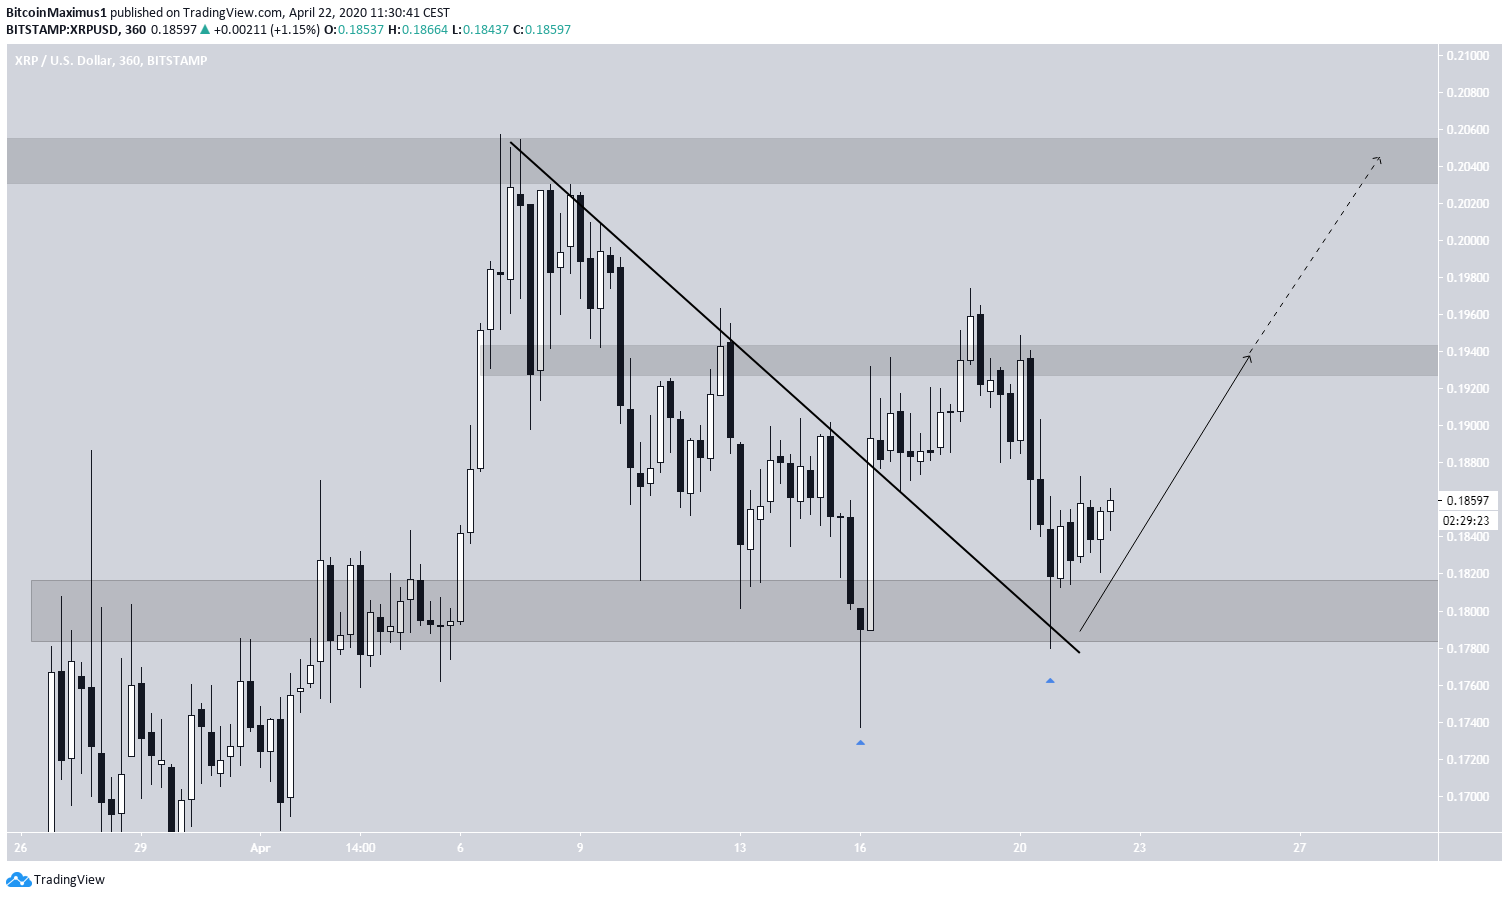
Bitcoin Cash (BCH)
On April 20, the BCH price broke down from a head and shoulders pattern. After validating the breakdown level, the price continued its descent, reaching a low of $215.74 the same day. Since then, BCH has been gradually increasing, moving inside an ascending triangle. The ascending triangle is considered a bullish pattern, therefore a breakout is likely. This possibility is further strengthened by the hourly RSI, which has moved above 50. If the breakout commences, the price is likely to reach $230 before decreasing once more.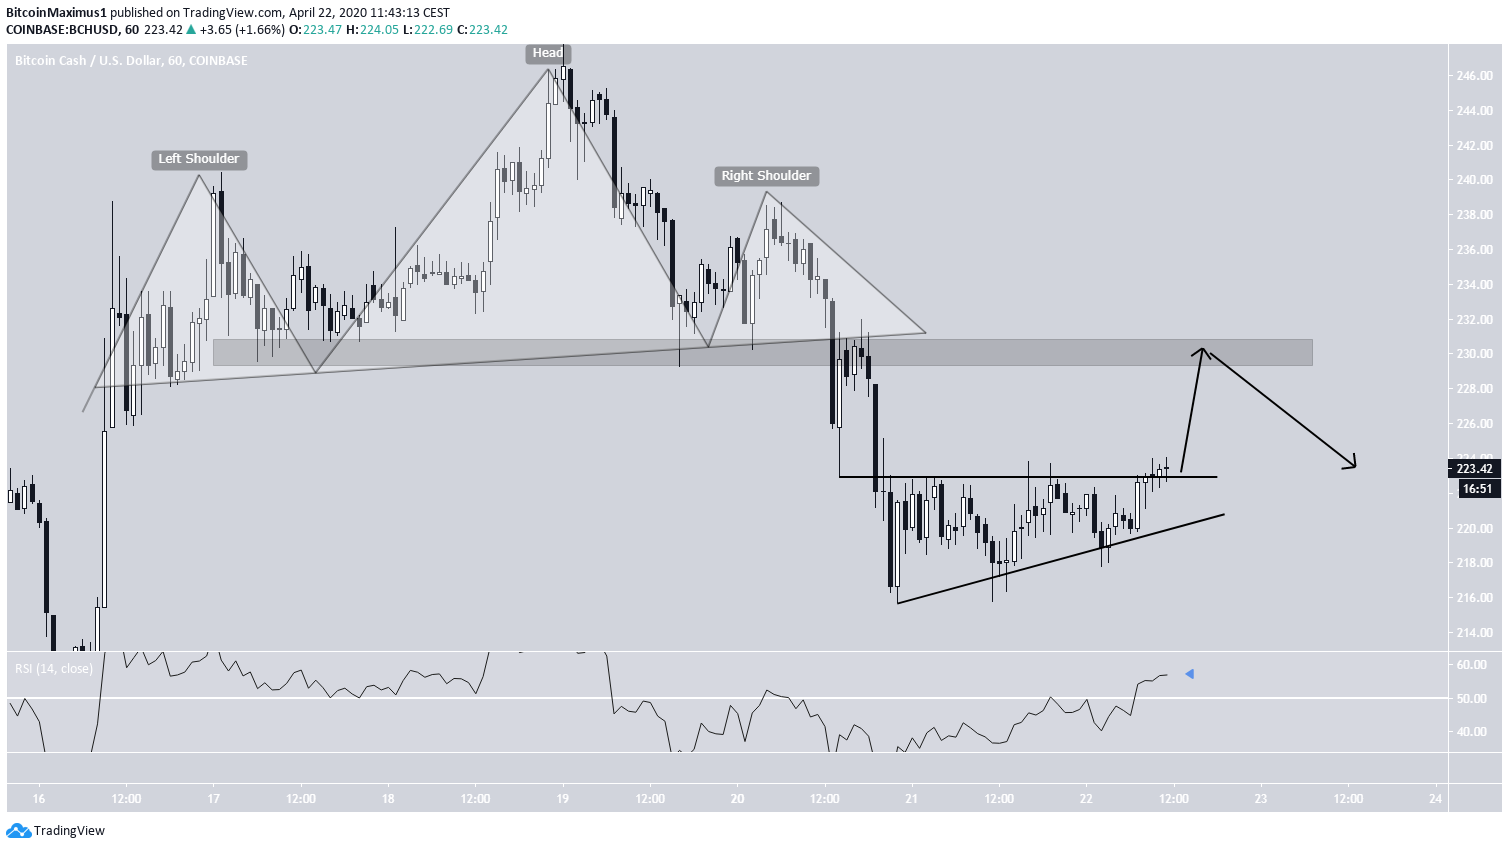
Bitcoin SV (BSV)
The BSV price has been following a descending resistance line since Feb. 26, having validated it five times until now. The price was rejected by this line on April 19 and has been decreasing since. At the time of writing, the price was trading slightly above the main support area of $180. Along with the descending resistance line, this area creates a descending triangle, which is considered a bearish reversal pattern. Therefore, the most likely movement would be a re-test of the descending resistance line followed by a downward move towards the $180 support once more.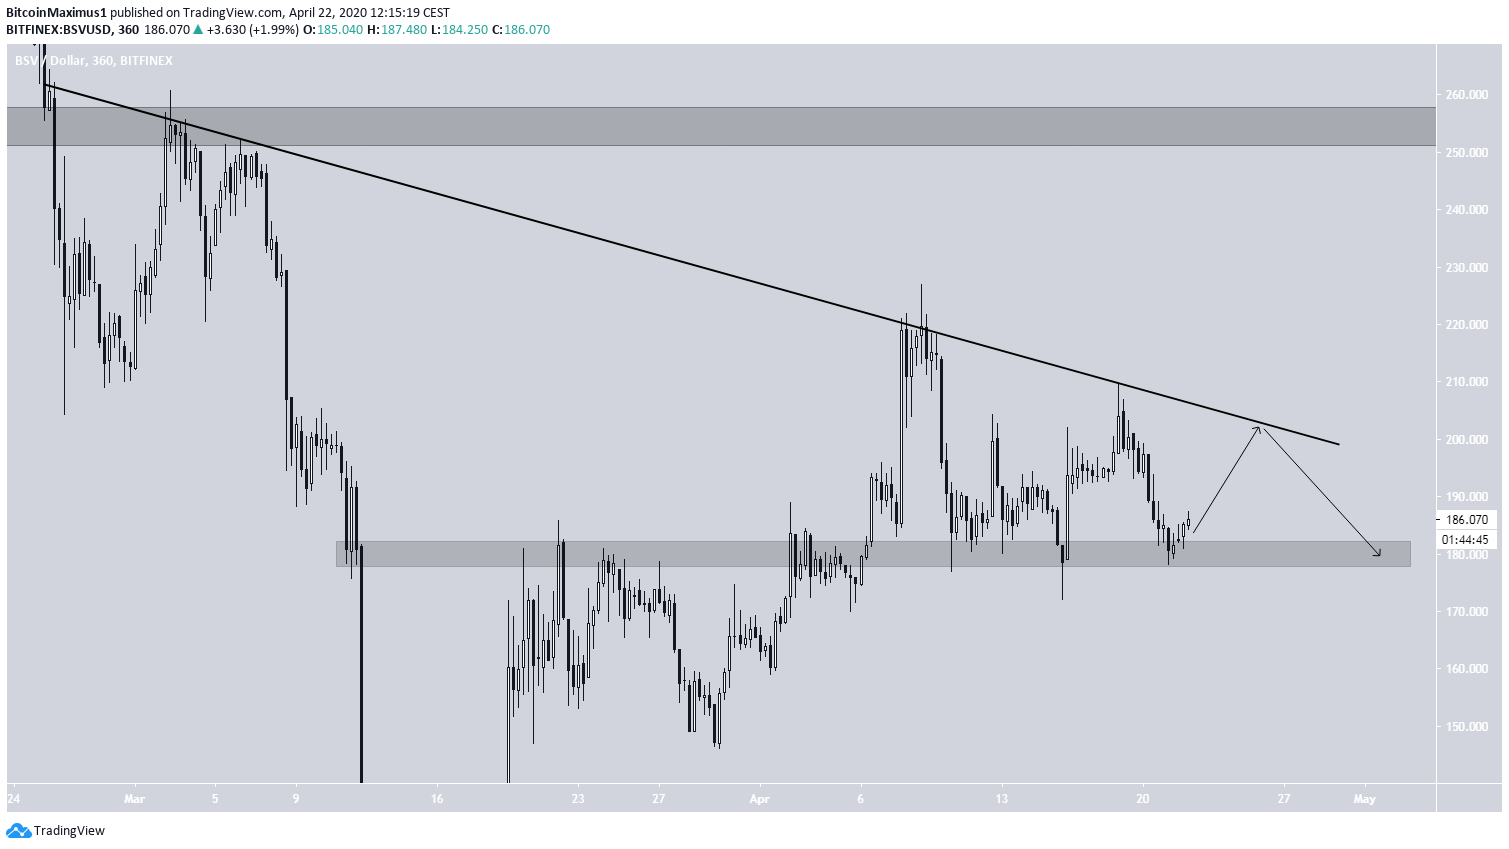
Litecoin (LTC)
The LTC price is trading inside a range between $39.5 and $44 and has been doing so since April 11. At the time of writing, the price was trading between the support and the midpoint of the range, being much closer to the latter. A breakout above it would likely cause an upward move towards the resistance line. However, that seems unlikely for two main reasons. First, the 200-hour MA also coincides with the range EQ, strengthening the current overhead resistance. In addition, the RSI is approaching the 50 line from below, which could cause a rejection. Therefore, the most likely movement remains a re-test of the EQ followed by a downward move towards support.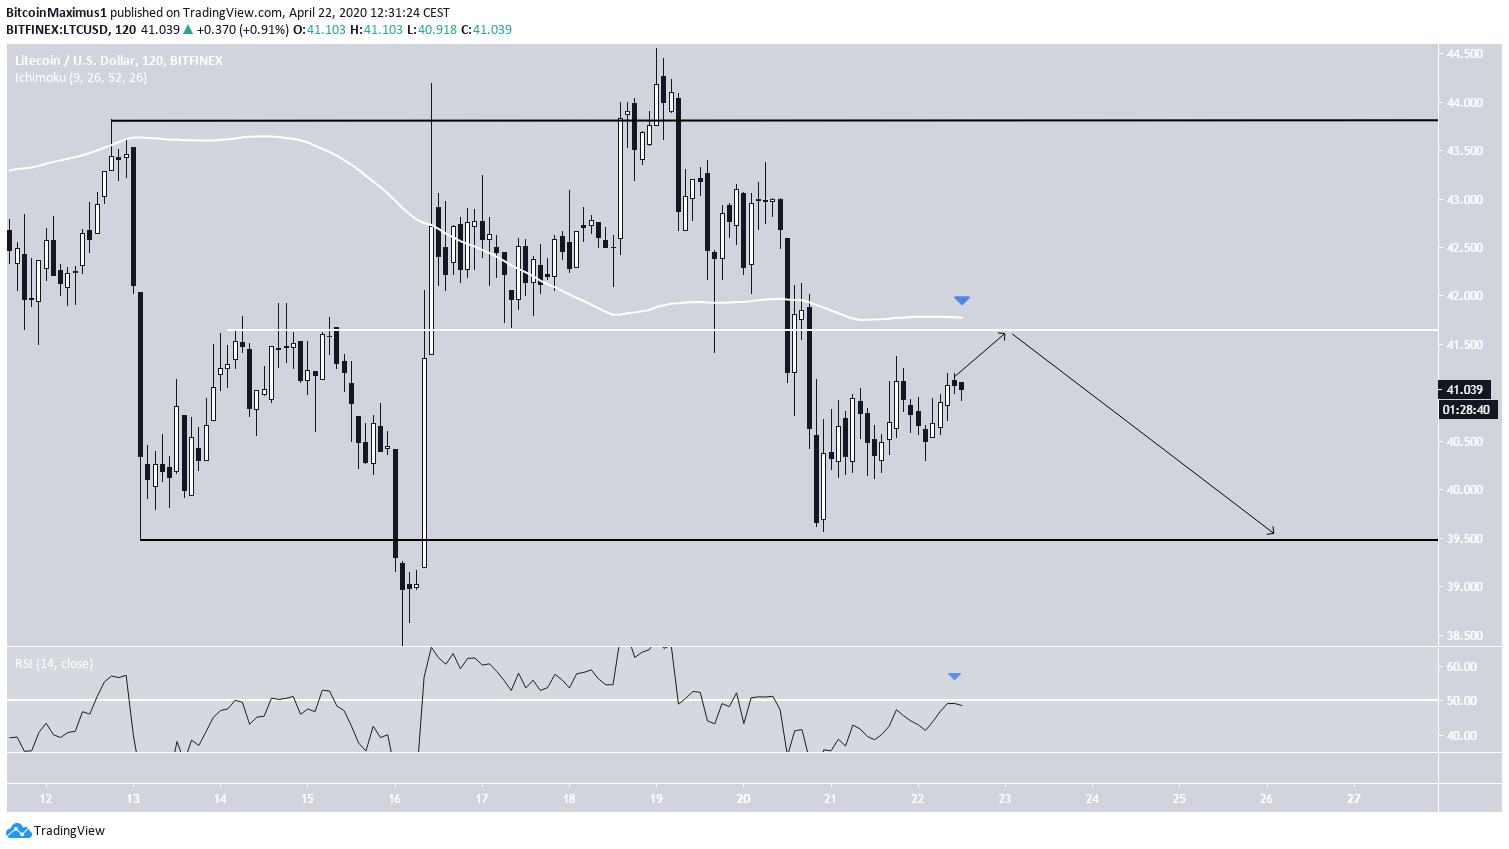
Binance Coin (BNB)
The BNB price has been trading inside an ascending wedge since March 13. On April 18, the price reached a high of $16.8 and began a downward move that is still ongoing. Four days later, the price broke down from the ascending wedge and is currently in the process of validating it as resistance. The breakdown was preceded by a very significant bearish divergence in the RSI, a sign that increases its legitimacy. Therefore, the price is expected to continue decreasing, at least until it reaches the closest support area at $13.7.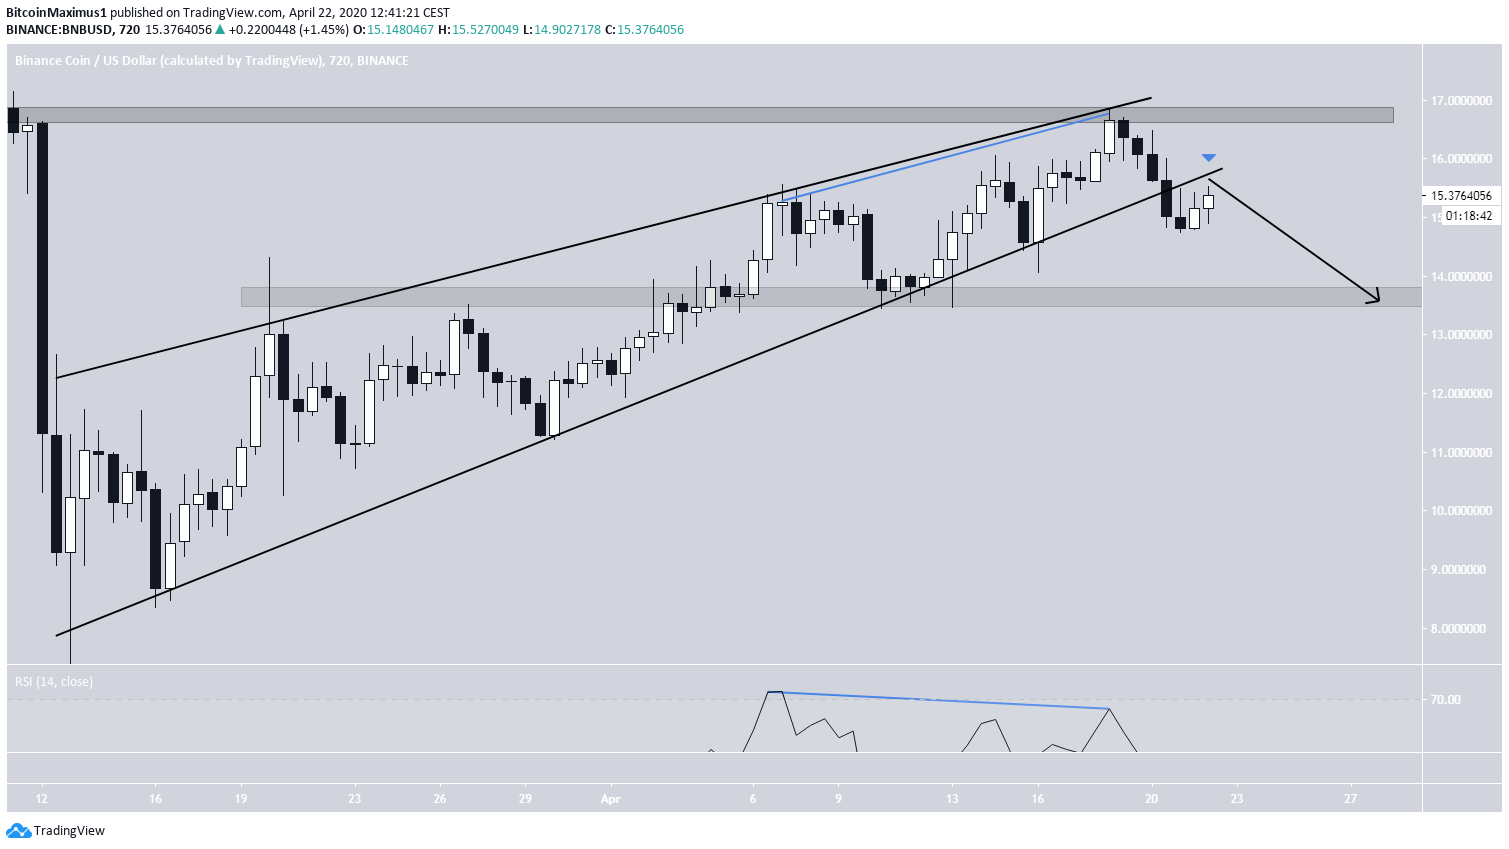
EOS (EOS)
The EOS price has been following an ascending support line since March 13, having validated it numerous times, most recently on April 20. However, the price has created a double top at $2.8, which was combined with bearish divergence. This preceded the downward move that caused the price to validate the ascending support line. Due to the fact that the support line also coincided with the $2.4 area, it is likely that such a strong support level initiates an upward move towards the $2.8 area once more. The reaction once the price gets there will determine whether the price breaks out and continues towards the next resistance area at $3.1 or falls back towards the ascending support line, possibly breaking down. The bearish scenario is slightly more likely, due to the aforementioned bearish divergence and possible bearishness in the BTC price.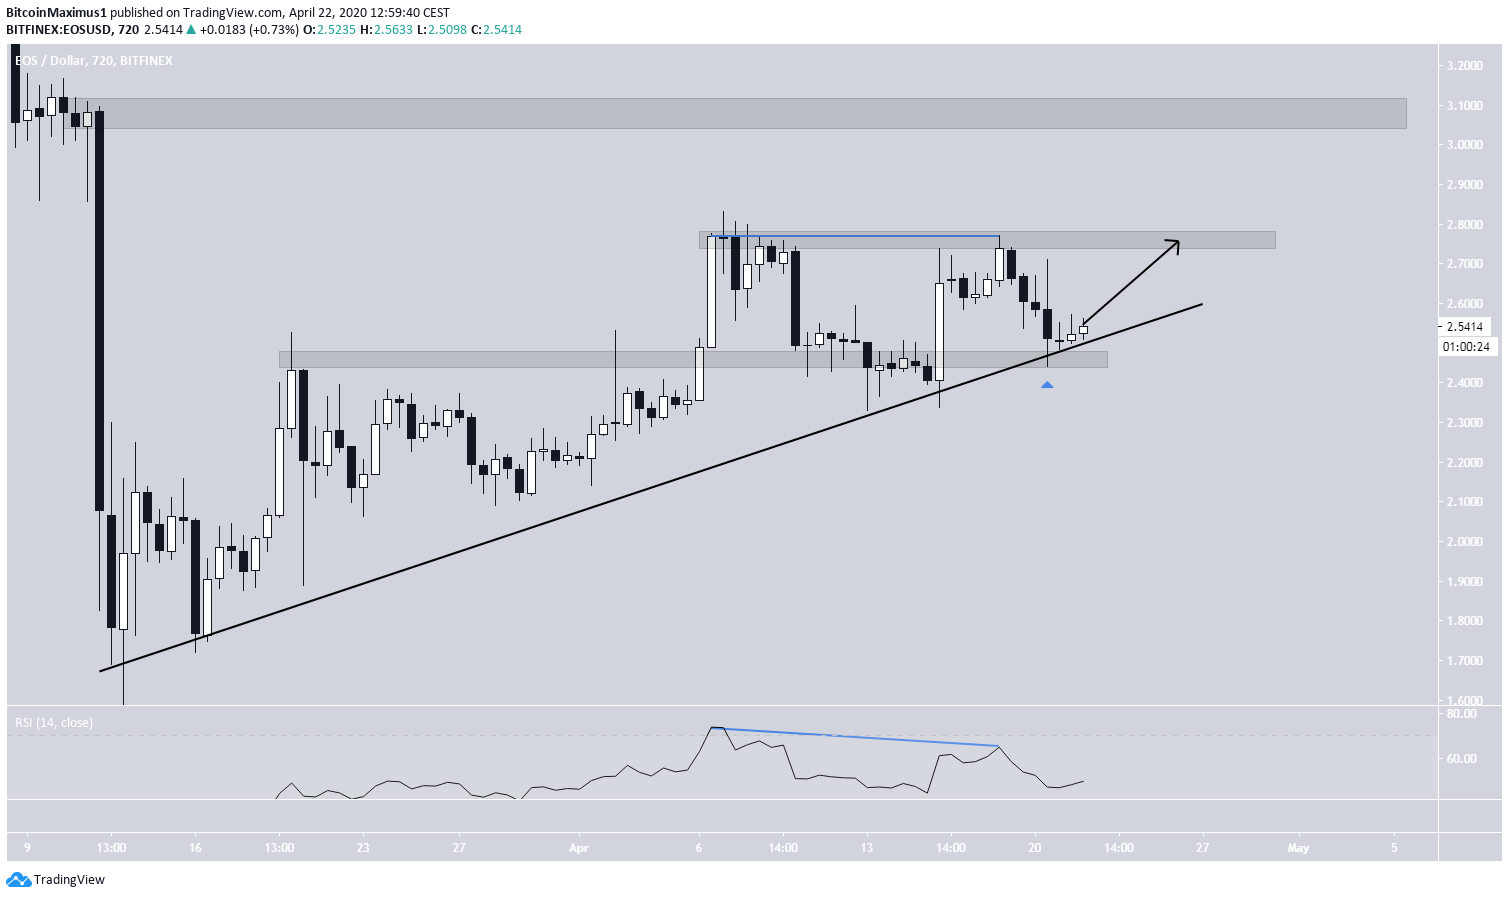
Tezos (XTZ)
The Tezos price has been increasing gradually inside an ascending channel since reaching its low on March 13, having validated both the resistance and support lines numerous times. At the time of writing, the price was trading right at the resistance line of this channel. In addition, the current resistance is strengthened by the descending resistance line in place since Feb. 20, which is coinciding with the resistance line of the channel. Since there is no bearish divergence to indicate the opposite, the XTZ price is likely to break out above this descending resistance line and reach the next resistance area, which is found at $2.55.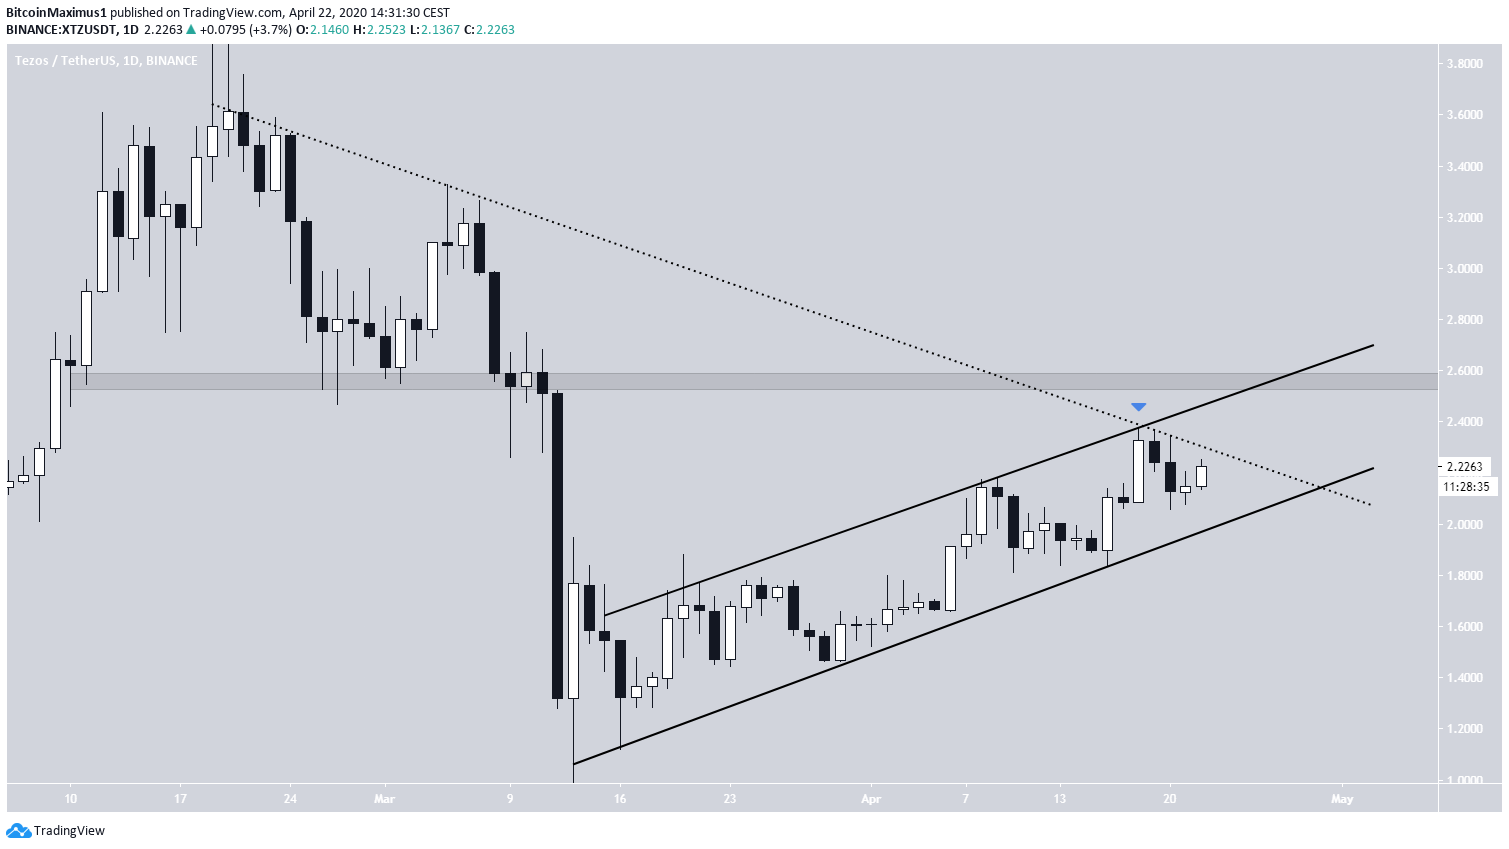
Chainlink (LINK)
The LINK price has been increasing gradually since March 13, following an ascending support line. The increase continued until April 18, when the price reached a high of $3.81. This high was combined with very significant bearish divergence in the RSI. The price has been decreasing since. The significant bearish divergence adds to the legitimacy of the downward move and suggests that the price will head downwards. If it begins doing so, the closest support area is found at $3. Since it also coincides with the previously mentioned long-term ascending support line, this would be a very likely level for the price to bounce upwards.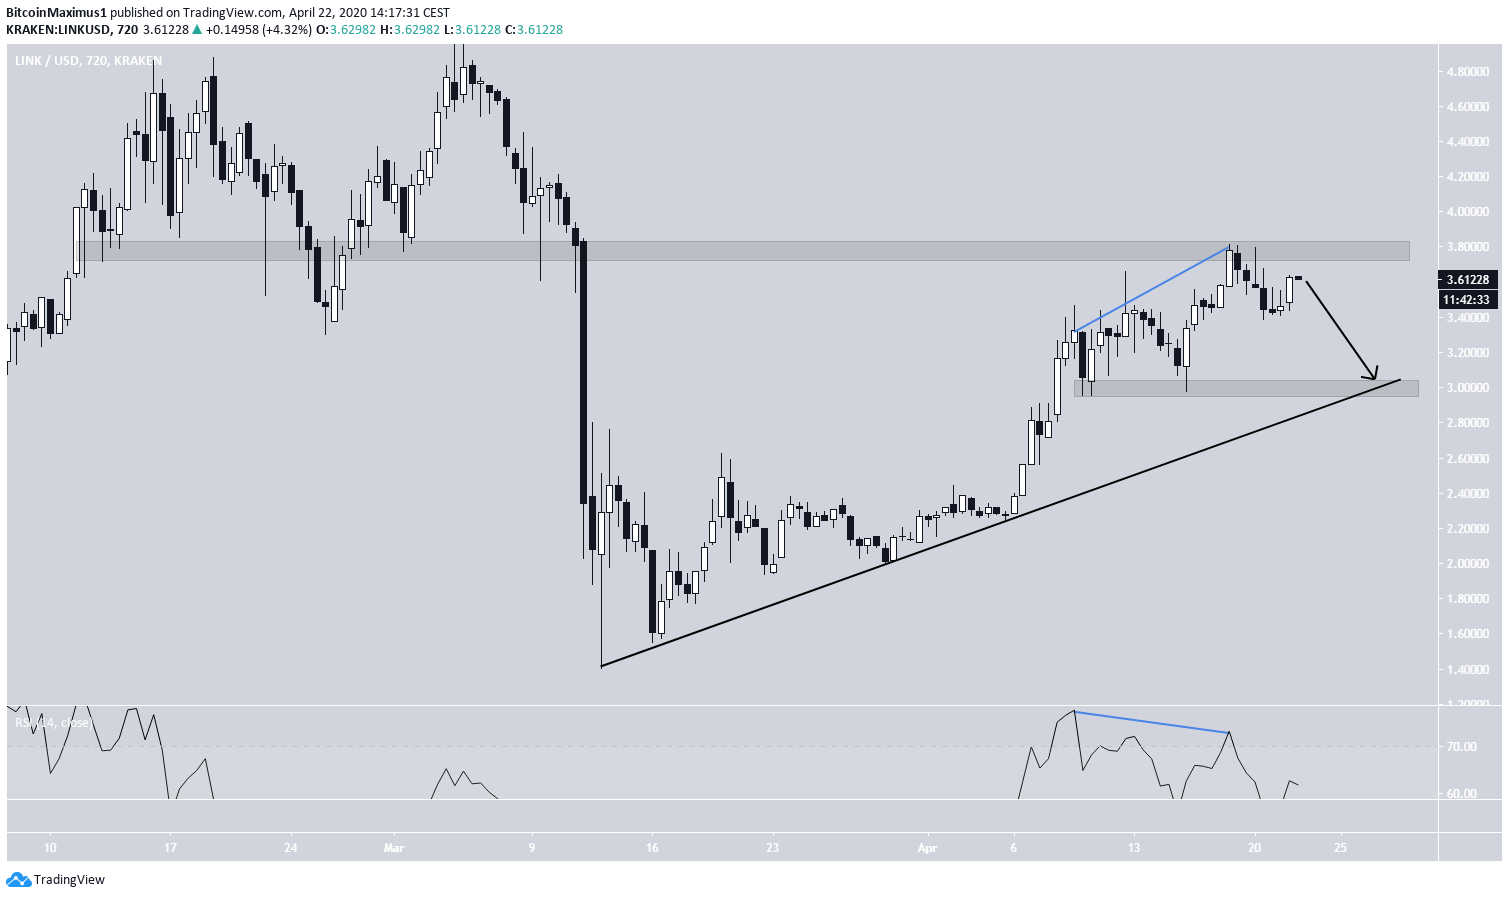
Disclaimer
In line with the Trust Project guidelines, this price analysis article is for informational purposes only and should not be considered financial or investment advice. BeInCrypto is committed to accurate, unbiased reporting, but market conditions are subject to change without notice. Always conduct your own research and consult with a professional before making any financial decisions. Please note that our Terms and Conditions, Privacy Policy, and Disclaimers have been updated.

Valdrin Tahiri
Valdrin discovered cryptocurrencies while he was getting his MSc in Financial Markets from the Barcelona School of Economics. Shortly after graduating, he began writing for several different cryptocurrency related websites as a freelancer before eventually taking on the role of BeInCrypto's Senior Analyst.
(I do not have a discord and will not contact you first there. Beware of scammers)
READ FULL BIO
Sponsored
Sponsored