

On April 21, the BTC price did not continue the downward movement that it had begun the previous day. The price consolidated between $6,762 and $6,940, creating a Doji candlestick in the process.
The entire price movement occurred below the midpoint (EQ) of the trading range of $6,650 and $7150. At the time of writing, the price was trading right at the EQ, making this its third attempt at breaking out.
Bitcoin Fractal
The price is facing resistance from its 50-hour moving average (MA), which has just made a bearish cross with the 200-hour MA. The same cross occurred on April 11 and provided resistance to the price at the EQ of the range. The breakout from the EQ occurred one day after the aforementioned bearish cross. If the same amount of time is required for the price to break out this time around, we could see a breakout on the evening of April 22.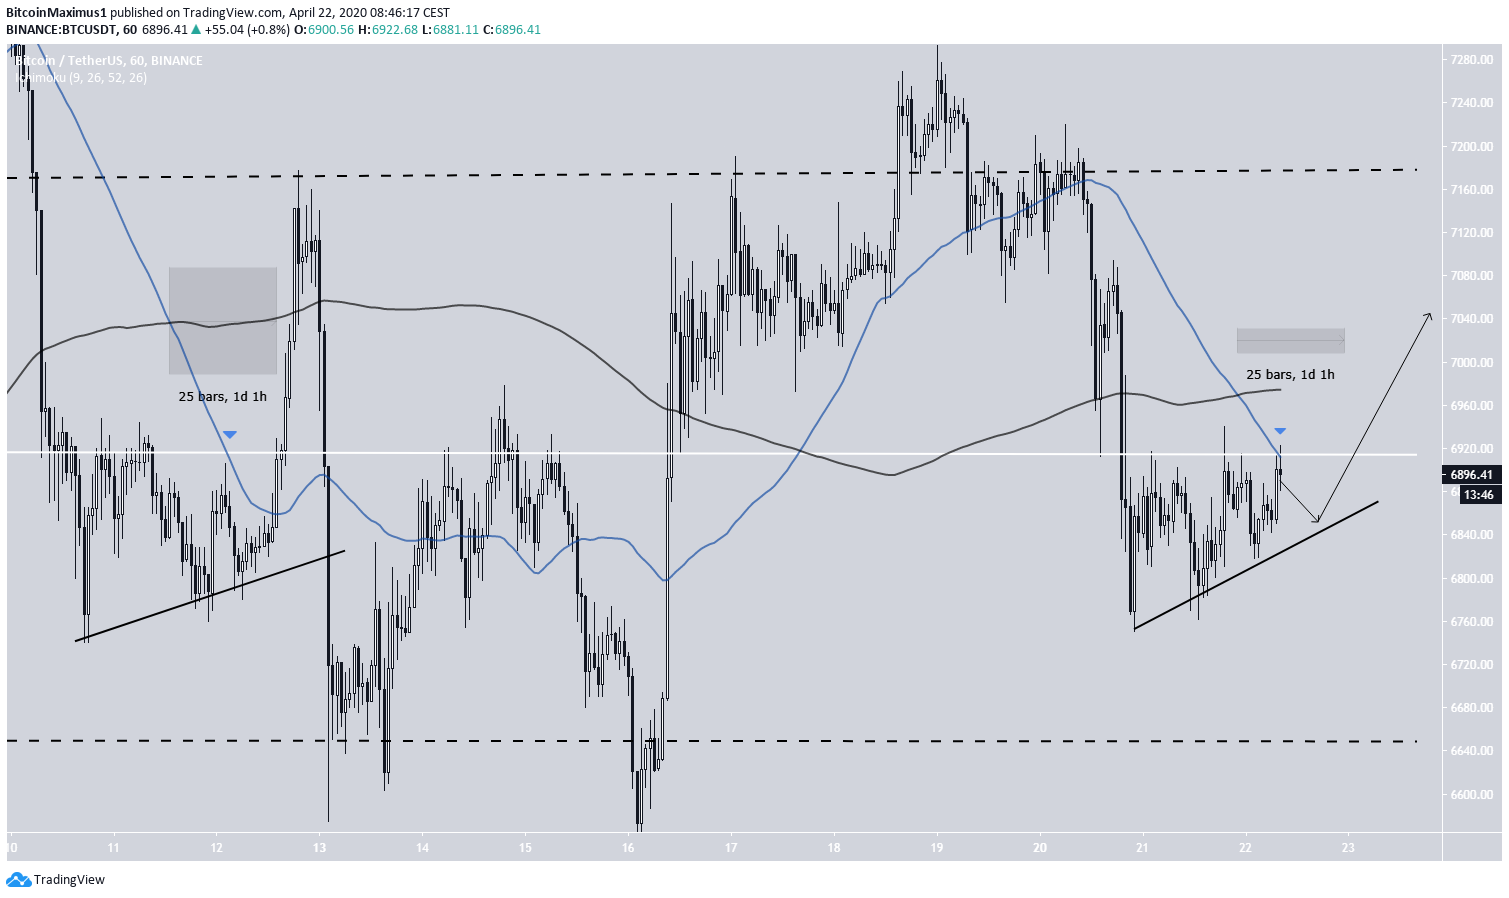
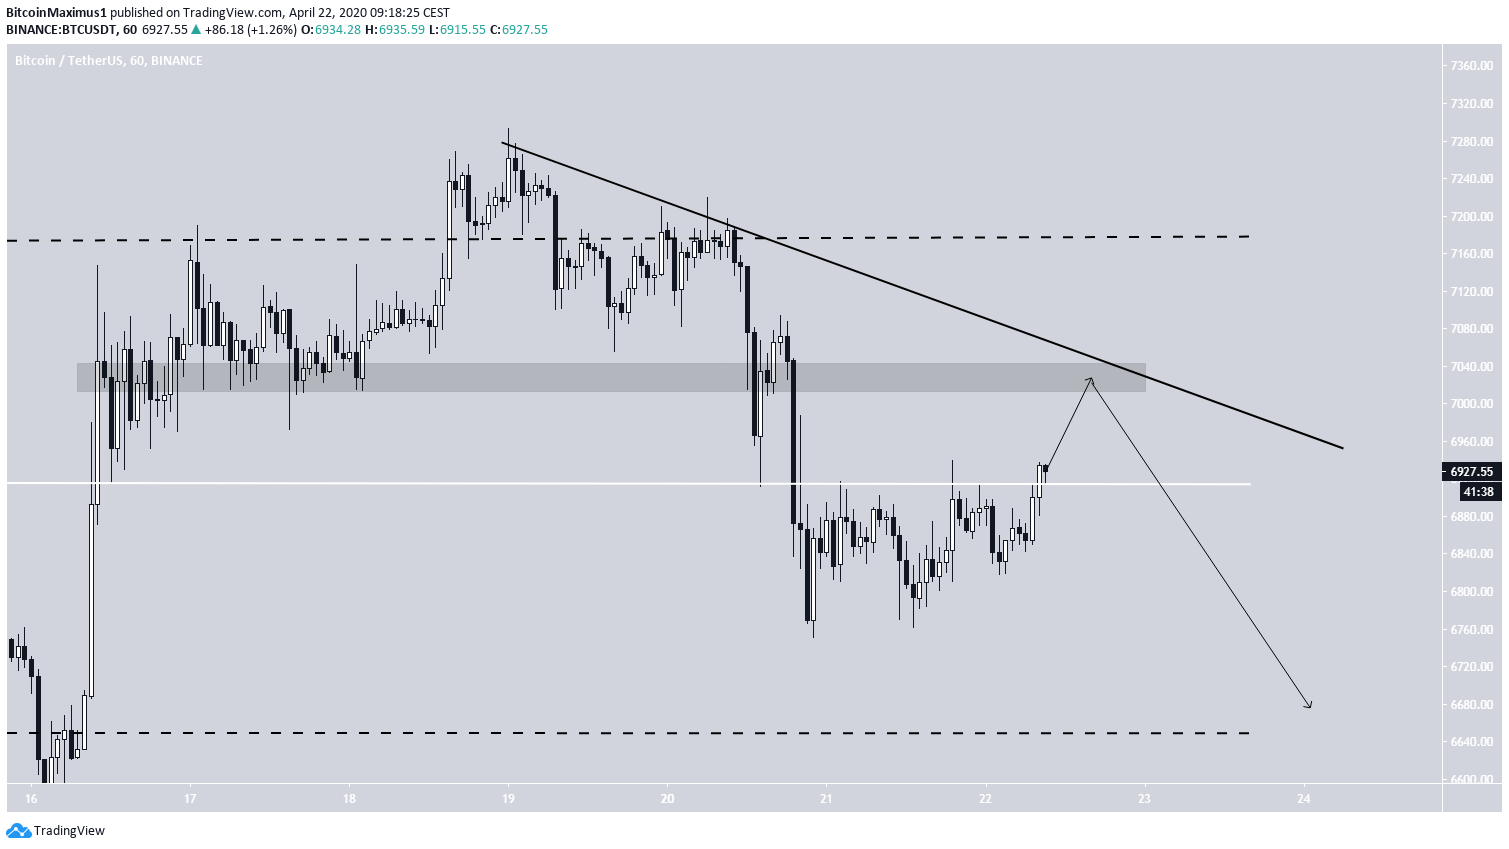
Trading Range
The movement that is projected would cause the BTC price to move above its longer-term range of $5,700-$6,900 once more. After that, the price could decrease towards the EQ of the range near $6,300. The more bearish scenario (dashed) has the price decreasing all the way to $5,700, validating both the descending resistance line that the price has broken out from and the support line of the range. While this is a very sharp drop, it is not uncommon for an asset to behave in this way after a failed breakout and re-entering of a previous range.
Top crypto platforms in the US
Disclaimer
In line with the Trust Project guidelines, this price analysis article is for informational purposes only and should not be considered financial or investment advice. BeInCrypto is committed to accurate, unbiased reporting, but market conditions are subject to change without notice. Always conduct your own research and consult with a professional before making any financial decisions. Please note that our Terms and Conditions, Privacy Policy, and Disclaimers have been updated.

Valdrin Tahiri
Valdrin discovered cryptocurrencies while he was getting his MSc in Financial Markets from the Barcelona School of Economics. Shortly after graduating, he began writing for several different cryptocurrency related websites as a freelancer before eventually taking on the role of BeInCrypto's Senior Analyst.
(I do not have a discord and will not contact you first there. Beware of scammers)
READ FULL BIO
Sponsored
Sponsored