


COTI (COTI) has been increasing alongside an ascending support line since it reached a bottom on Nov. 3.
Nevertheless, COTI is expected to break down from this line and drop towards the support levels outlined below.
COTI Increases Alongside Support
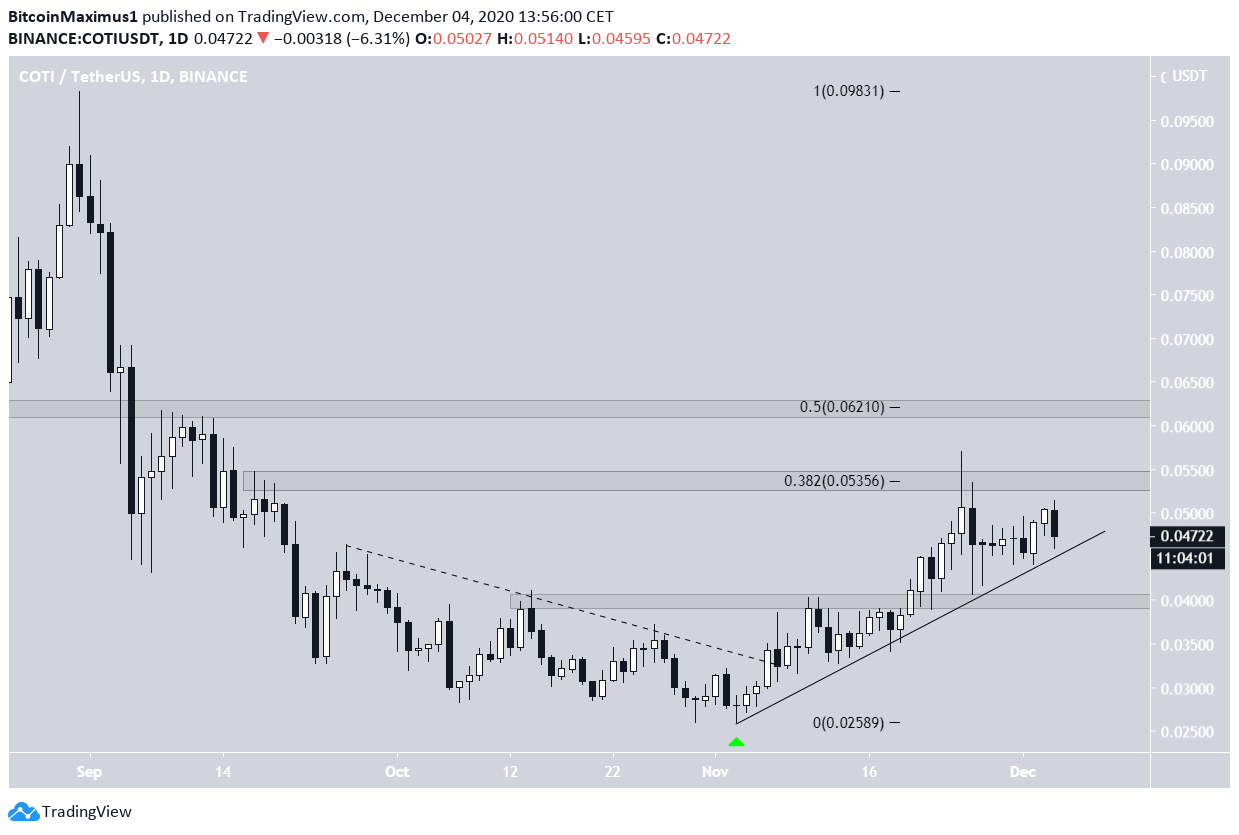
The COTI price has been moving upwards since Nov. 3, when it reached a low of $0.025. Since then, COTI has been following an ascending support line, validating it numerous times in the process.
While COTI broke out above the $0.04 resistance area and validated it as support afterward, it was rejected by the 0.382 Fib resistance level at $0.053 and has fallen back below since.
Currently, COTI is approaching the point of convergence between the ascending support line and the $0.053 resistance area, at which point a decisive move should occur.
A breakout could take the price towards $0.062 while a breakdown might cause it to fall back down to $0.04.
Future Movement
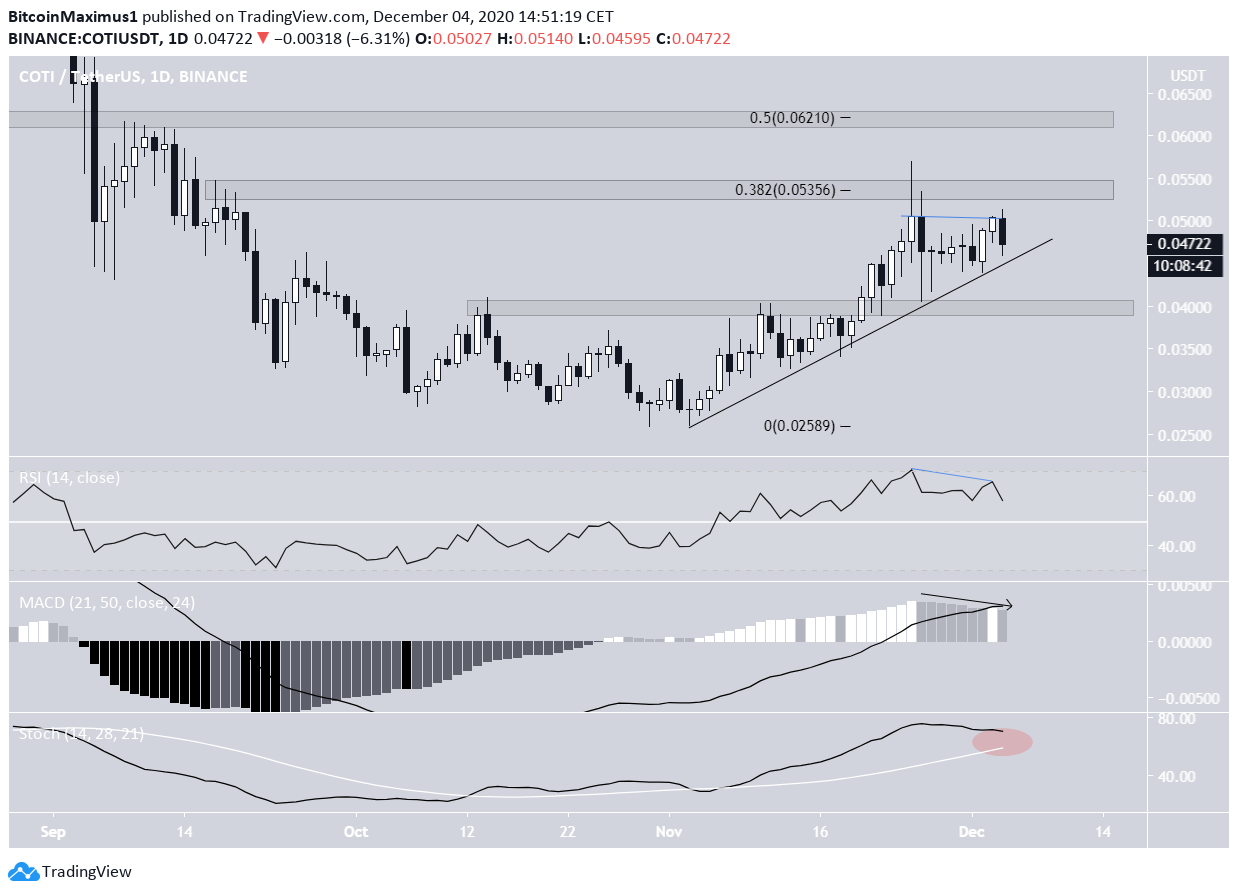
Technical indicators in the daily time-frame are leaning on being bearish.
- The RSI has generated a bearish divergence and is decreasing
- The MACD is decreasing but still positive.
- The Stochastic oscillator is moving downwards but has not yet made a bearish cross.
A breakdown from the ascending support line would likely cause the MACD to drop into negative territory and the Stochastic oscillator to make a bearish cross.
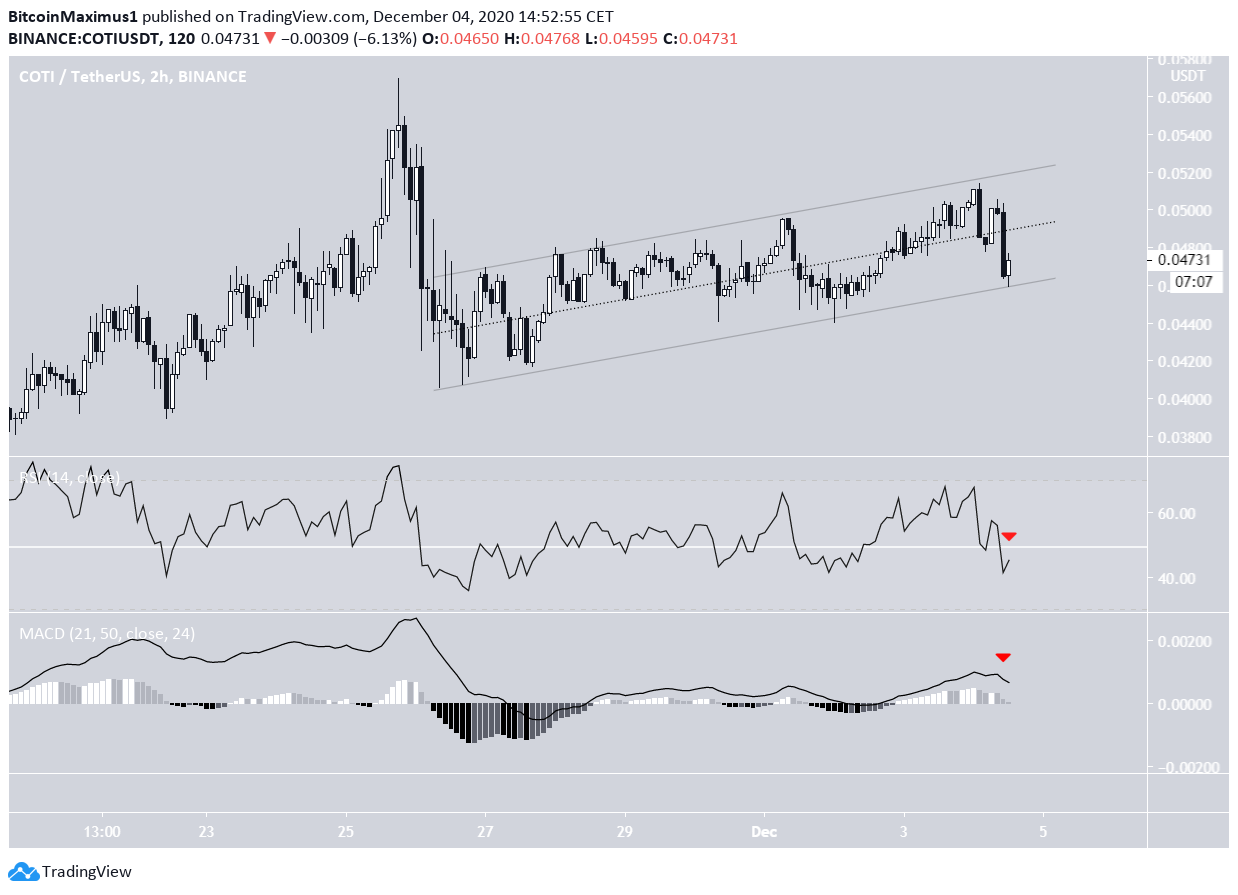
The two-hour chart also supports the possibility of this drop.
COTI is trading inside a parallel ascending channel, which is likely to be a corrective movement. COTI is currently trading at the support line of this channel, and both the MACD and RSI support a potential breakdown below it.
If a breakdown does occur, it would likely take COTI towards $0.04.
Long-Term Implications
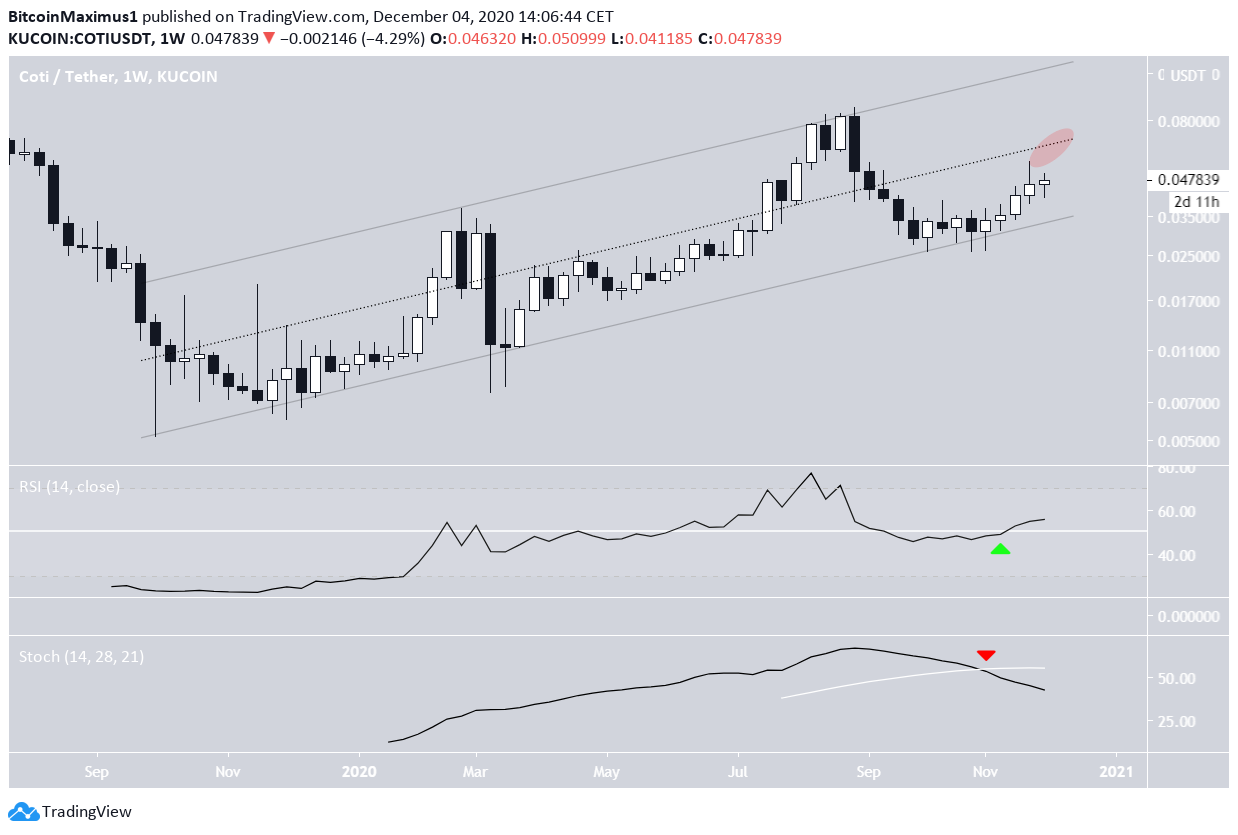
Cryptocurrency trader @Mesawine1 outlined a COTI chart that shows the price is trading inside a parallel ascending channel. This is a pattern that COTI has traded in since October 2019.
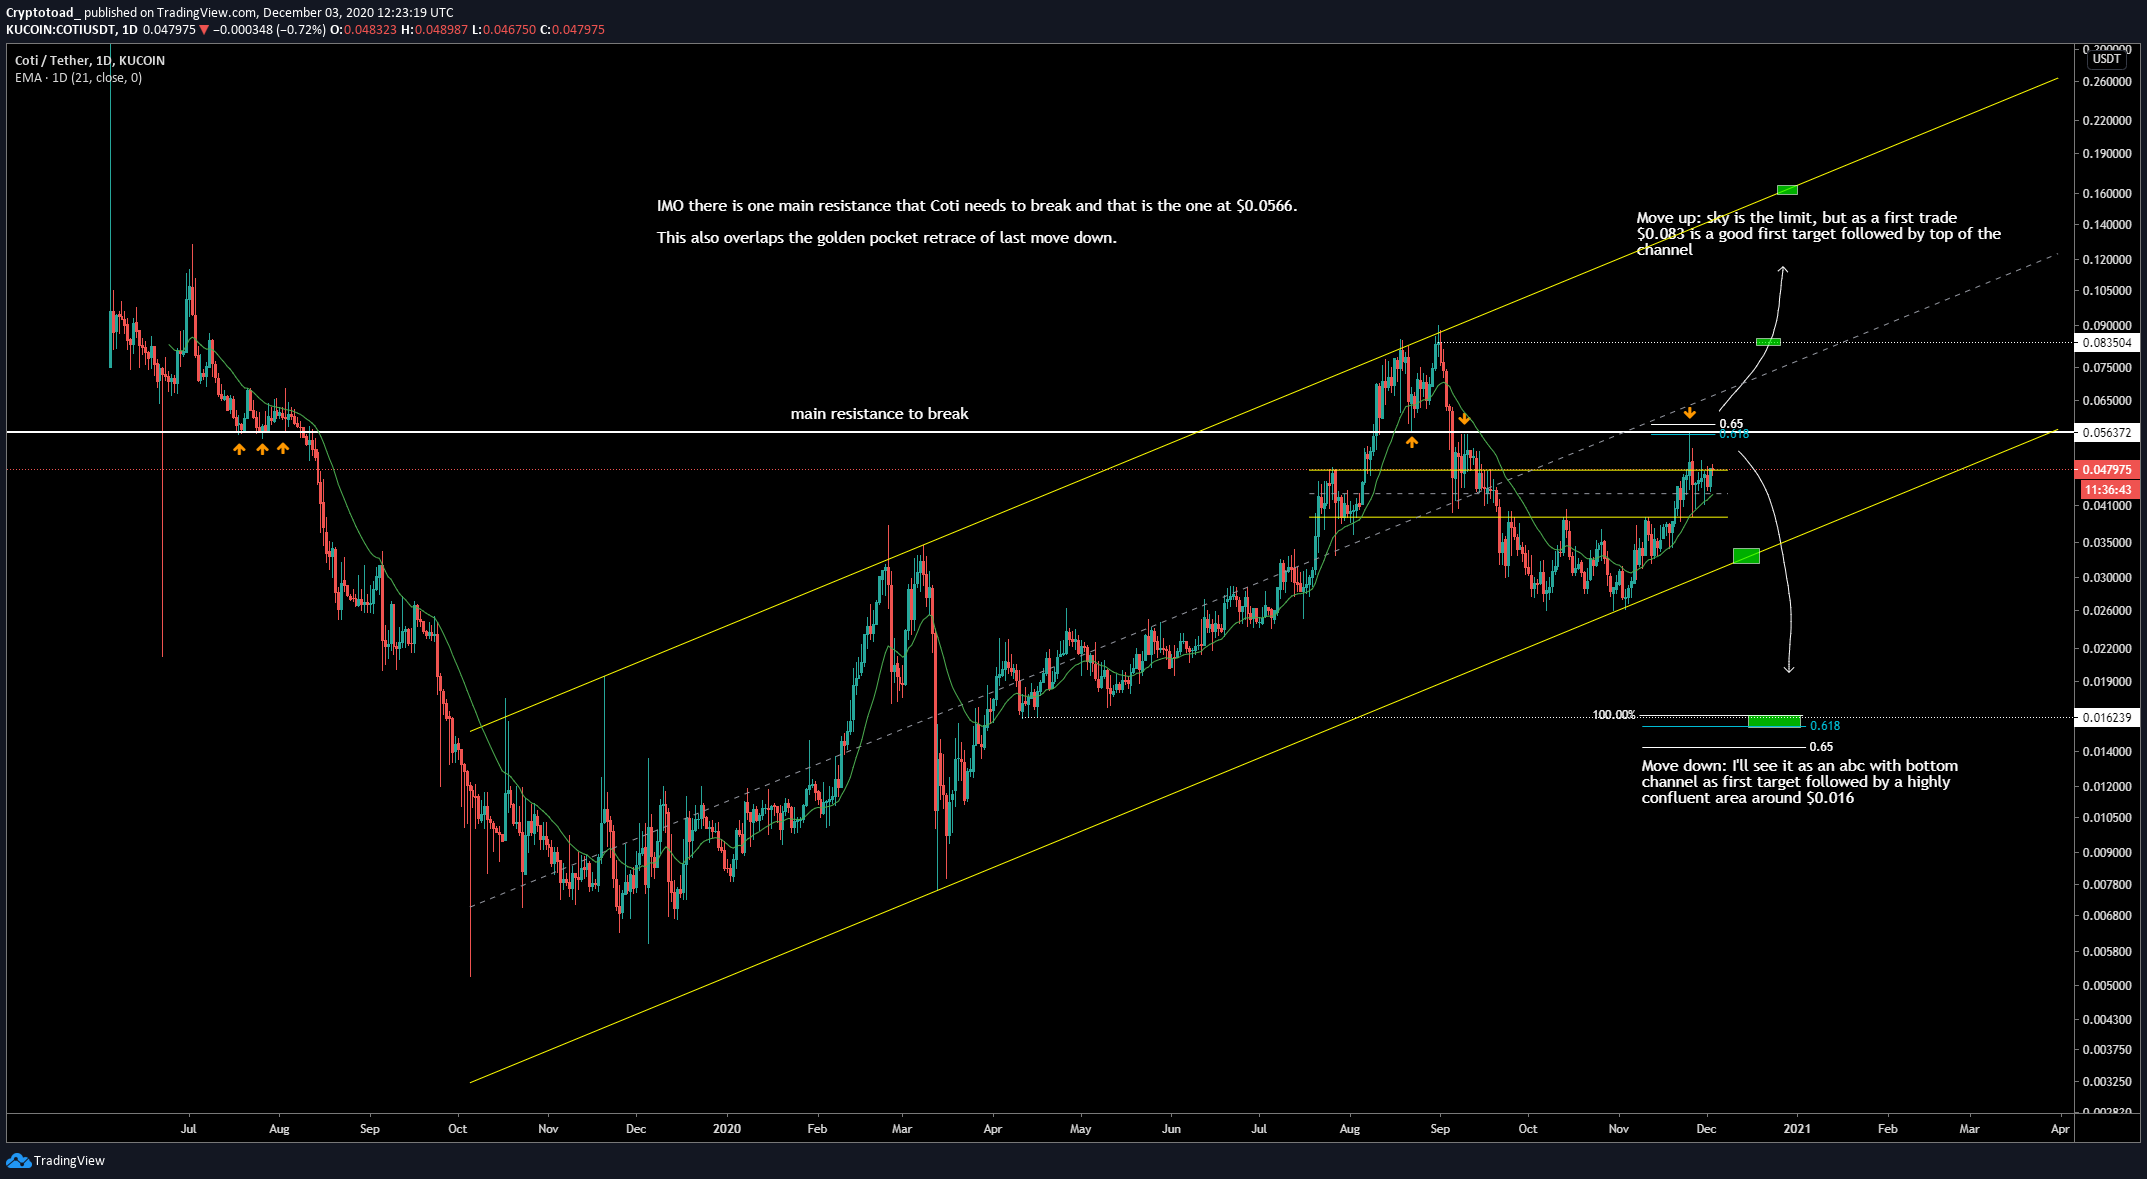
The longer-term chart does indeed show a massive ascending parallel channel that has been in place since October 2019. The fact that the price is following the channel perfectly makes this likely to be a corrective movement.
The middle of the channel is currently at $0.062, fitting perfectly with the previously outlined resistance area.
Therefore, if the price manages to break out above resistance, it would be likely to accelerate quickly. On the other hand, the support line of the channel is at $0.04, right at the previously mentioned support area.
Technical indicators are providing mixed signals. While the RSI has moved above 50, the Stochastic oscillator has just made a bearish cross.
Therefore, the most likely course of action would be consolidation between the support line and middle of this channel until it determines the direction of its next movement.
Conclusion
COTI is expected to break down from its short-term parallel channel and drop towards the support areas outlined above.
In higher time-frames, COTI is expected to consolidate between the support line and the middle of its long-term channel.
For BeInCrypto’s latest Bitcoin analysis, click here!
Disclaimer: Cryptocurrency trading carries a high level of risk and may not be suitable for all investors. The views expressed in this article do not reflect those of BeInCrypto.


