


The Chainlink (LINK) price created a bullish engulfing candlestick on March 12 but still trades below an important resistance area.
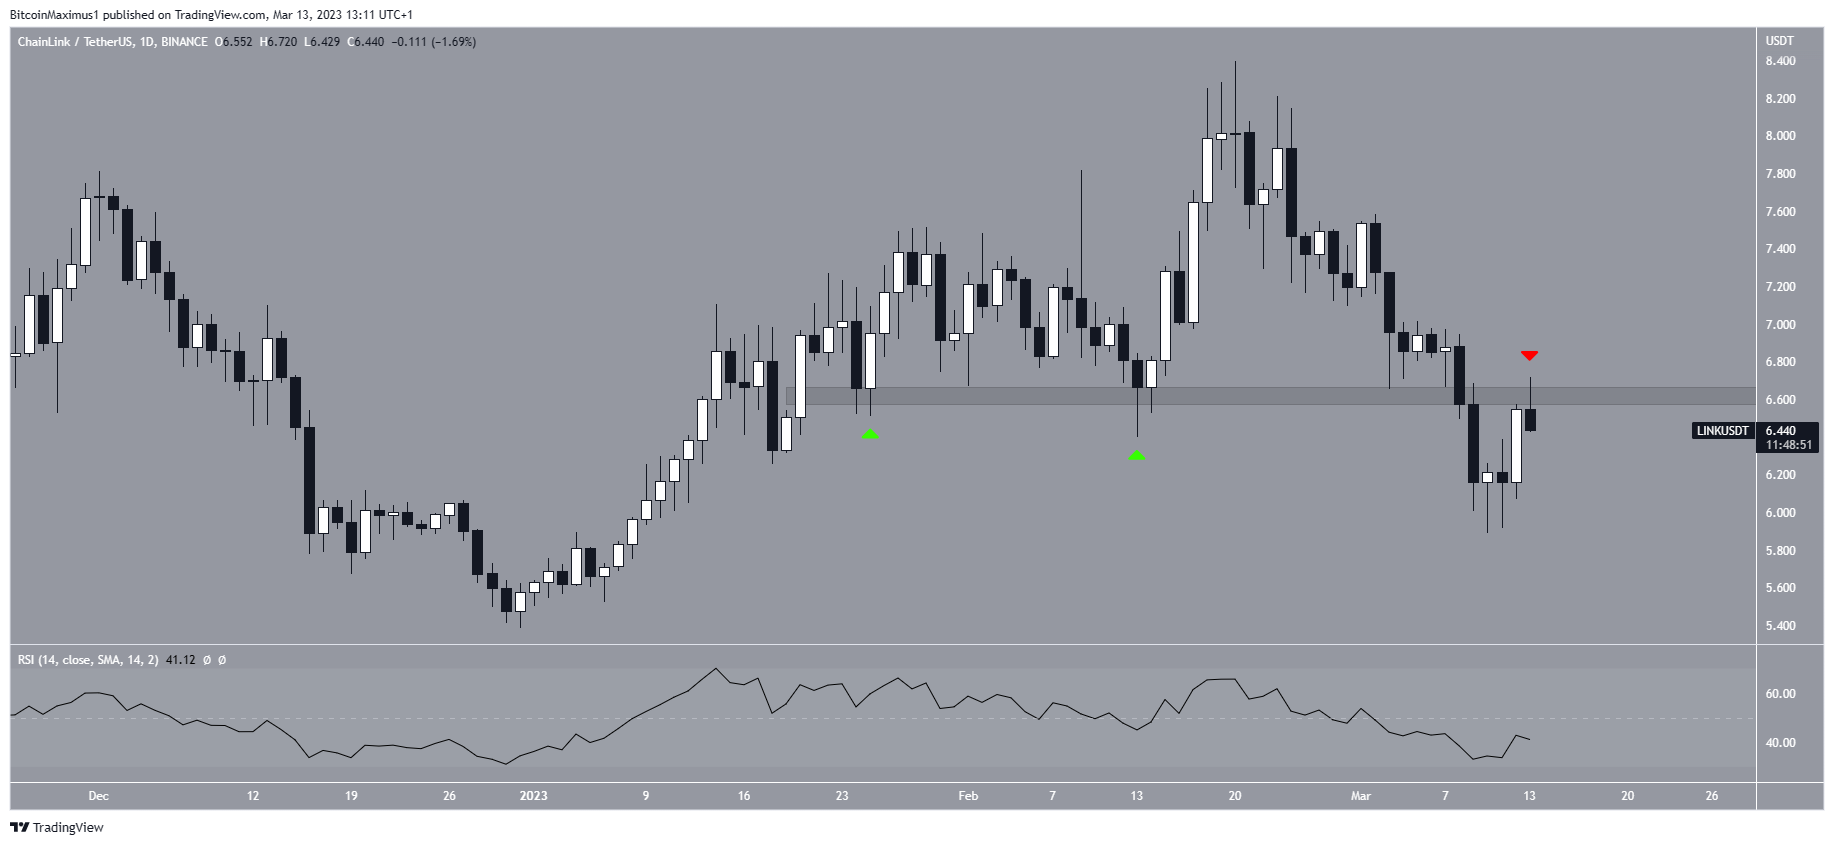
LINK is the native token of the Chainlink network created by Sergey Nazarov. The LINK price has fallen since reaching a high of $8.40 on Feb. 20. The drop led to a low of $5.89 on March 10. The price has increased since, creating a bullish engulfing candlestick on March 12.
However, the LINK price still trades below the $6.62 horizontal area. This is a crucial area since it previously provided support (green icons) in January/February before turning to resistance (red icon).
Moreover, the daily RSI is still below 50, a sign of a bearish trend. Therefore, it is likely that the LINK trend is still bearish. If so, a drop to the $5.50 area could occur.
On the other hand, reclaiming the $6.62 area would mean that the trend is bullish. In that case, an increase toward $7.50 could follow.
Chainlink (LINK) Price Struggles With Confluence of Resistances
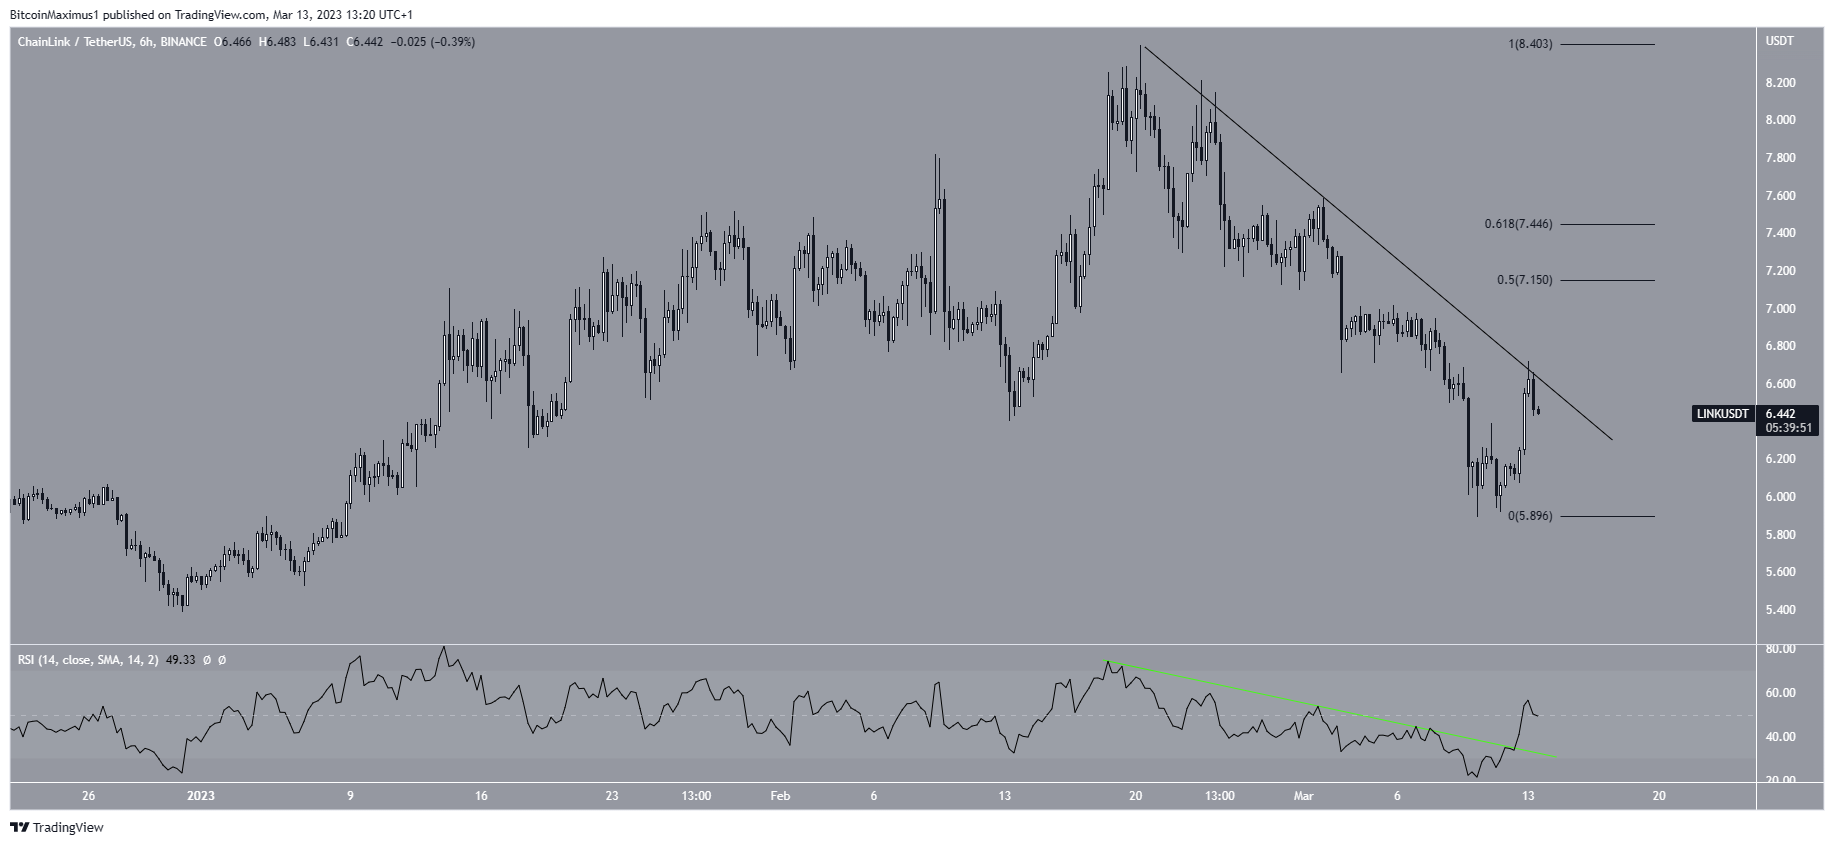
Similar to the daily chart, the six-hour one shows that an important resistance rejected the LINK token price. However, this is a diagonal resistance area created by a descending resistance line. The line caused its fourth rejection on March 12. The importance of the line is increased because it coincides with the $6.62 resistance area. Therefore, the LINK price has to break out above it in order for the trend to be considered bullish. In that case, the closest resistance area would be between $7.15 and $7.45, created by the 0.5-0.618 Fib retracement resistance levels.
While the six-hour RSI has broken out from its own resistance line (green) and is above 50, this is not sufficient to negate the entire bearish price action. As a result, the trend is considered bearish until the Chainlink price breaks out above these resistances.
To conclude, the most likely Chainlink price forecast is the continuation of the downward movement toward $5.50. A breakout from the confluence of resistance at $6.62 would invalidate this bearish outlook. In that case, it could increase toward $7.15-$7.45.


