


The Celestia (TIA) price has increased since November 10, reaching a new all-time high of $16.88 today.
TIA is now in price discovery. How long will this increase continue?
TIA Accelerates Upward Movement
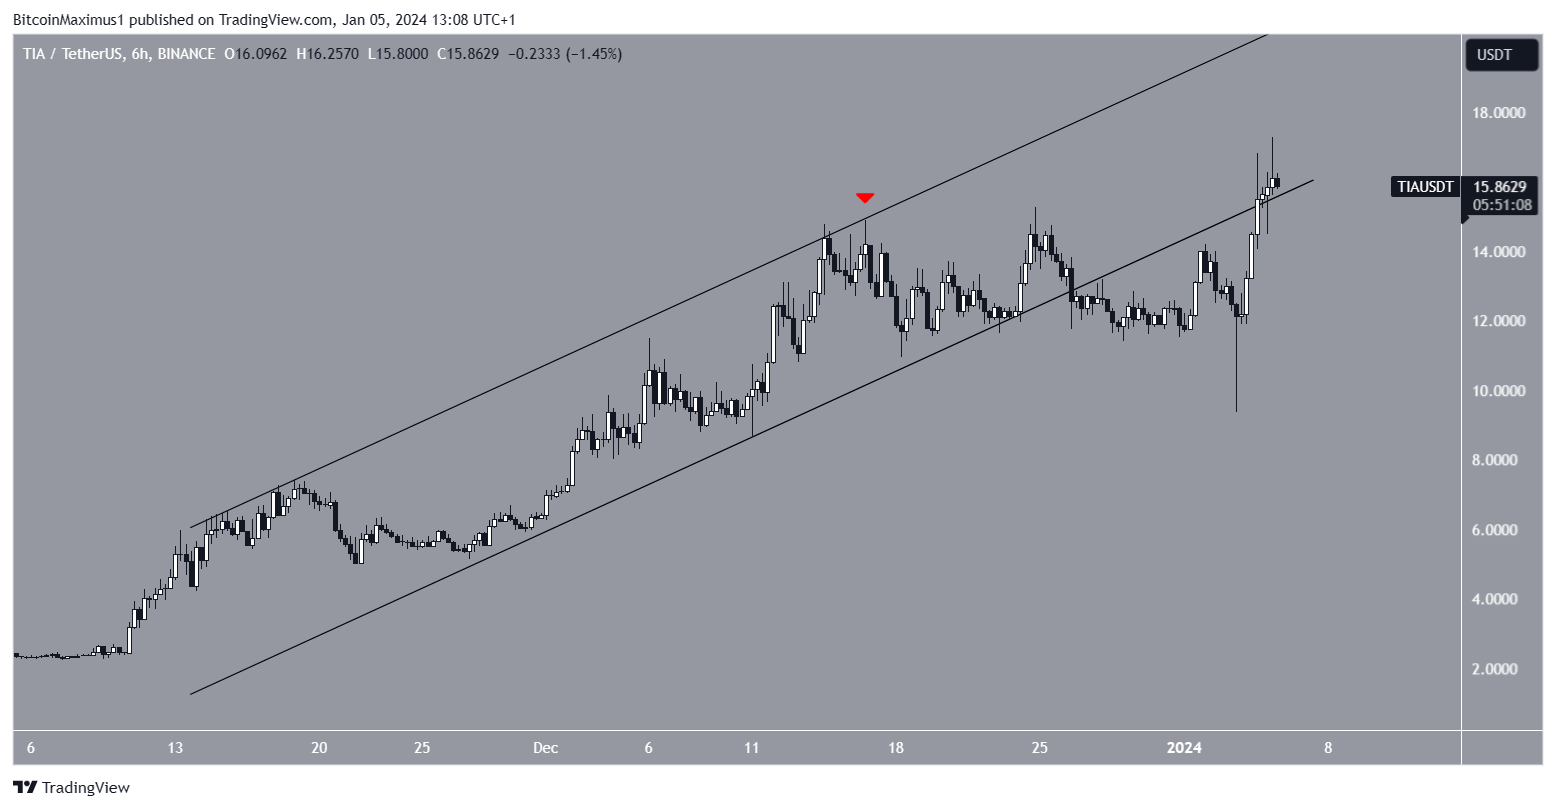
The TIA price had increased inside an ascending parallel channel since November. The channel’s resistance and support trend lines have been validated numerous times.
More recently, TIA was rejected by the channel’s resistance trend line on December 16 (red icon). This led to a downward movement that caused a breakdown from the channel on December 25.
Then, TIA fell to a low of $9.36 on January 3. The price has increased swiftly since and reclaimed the channel’s support trend line. TIA reached a new all-time high price today.
Several cryptocurrency traders and analysts are bullish on the future TIA prospects because of the great recovery after the January 3 low. George1trader believes that TIA is one of the best-looking coins right now, while J suggests a rotation going on from SEI to TIA.
TIA Price Prediction: How Long Will Increase Continue?
Elliott Wave theory involves the analysis of recurring long-term price patterns and investor psychology to determine the direction of a trend.
The most likely count suggests that the altcoin has begun wave three in a five-wave upward movement (white). The sub-wave count is given in black. If the count is correct, wave two ended with the January 3 wick, and the price has begun a new upward movement.
Traders utilize the RSI as a momentum indicator to assess whether a market is overbought or oversold and whether to accumulate or sell an asset. If the RSI reading is above 50 and the trend is upward, bulls still have an advantage, but if the reading is below 50, the opposite is true.
The indicator is increasing and is above 50, both signs of a bullish trend. Also, it has generated a hidden bullish divergence, a sign of trend continuation.
If the upward movement continues, the first target for a TIA top will be at $22.80, 43% above the current price. If the movement extends, TIA could increase by 95% to $31.
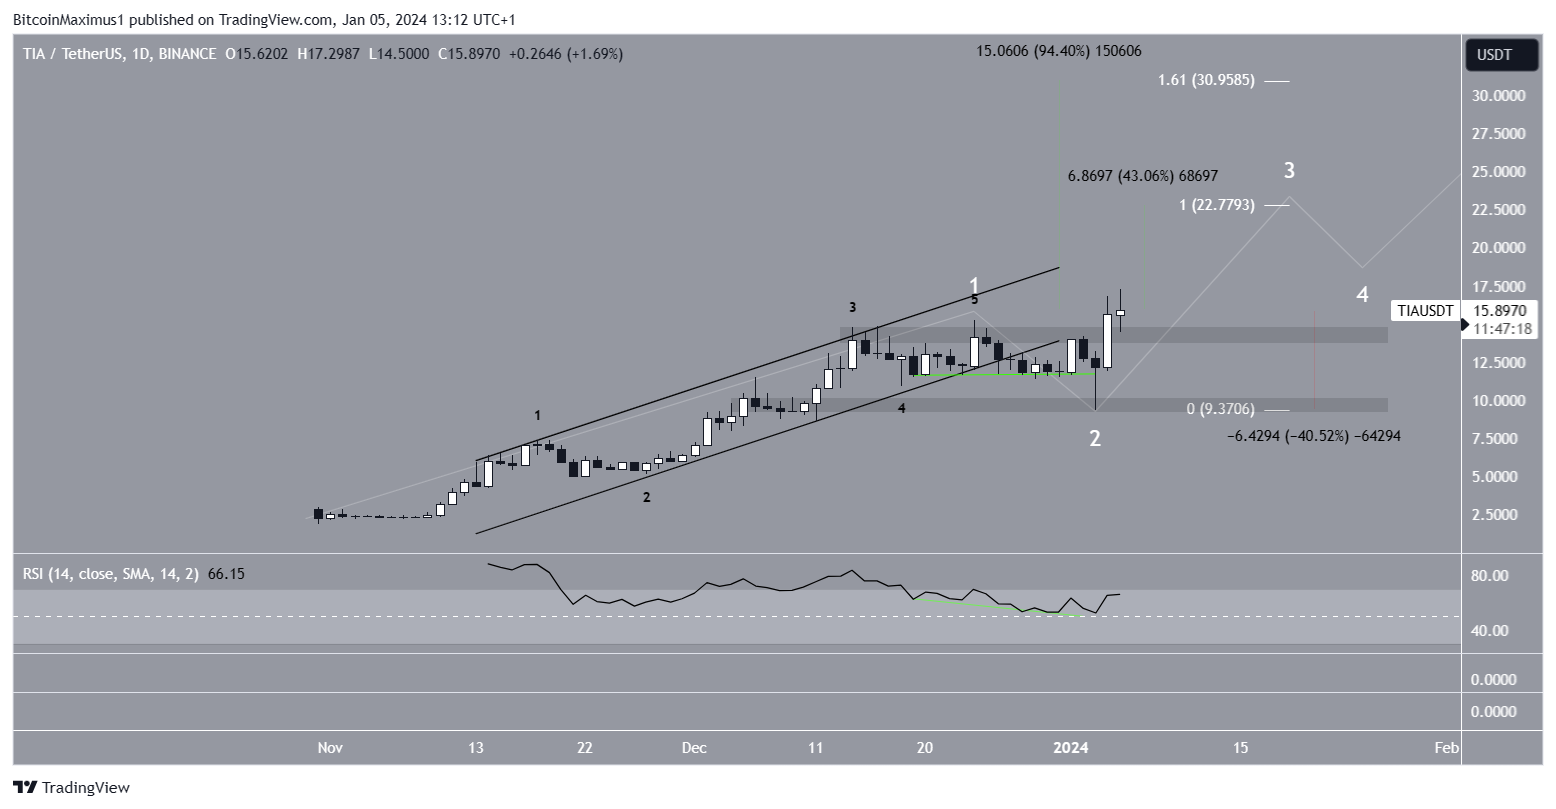
Despite this bullish TIA price prediction, a close below the $14.60 support will mean the trend is bearish. If that happens, a 40% drop to the closest support at $9.40 will be likely.
Read More: Best Crypto Sign-Up Bonuses in 2023
For BeInCrypto’s latest crypto market analysis, click here.


