
The Cardano (ADA) price shows bearish signs that could lead to a significant drop next month.
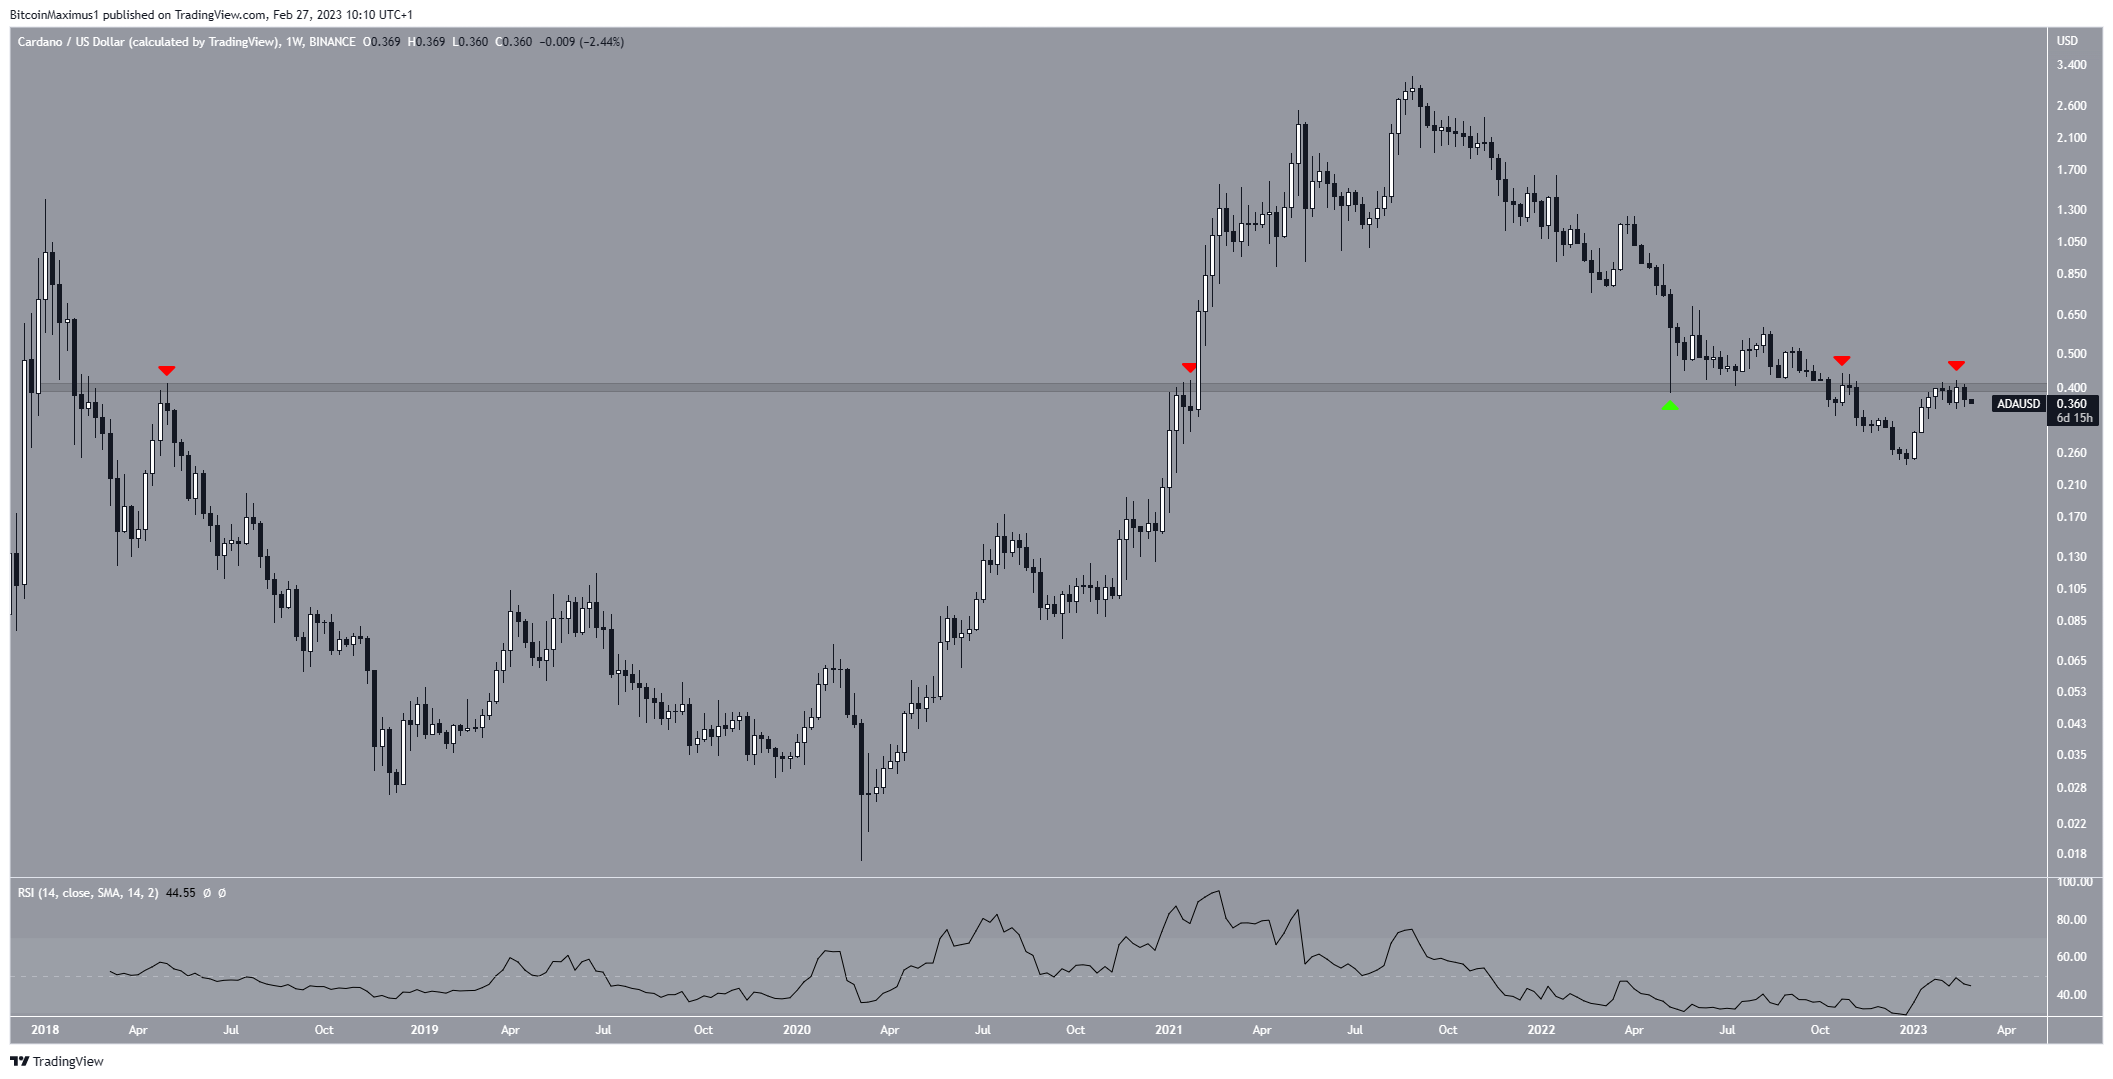
The ADA price has fallen since reaching an all-time high of $3.160 on Aug. 30. The downward movement led to a low of $0.239 in December.
The price has increased since it failed to move above the long-term resistance area at an average price of $0.400. This is a crucial horizontal level since it has intermittently acted as both resistance and support since 2018 (red and green icons).
Therefore, whether the price breaks out from it or gets rejected could determine the future trend’s direction. A breakout could lead to an increase to $0.65, while a rejection could lead to a fall toward $0.239.
The weekly RSI is increasing but is still below 50. Therefore, more is needed to determine the future price action.
Cardano (ADA) Price Prediction for March
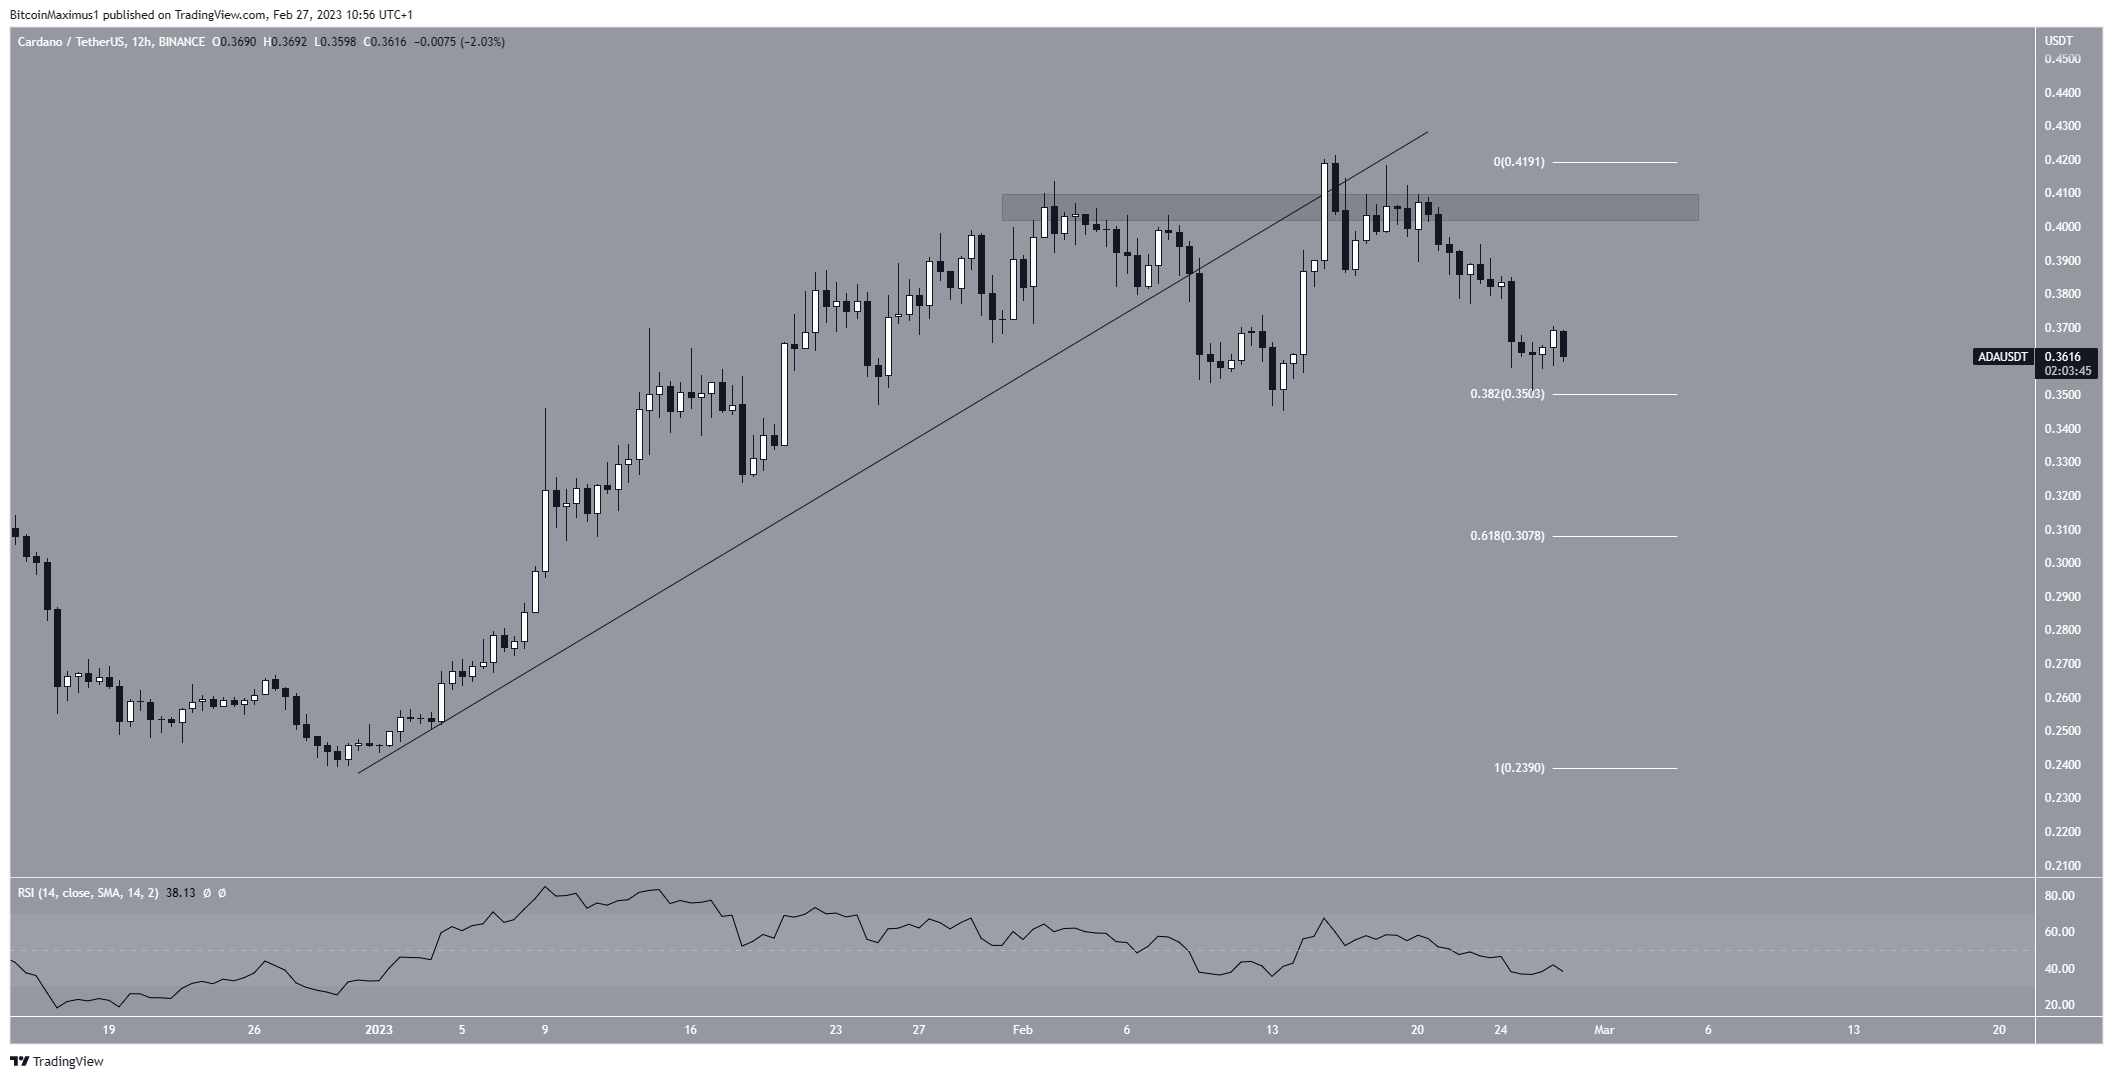
The short-term technical analysis from the 12-hour chart provides a more bearish outlook. The price broke down from an ascending support line and validated it as resistance afterward (red icon). Moreover, it fell below the $0.405 resistance area.
Currently, the price is trading above the $0.35 horizontal and Fib support level. If it breaks down, the ADA price could fall to the 0.618 Fib level at $0.307.
Therefore, the Cardano price forecast is considered bearish until the ADA price moves above the long- and short-term resistance at $0.405.
The RSI is slightly below 50, thus also leaning on a bearish trend.
The wave count can help determine the direction of the future movement. There are currently two possibilities.
The bearish one suggests that the price is in wave four of a five-wave downward movement (red). In this case, the ensuing drop would lead to a breakdown.
The bullish one suggests the price has just completed an A-B-C correction (black). In this case, it will increase soon.
The bullish count would be confirmed by an increase above $0.385 (green line), while the bearish one would be confirmed by a drop below $0.345 (red line)
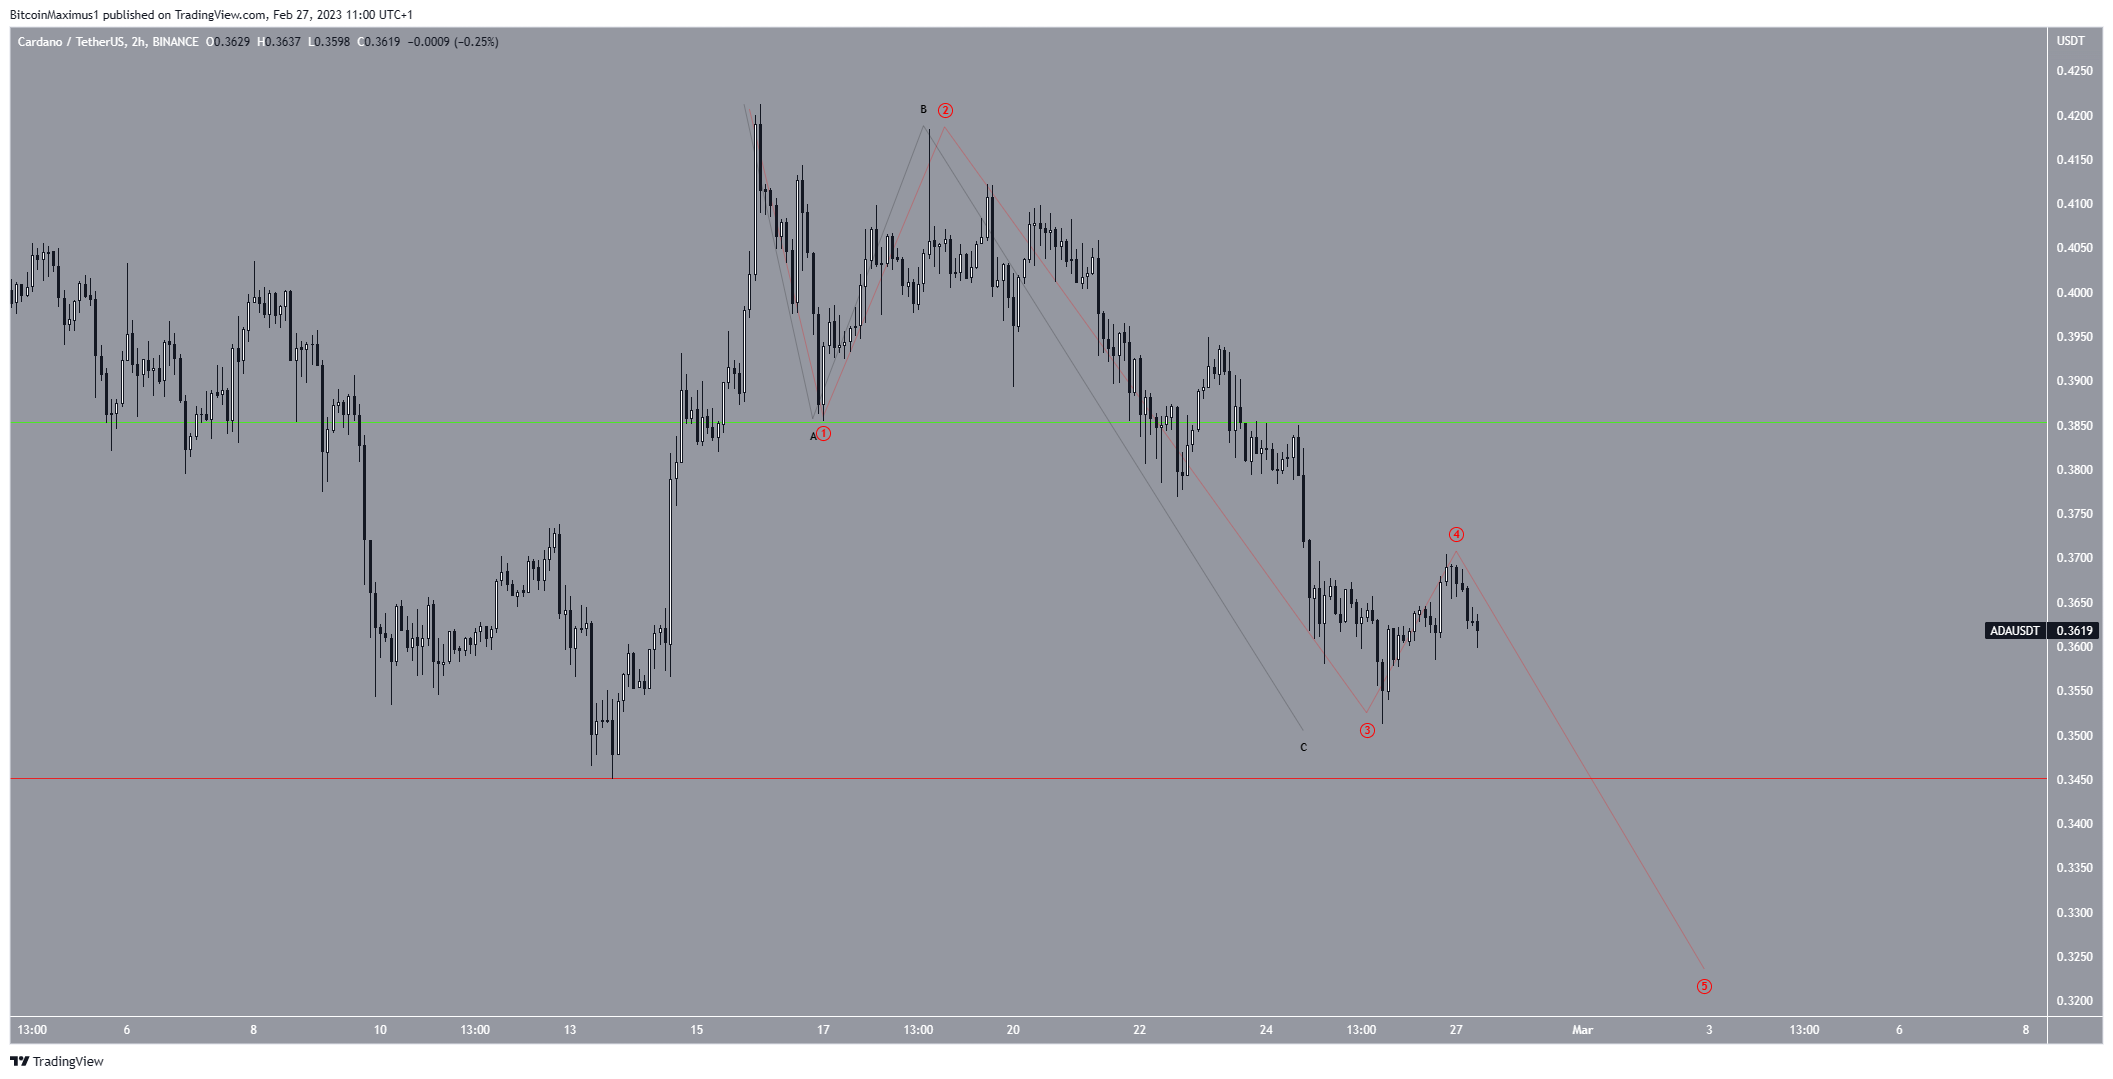
To conclude, the most likely Cardano price forecast is a decrease toward $0.307. On the other hand, an increase above $0.385 would invalidate this bearish analysis and could lead to a retest of the $0.405 resistance.
For BeInCrypto’s latest crypto market analysis, click here.
