


After struggling to reach key resistance at $0.522, ADA has managed to break an important support level.
This shift indicates a potential continuation of the bearish trend, with significant implications for future price action.
Cardano Breaches Critical Technical Support
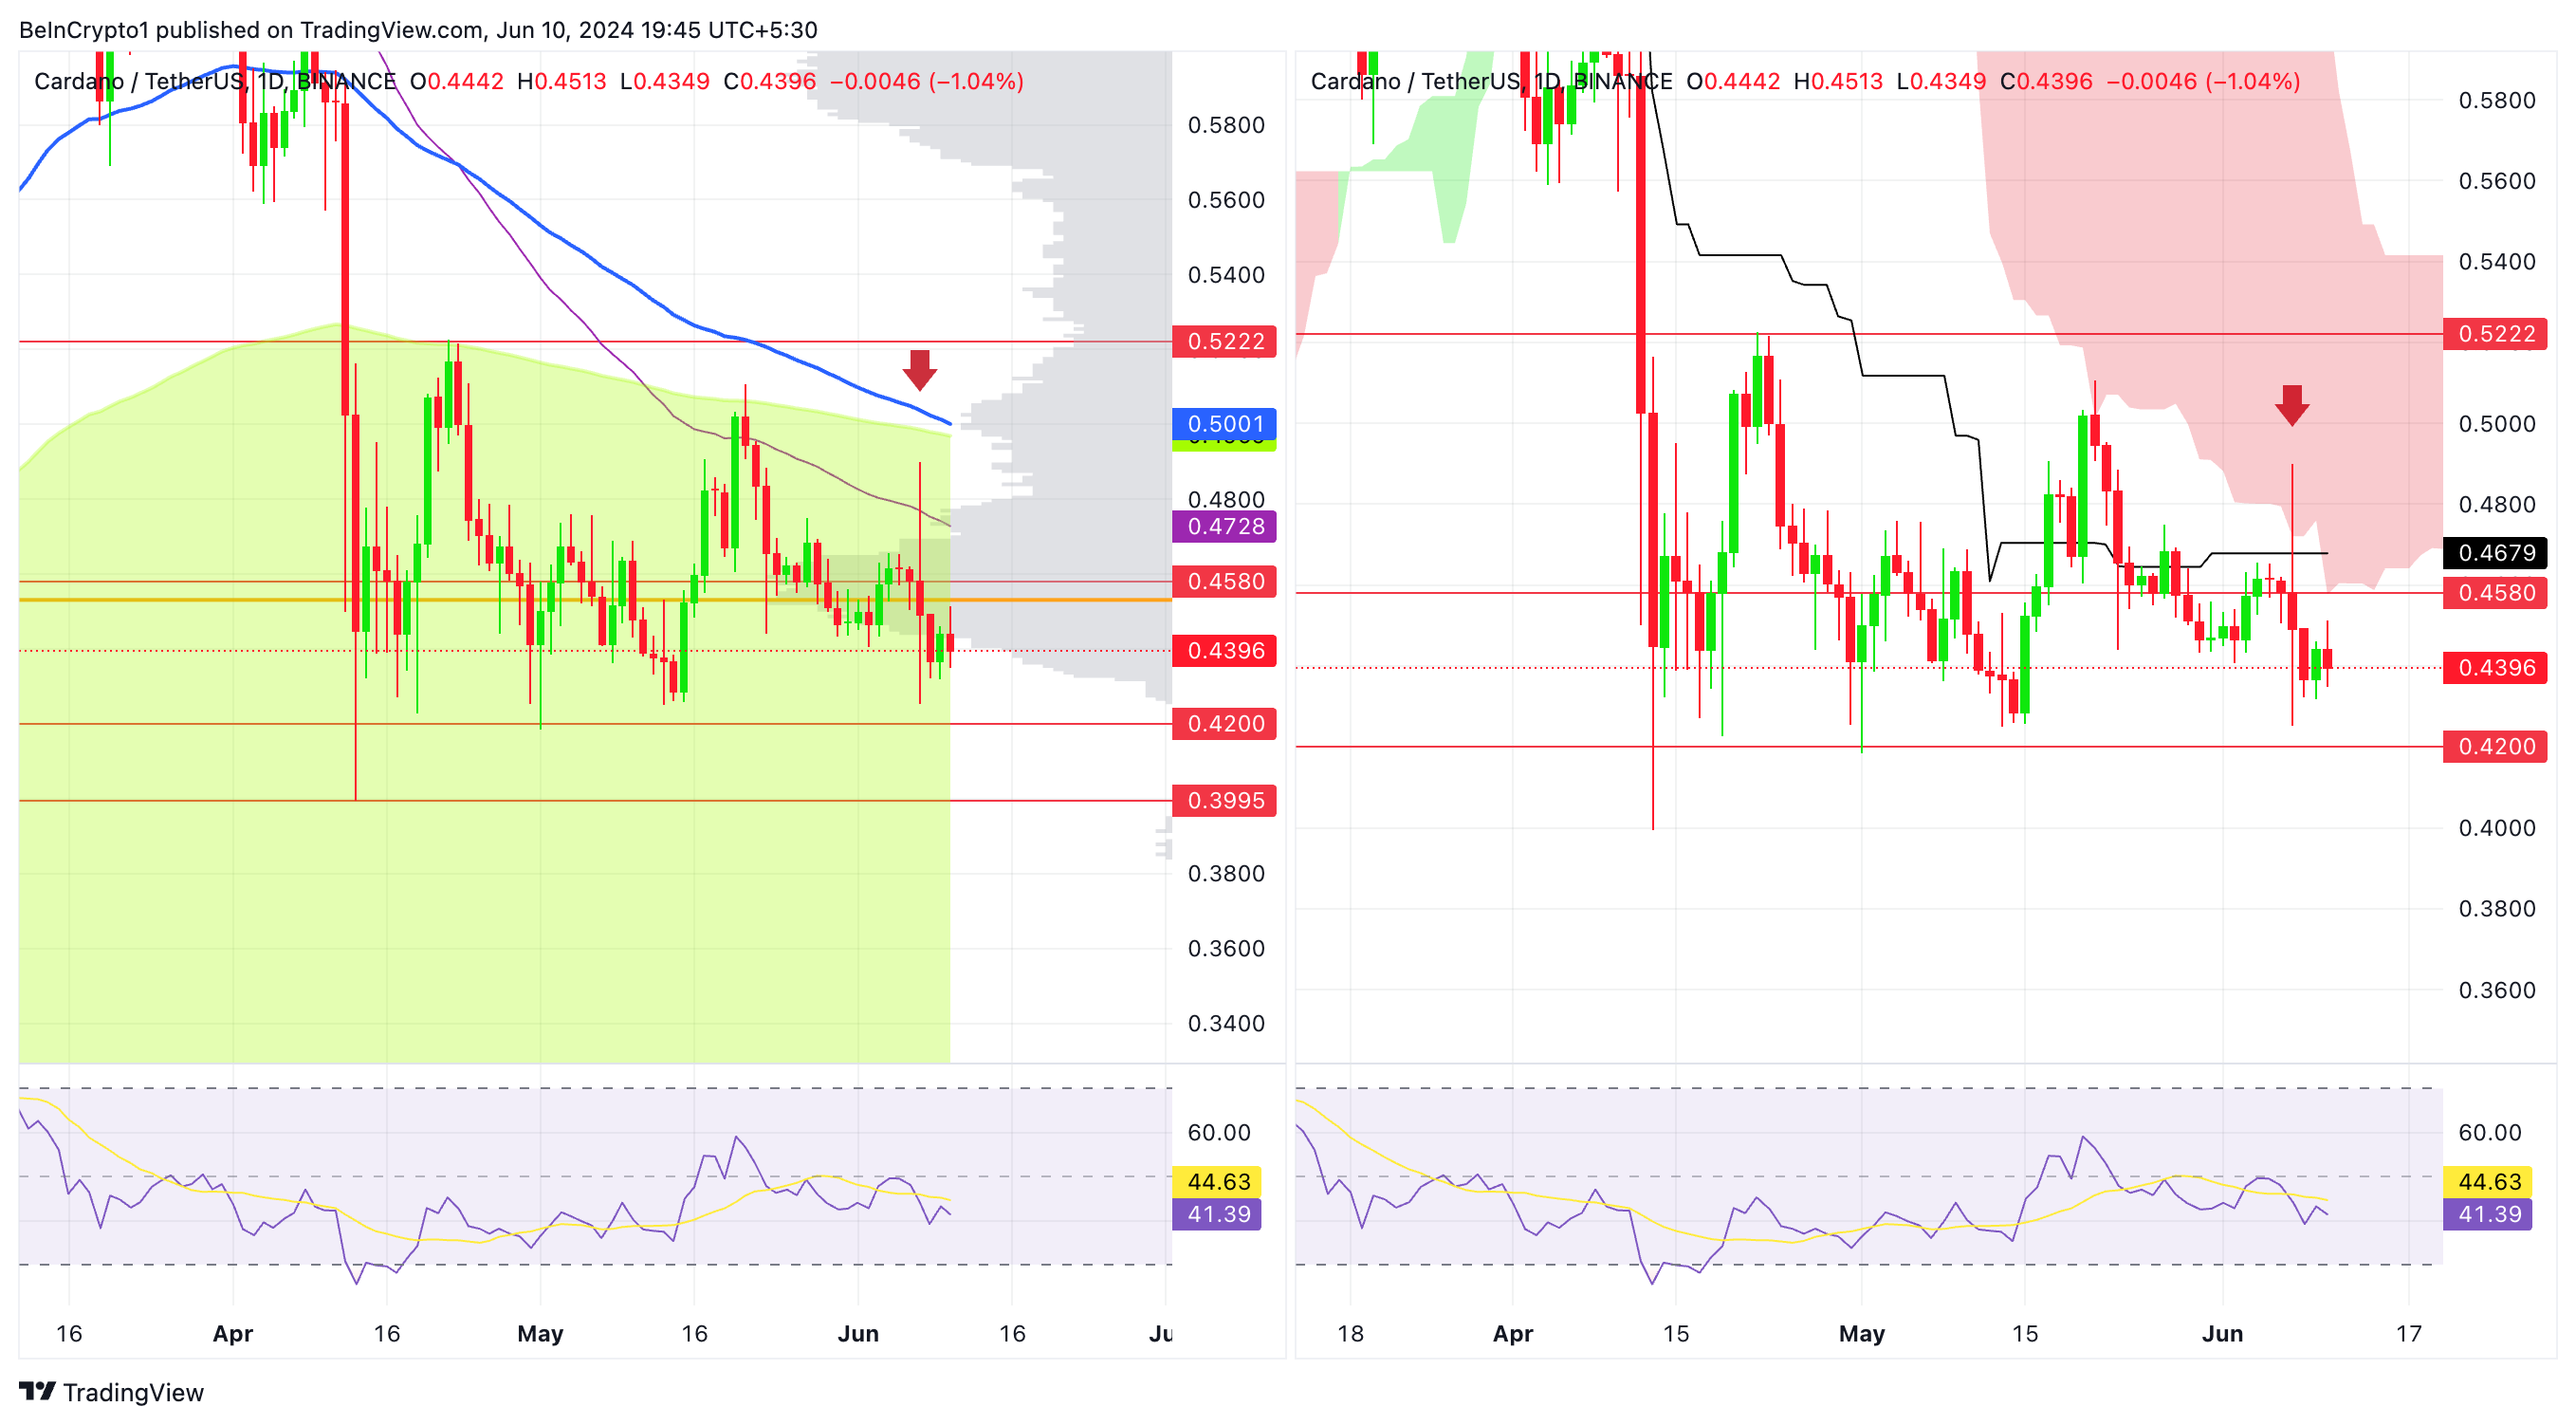
The recent price action has seen ADA break below the critical support level at $0.458 and test the important support at $0.420. This breach is a strong bearish signal, suggesting that the selling pressure has overwhelmed the buying interest at these key levels.
A week ago, BeInCrypto reported a bearish outlook for Cardano (ADA) due to its price struggling below key support levels and critical resistance at $0.522. Key support was identified at $0.458, with a potential further downside to $0.420 if broken.
The analysis highlighted that on-chain data revealed a decline in user engagement and short-term trading activity. Contributing to a bearish fundamental outlook.
The price is currently at $0.439, trading below the 50, 100, and 200 EMAs on the daily timeframe.
Read More: Who Is Charles Hoskinson, the Founder of Cardano?
The price has fallen back into the critical support range of $0.43 – $0.46, where the majority of trade volume has taken place over the past 200 days (indicated by the Volume Profile histogram in gray). After failing to break above the 50 EMA and reaching $0.48, this signals a bearish trend.
On its attempt towards $0.48, Cardano entered the Ichimoku Cloud and was subsequently rejected, signaling another bearish technical outlook.
Key resistance levels that could reverse the trend are $0.458, the daily Ichimoku Cloud (acting as dynamic resistance as seen in the right plot), and the Ichimoku baseline, shown in black.
Decline in New and Active Addresses Highlights Waning User Interest
The significant declines in new and zero balance addresses, particularly towards the end of the period. Indicate waning user engagement and reduced network activity.
This reduction in participation can signal a bearish outlook for ADA. Fewer new users and decreasing active addresses often correlate with decreased buying pressure and market interest.
If these trends continue, ADA’s price could face further downward pressure, potentially leading to lower support levels being tested in the near future.
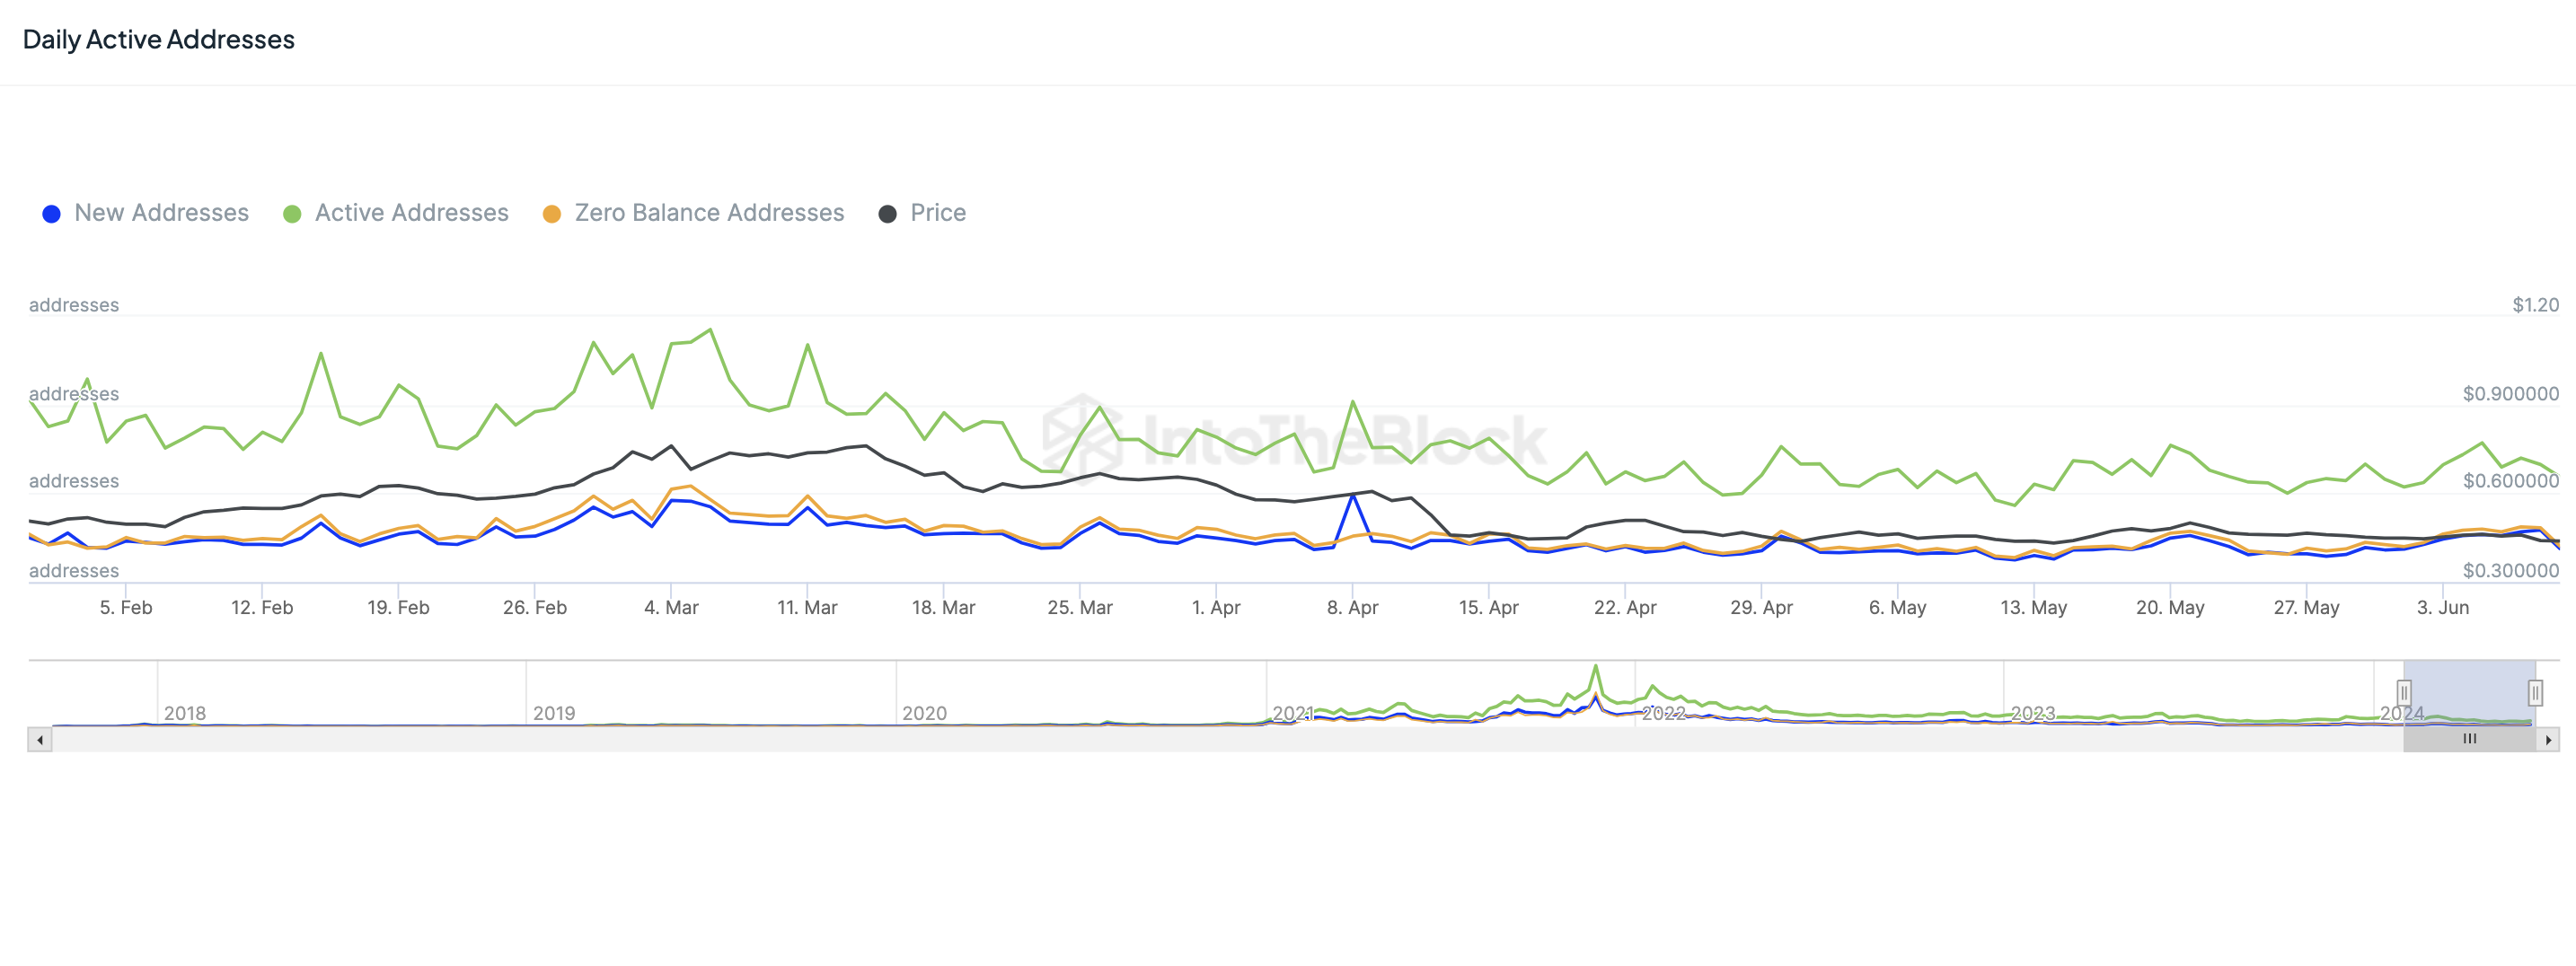
Between June 1 and June 9, the Cardano network experienced fluctuating activity levels. With significant changes in new addresses, active addresses, and zero balance addresses.
Read More: Cardano (ADA) Price Prediction 2024/2025/2030
New addresses saw a sharp decline on June 9, dropping by 5,254. While active addresses peaked on June 3 before plummeting by 6,840 on June 6. Zero balance addresses similarly showed volatility, with a substantial drop of 5,198 on June 9.
Strategic Recommendations
The most important support levels to watch are $0.458, the baseline of the daily Ichimoku, and the daily Ichimoku Cloud itself.
If ADA manages to break above these levels, it will likely head towards the $0.522 price level. Which is the most critical resistance in the mid-term.
Conversely, there are significant downside risks. The key support levels to monitor are $0.420 and $0.400. A breakout below these levels could indicate a very bearish trend.
It is highly recommended to place stop-loss orders below these levels to avoid incurring massive losses, similar to the -13% drop observed three days ago. By closely monitoring these support and resistance levels, traders can make more informed decisions and manage their risk effectively.


