


The declines in the broad cryptocurrency market continue. This week, Bitcoin generated more than a 3% bearish candle and reached long-term support in the $25,100 area.
This level is crucial for maintaining the integrity of the uptrend of the past 6 months. If Bitcoin takes advantage of the existing support areas and breaks out of the bullish pattern of the descending parallel channel, the uptrend could find a continuation.
Bitcoin Struggles to Maintain Its Uptrend
Yesterday, Bitcoin fell more than 3% and closed at an important support level of $25,100 (green area). It is in confluence with the 0.382 Fib level, measuring for the entire upward move since January 2023. This Fib level is the most common target for healthy corrections in a strong uptrend or downtrend.
However, the current price action continues to decline, and BTC is losing this support. If today’s move does not turn out to be just a deviation, the ongoing decline may not be a correction. On the contrary, it could lead to the end of the uptrend, which has been in place since early 2023.
However, if Bitcoin were able to regain the $25,100 level quickly, it would be a bullish signal, and the uptrend would remain intact. A bounce to at least the $27,400 area would then be possible. This is both the 0.236 Fib retracement level and the upper edge of the descending parallel channel, where the BTC price has been trading since mid-April.
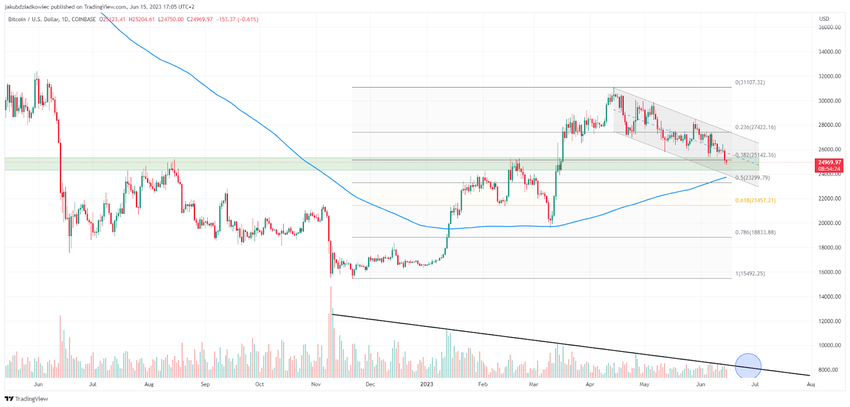
In addition, yesterday’s decline led to the loss of the median of this channel (blue dashed). In such a situation, the natural target is the lower edge of the channel, which is currently descending in the vicinity of $23,700. This level is in strong confluence with the 0.5 Fib retracement and the 200-day moving average (200D MA, blue).
If this level is lost, the next important support is located at $21,450. This is the 0.618 Fib retracement and an important horizontal resistance/support area.
Trading Volume Signals End of Compression Phase
It is worth mentioning that Bitcoin’s trading volume has been steadily declining since November 2022 and the crash of the FTX exchange. Decreasing volume signals a decline in the volatility of an asset and indicates a prolonged compression phase.
Such a period is usually followed by a sharp increase in trading volume and a strong move up or down. The current pattern already looks very mature and ready to move in the coming weeks (blue circle).
Long-Term RSI May Provide Support
Daily technical indicators give bearish signals. The Relative Strength Index is below 50 and dropping.
Using the RSI as a momentum indicator, traders can determine whether the market is overbought or oversold. Moreover, they decide whether to accumulate or sell assets with this metric. If the RSI reading exceeds 50 and the trend is upward, the bulls have the advantage. The opposite happens when the reading is below 50.
However, the long-term RSI chart seems to be following an ascending support line that goes back to June 2022 (black). Its last 3 touches (blue circles) marked lows in the Bitcoin market (blue arrows) and were buying signals.
Currently, the line is just above oversold territory, near 30. The RSI would have to fall another 5 points to reach this value. Thus, although the BTC price still has downside potential, support on the RSI chart could initiate a bounce and a resumption of the uptrend.
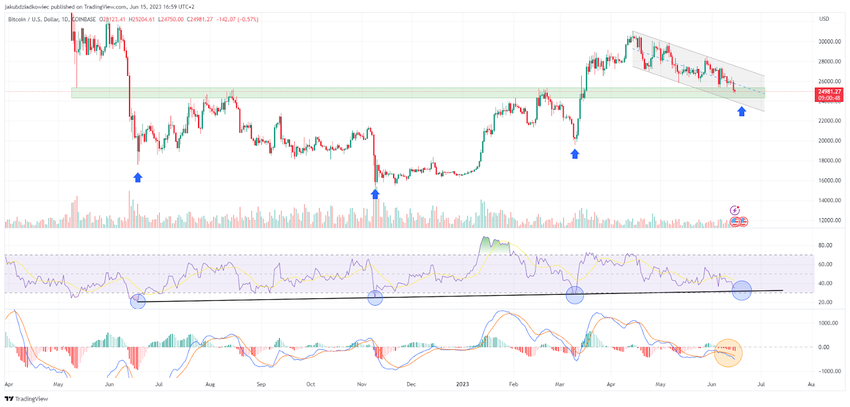
The MACD has also been declining since mid-April. The histogram of the indicator generates increasingly long red candles, confirming the downward trend (orange circle). If a potential bounce were to occur, one of the first signals would be a shorter, pale red MACD bar.
BTC Price Prediction: Will Bullish Divergence Lead to a Bounce?
The short-term 4-hour chart provides a slightly more bullish BTC price prediction. First of all, Bitcoin is in a repeatedly confirmed pattern of a descending parallel channel. This pattern is bullish and, in most cases, leads to an upward breakout.
However, for this to be possible, the BTC price must regain the channel median at $25,450 and the horizontal support area S1. Only then will it be possible to try to regain the weekly pivot (P) at $26,200 and a possible move to the upper edge of the channel?
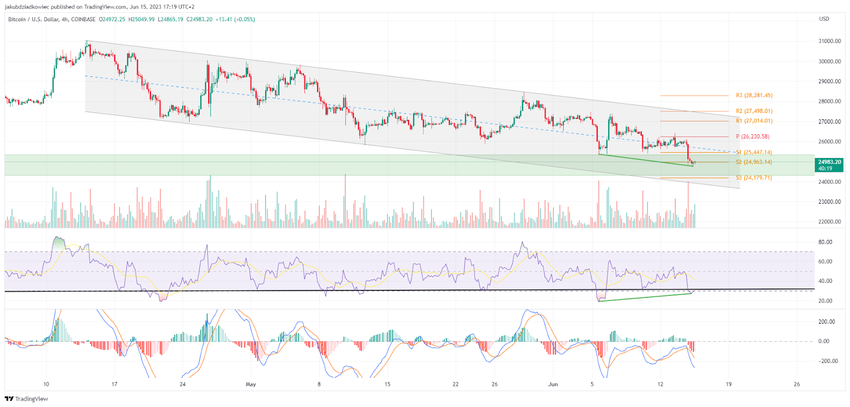
In addition, we see a developing bullish divergence (green) on the 4-hour RSI. The BTC price has recorded a lower low, while the RSI chart is in the process of forming a yet unconfirmed higher low. If the divergence is confirmed, trying to recover lost support levels will be possible.
Moreover, the MACD also appears to be making an attempt to reverse the short-term trend. The histogram has generated the first pale-red bar and is attempting to turn back upward.
However, if these efforts fail, the nearest support area remains at the S3 level, near $24,000. It stands in confluence with the lower edge of the descending parallel channel.
For BeInCrypto’s latest crypto market analysis, click here.


