


The BONK price increase culminated with a new all-time high price of $0.000015 today.
The price moved above an important Fib resistance level but has not reached a daily close above it yet. Will it do so?
BONK Increase Surpasses 8,000%
The BONK price has increased quickly since October 20. On November 20, the price broke out from its then-all-time high of $0.0000057. After a brief retracement, which validated the previous all-time high region as support, the BONK price accelerated its upward movement again. It reached a new all-time high of $0.0000150 today.
In the 56 days since the low, the BONK price has increased by 8,820%.
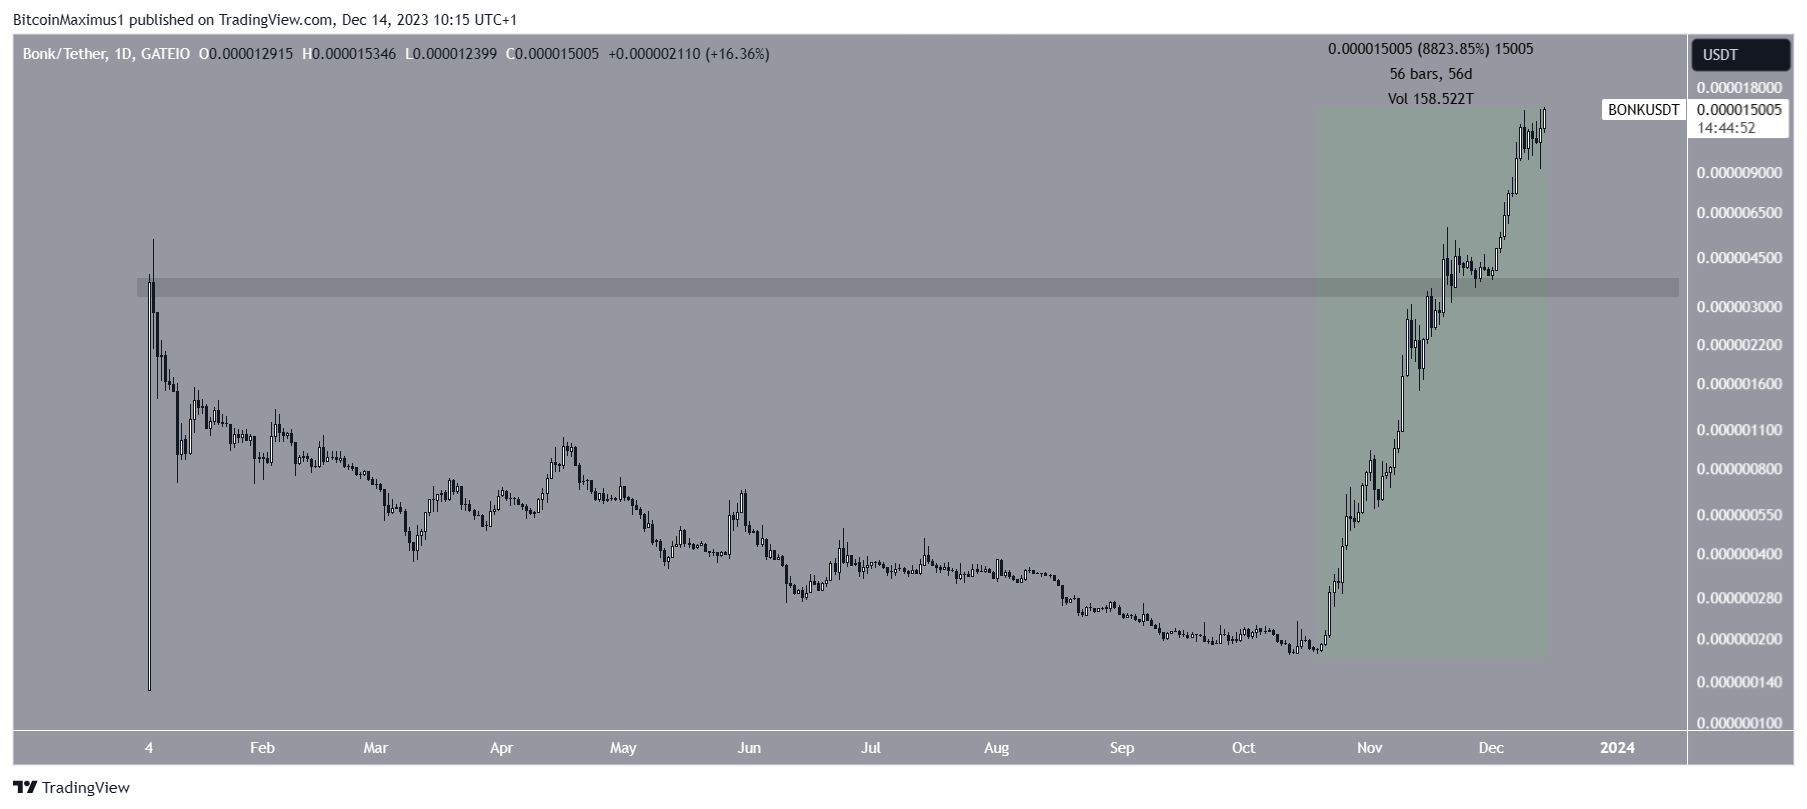
It is worth mentioning that the BONK price has now flipped PEPE based on its market capitalization, becoming the third largest meme coin. To flip Shiba Inu (SHIB) and become the second-largest meme coin, BONK has to increase by another 800%.
It is possible that the increase accelerated after Coinbase announced support for the meme coin, exclusively on the Solana network.
BONK Price Prediction – How Long Will Increase Continue?
Market traders use the RSI as a momentum indicator to identify overbought or oversold conditions and to decide whether to accumulate or sell an asset.
Readings above 50 and an upward trend indicate that bulls still have an advantage, whereas readings below 50 suggest the opposite.
The daily RSI for BONK shows a bearish divergence (green) that has developed since November. This is a sign of an impending top.
Read More: 9 Best Crypto Demo Accounts For Trading
The price action is bullish. The BONK price has just moved above the 2.61 external Fib retracement of the previous decrease. However, it has not reached a daily close above this level yet.
If BONK reaches a close above this level, it can increase by 30% and reach the next resistance at $0.000018.
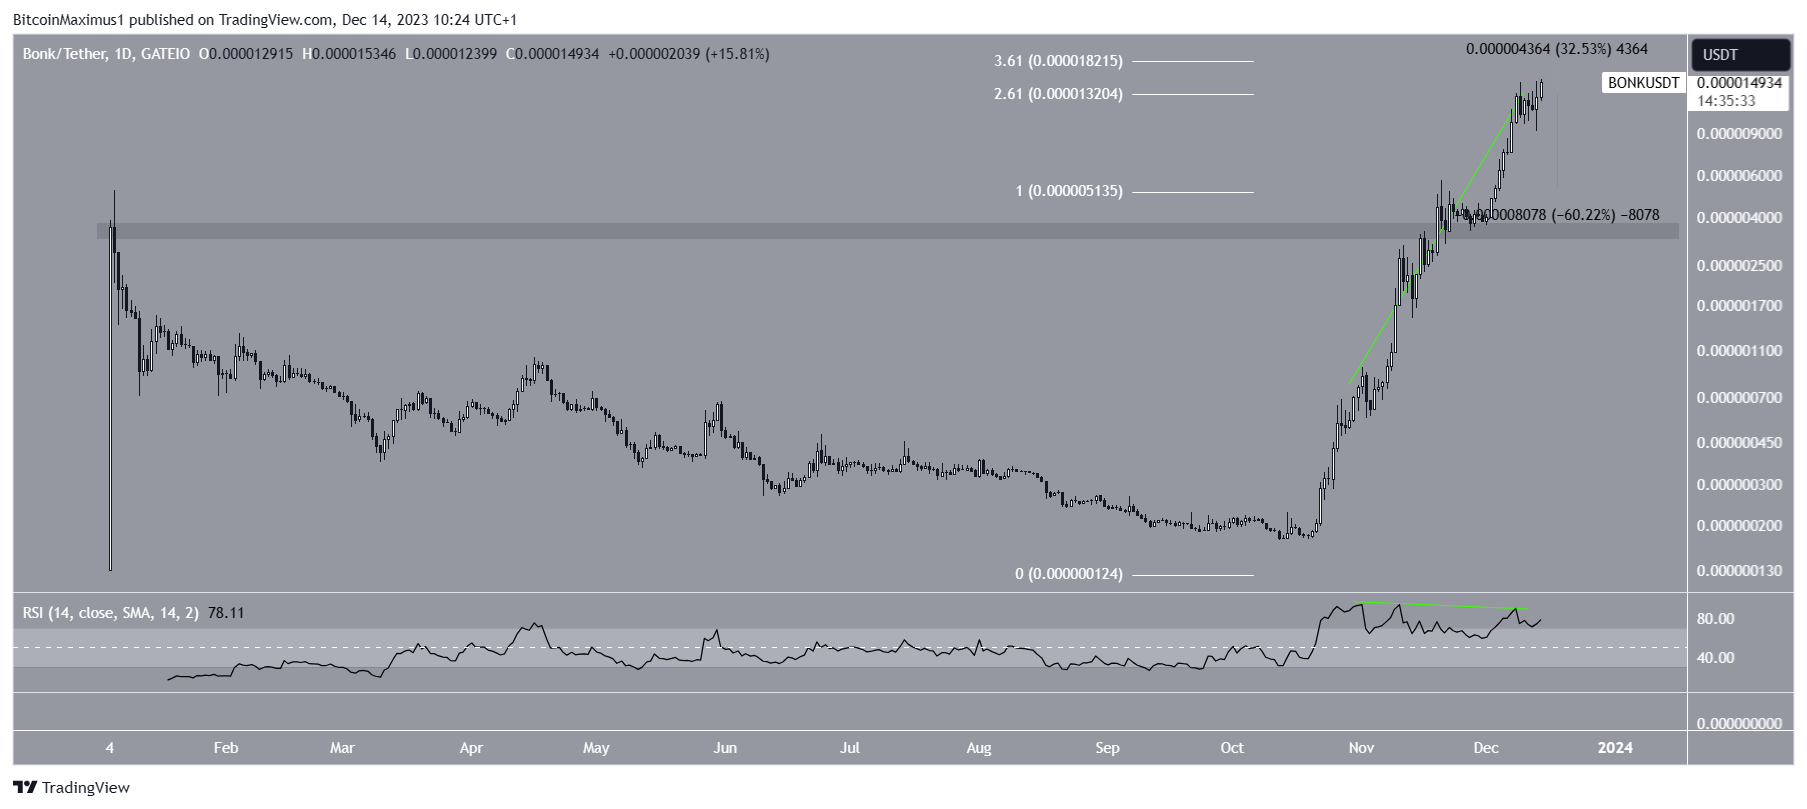
However, if the BONK price creates a bearish candlestick and falls below this level, the bearish divergence will likely cause a downward movement, taking the price back to the previous all-time high of $0.0000057, a decrease of 60% from the current price.
For BeInCrypto‘s latest crypto market analysis, click here.


