


BNB reached an all-time high of $47.21 on Jan. 19, but has been decreasing since.
Despite the drop, BNB has validated the previous breakout level as support and is expected to continue increasing towards the targets given below.
All-Time High
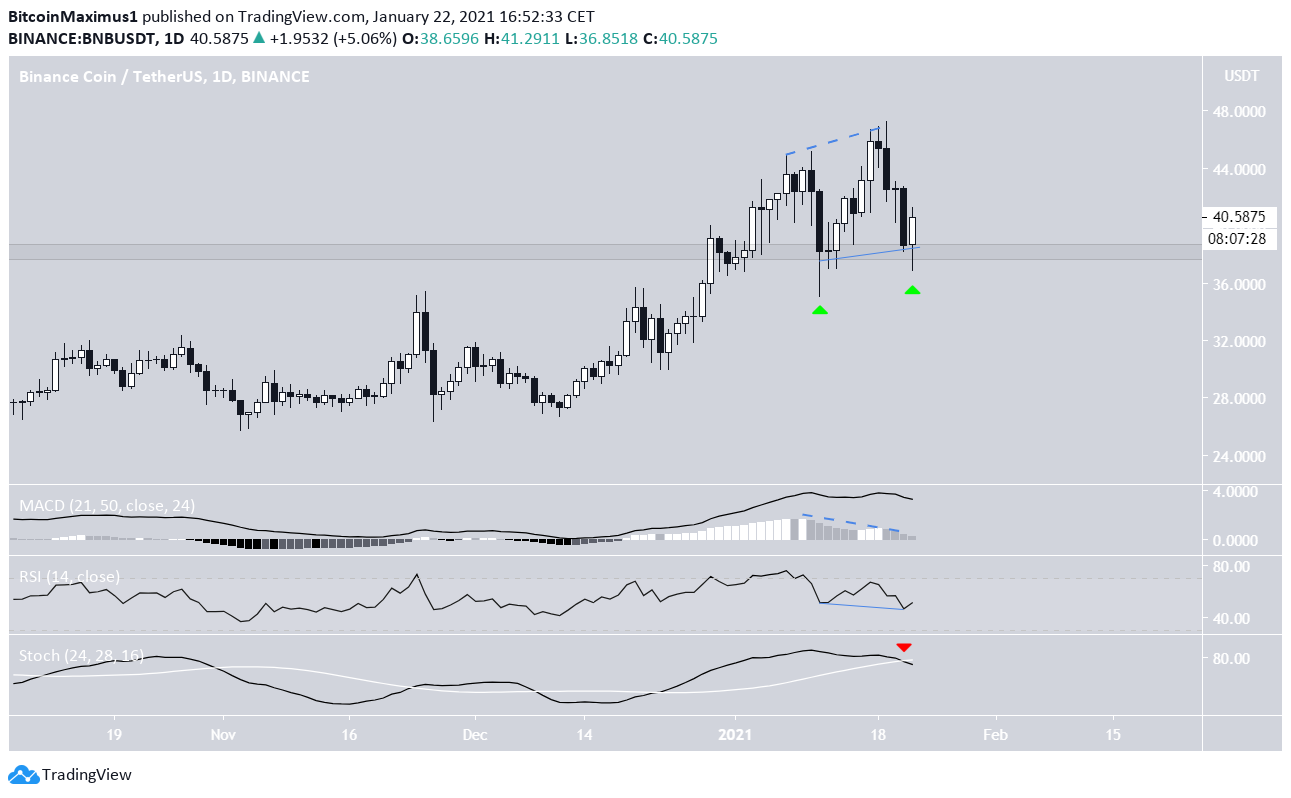
On Dec. 29, BNB reached a high of $39.99, breaking the previous all-time high price of $39.59. It continued to increase and reached a high of $47.21 on Jan. 19, an all-time high price that still stands. However, after generating bearish divergence in both the RSI & the MACD, the coin’s price dropped. The decrease, though, only served to validate the $38 area as support.
While the Stochastic Oscillator has made a bearish cross, the RSI has generated hidden bullish divergence, a strong sign of trend continuation.
When combining this with the strong bounce at support, it is likely that BNB will continue increasing.
Wave Count
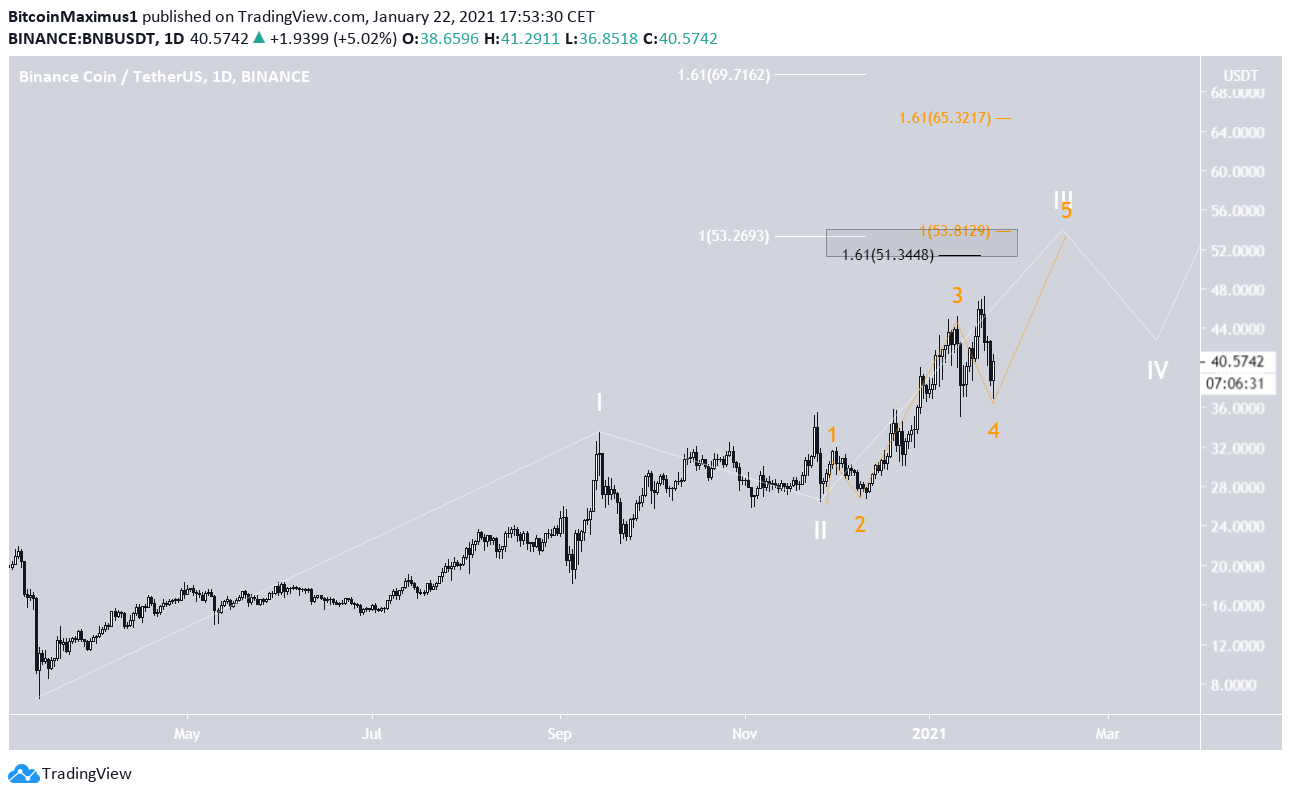
The wave count suggests that BNB is in an extended wave 3 (shown in white below) of a bullish impulse that began with the March 2020 lows. The sub-wave count for wave 3 is given in orange, in which the coin is in sub-wave 5, which would complete the longer-term wave 3.
The most likely target for sub-wave 5 and wave 3 to end is found between $51.34 and $53.81, a target found by:
- Projecting the length of wave 1 to the bottom of wave 3 (white)
- Projecting the length of waves 1-3 to the bottom of 4 (orange)
- 1.61 External retracement of sub-wave 4 (black)
While it is possible that the move extends towards $65-$69, it is less likely than the original target.
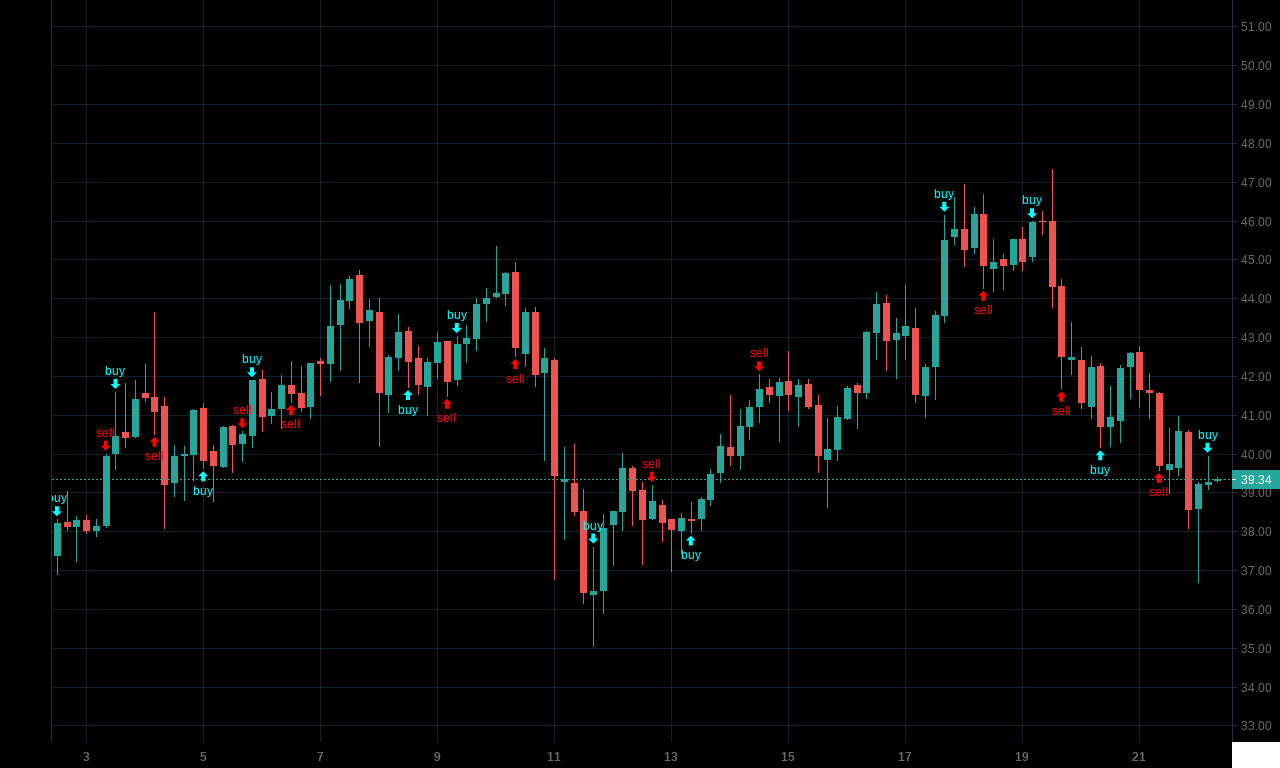
Earlier today, cryptocurrency trading bot @Gainzybot gave a buy signal for BNB, when the price was trading at $39.34.
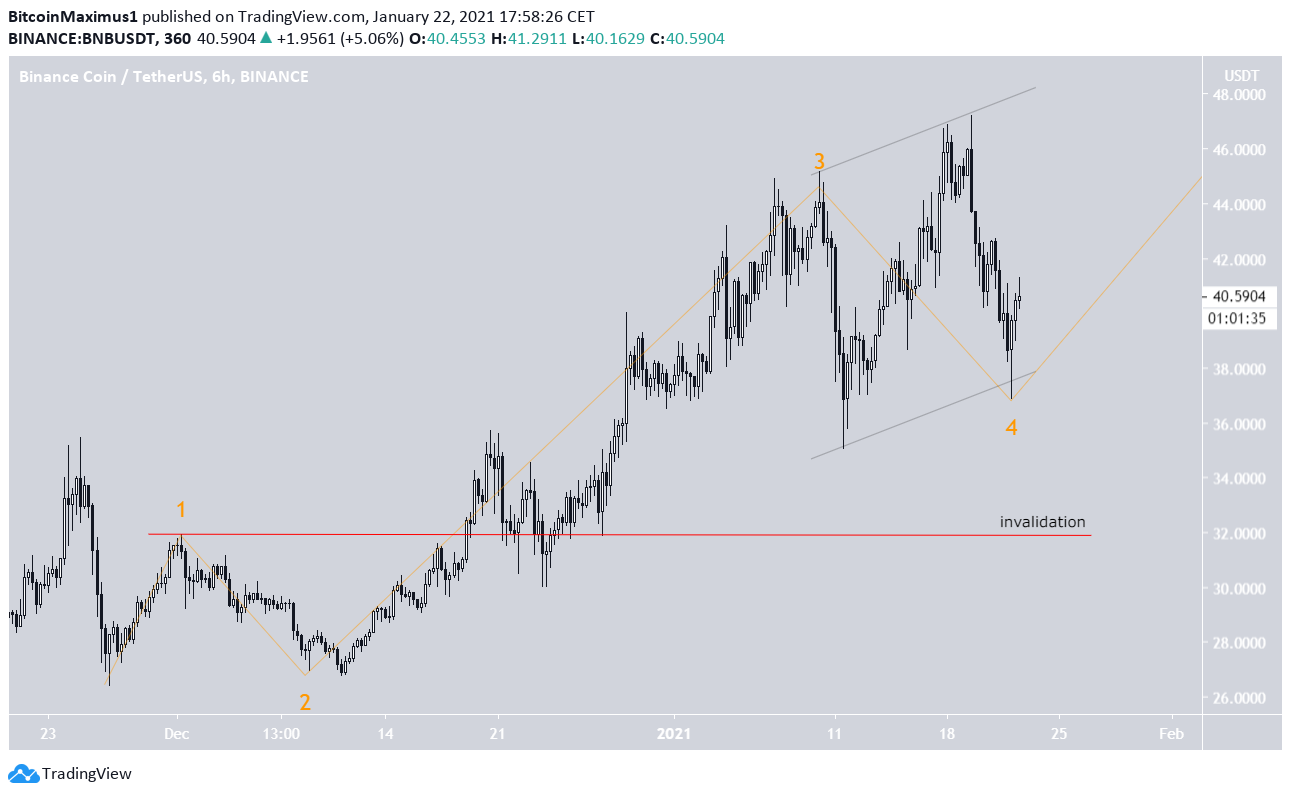
BNB has bounced since then, after completing what looks like a running flat correction, which is perfectly contained inside a parallel channel.
While it is possible that the price decreases slightly lower, the formation would remain valid unless it drops below $32.
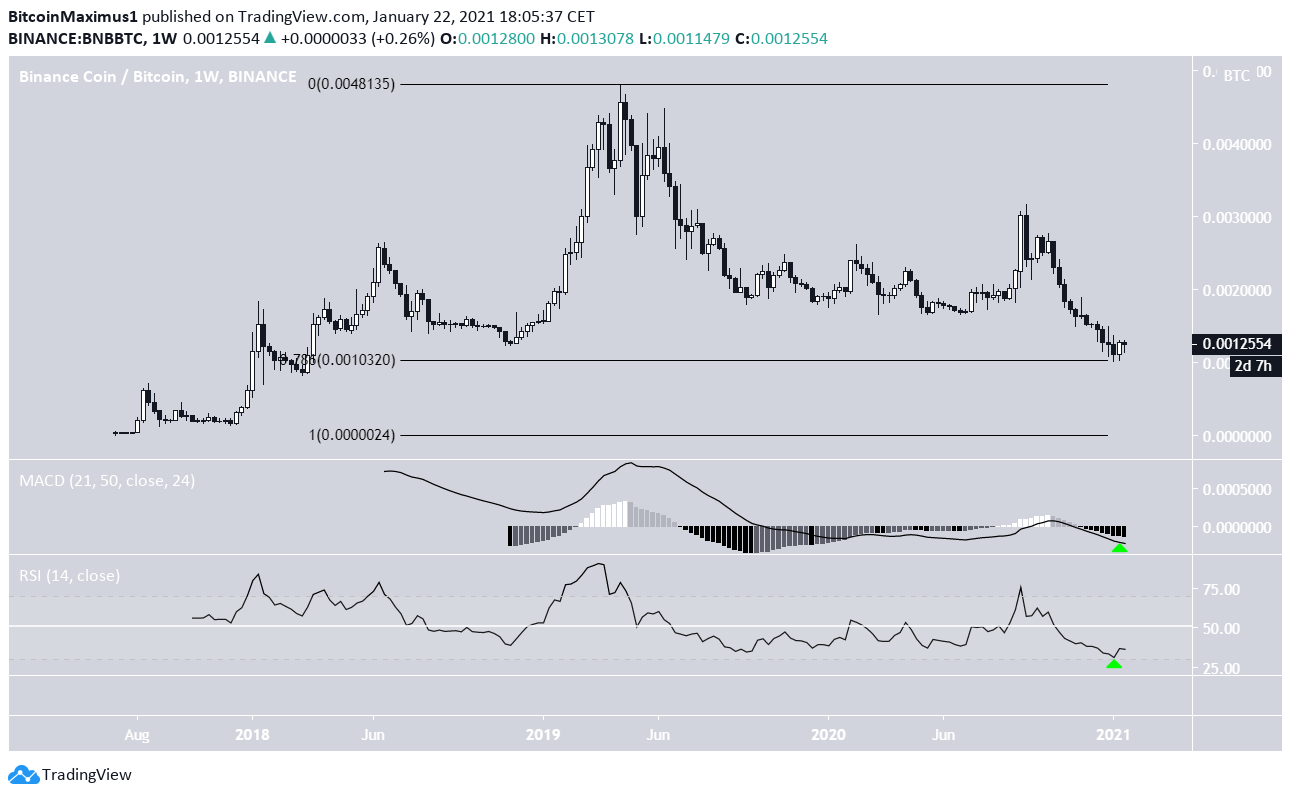
BNB/BTC
BNB/BTC has been decreasing since reaching an all-time high price on Feb 2019. Currently, it is trading right at the 0.786 Fib retracement level.
While this is a strong support level which often initiates reversals, there is no confirmation that the trend has become bullish.
While the RSI and MACD are at their lowest ever levels, there are no clear reversal signs yet.
Conclusion
To conclude, BNB/USD is expected to resume its upward movement towards $51-$54. While BNB/BTC has reached a strong support level, there are no bullish reversal signs in place yet.
For BeInCrypto’s latest Bitcoin (BTC) analysis, click here!


