


The BNB price is trading just below an important horizontal resistance area, a breakout above which could greatly accelerate the rate of increase.
Even though the rest of the crypto market fell sharply last week, The native token of Binance exchange maintained its footing and is currently making another attempt at breaking out. If it is successful, it will confirm that the long-term trend is still bullish.
Price Nears Critical Resistance
The BNB price has increased alongside an ascending support line since June 2022. More recently, the price bounced above the line in March 2023. When the price follows a diagonal line for such a long time, the structure is considered intact as long as the price does not break down from it.
Currently, the price trades just below the $350 horizontal resistance area. Combined with the line, this creates an ascending triangle, considered a bullish pattern Therefore, it leads to breakouts the majority of the time.
If the BNB price breaks out, the next resistance will be at $660. Projecting the triangle‘s height to the breakout level aligns with this target (white).
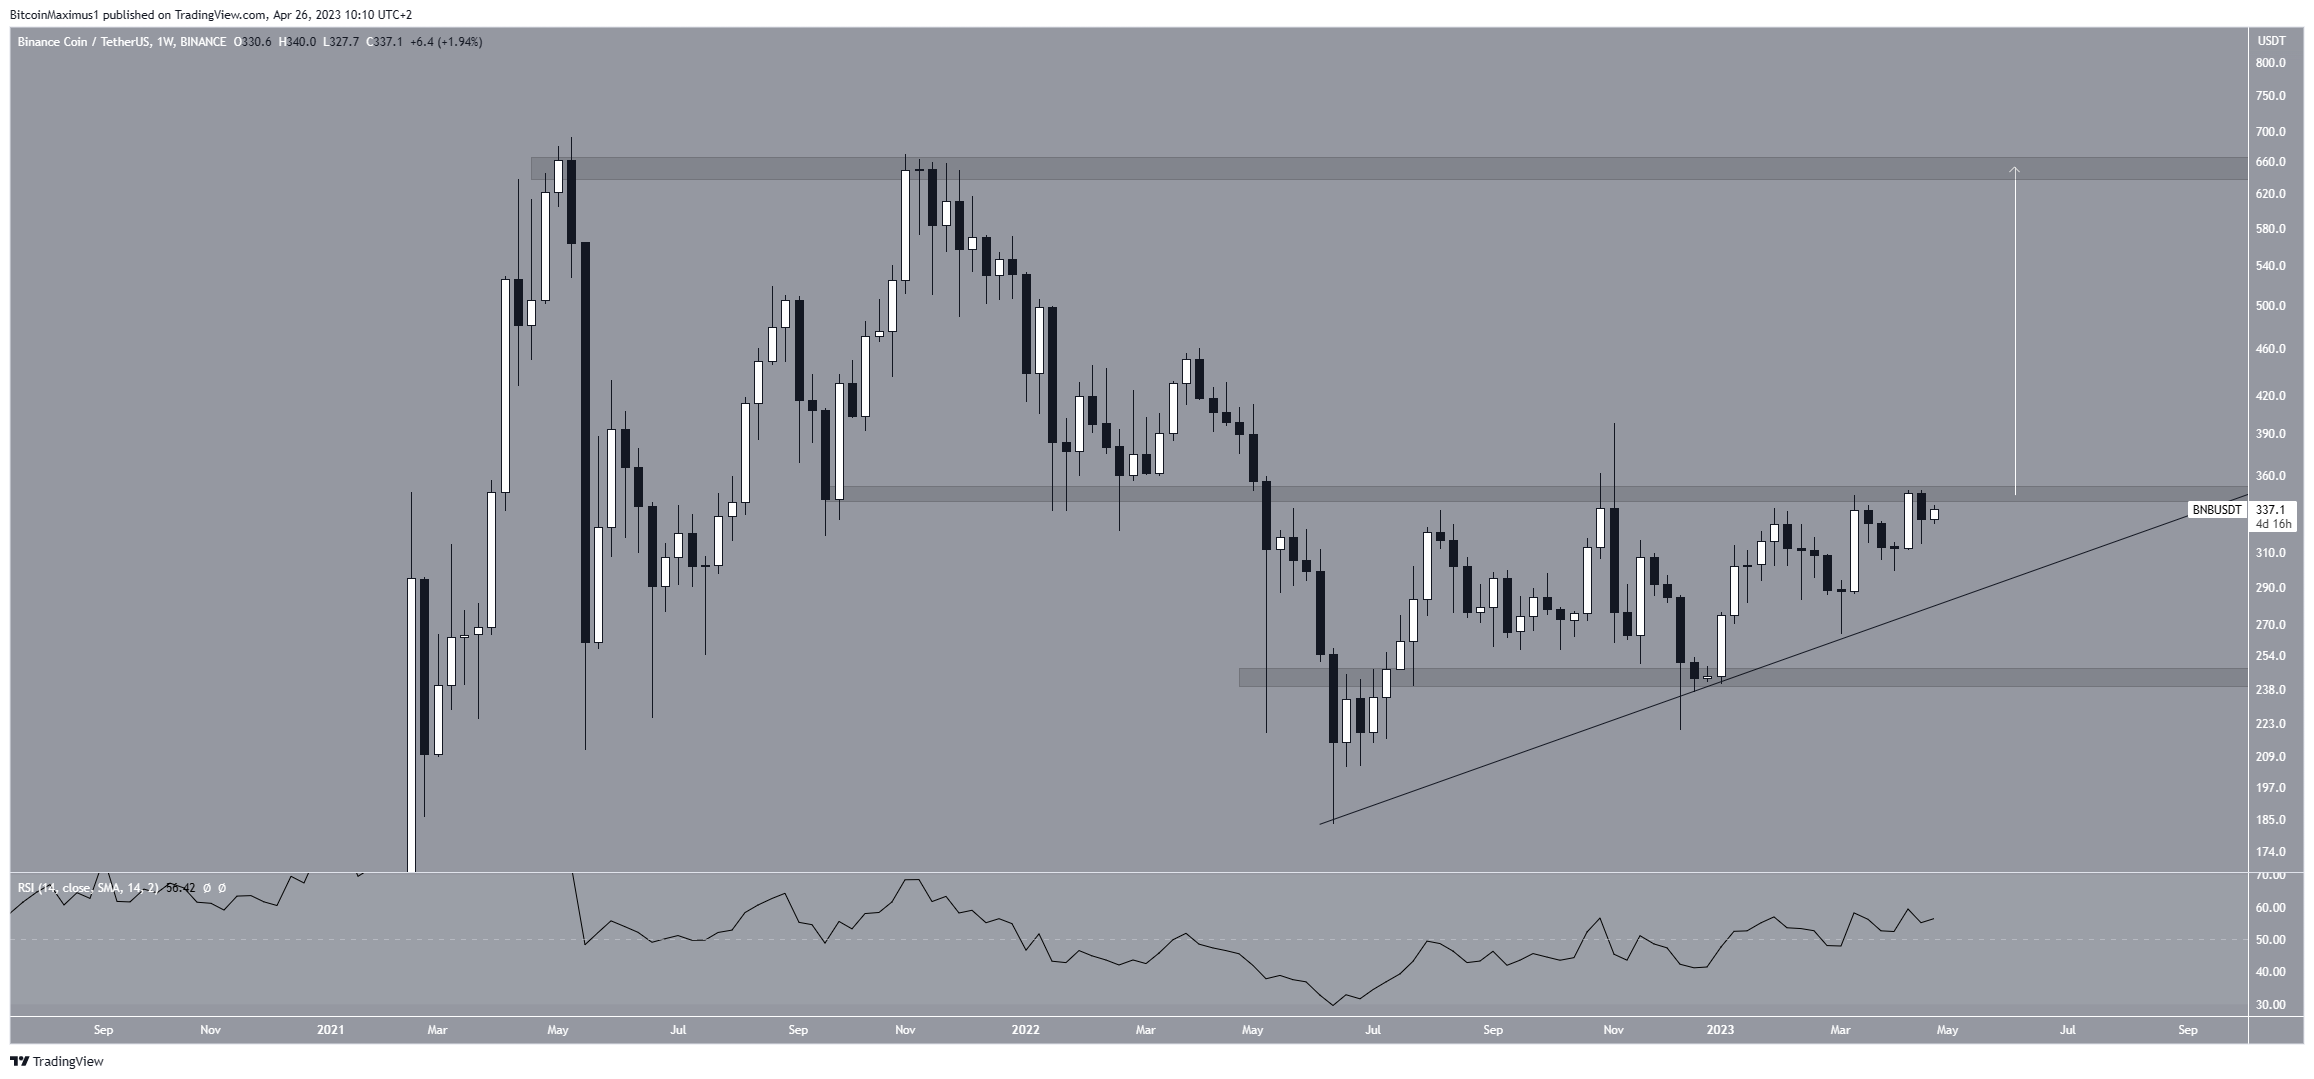
The weekly Relative Strength Index (RSI) supports the continuation of the increase. Market traders use the RSI as a momentum indicator to identify overbought or oversold conditions and to decide whether to accumulate or sell an asset. Readings above 50 and an upward trend indicate that bulls still have an advantage, whereas readings below 50 suggest the opposite. Since the RSI is above 50 and increasing, it means that the trend is bullish.
BNB Price Prediction: Will It Break Out?
The technical analysis and daily time frame price movement give a bullish BNB price prediction. Therefore, it suggests that the price will break out from the long-term $350 resistance area. Both the RSI and price action support this possibility.
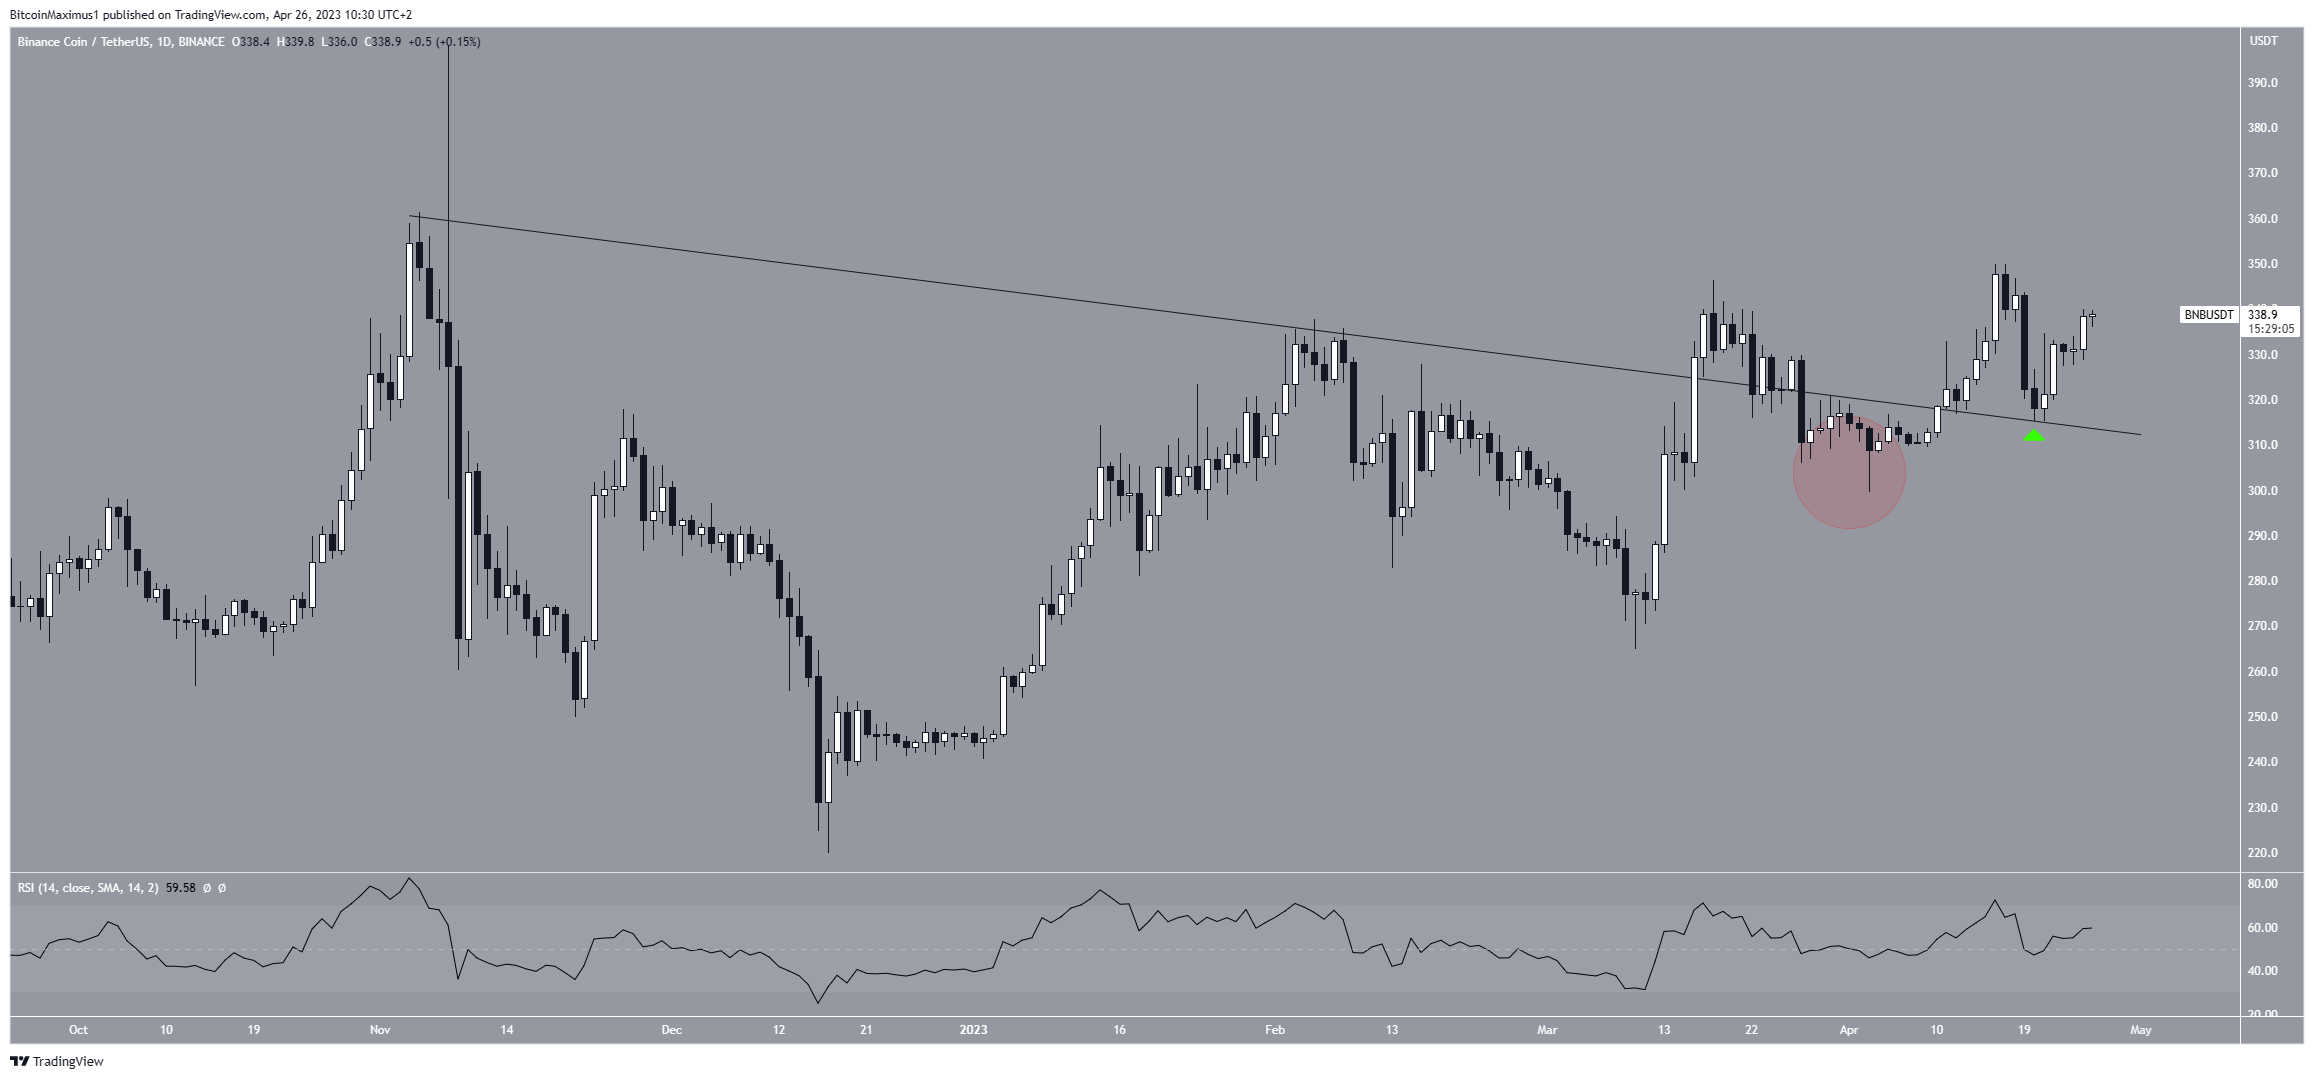
The RSI is above 50 and increasing. As outlined above, this is a sign of a bullish trend. While BNB decreased below the line in April (red circle), it reclaimed it shortly afterward and then validated it as support in April (green icon). Both the breakout and deviation followed by a reclaim are considered bullish signs. As a result, they indicate that the BNB token price can break out from the $350 area and increase toward $660.
However, if the BNB price closes below the ascending support line, it will invalidate this bullish hypothesis. In that case, BNB could fall to the next closest resistance at $245.
For BeInCrypto’s latest crypto market analysis, click here


