
At BeInCrypto, we provide regular updates of the most relevant and popular cryptocurrencies and digital assets on the market. Today we are going to do an analysis on both Tron and BitTorrent Token.
BitTorrent is the world’s largest peer-to-peer (P2P) filesharing network. It was acquired by the TRON Foundation in July 2018.
On 2019, an ICO for TRON’s BitTorrent Token (BTT) was hosted on Binance Launchpad on Jan 28, 2019.
Monthly airdrops of BTT occur on the 11th of every month until Feb 11, 2025. The first airdrop occurred on Mar 11, 2019. Anyone who owned BTT prior to this date received free tokens.
These airdrops are scheduled to continue on the 11th of every month until Feb 11, 2025. The next airdrop is scheduled to be on Apr 11.
To learn more about BitTorrent airdrops, click on the green button below:
BiTTorrent Tokens Monthly Airdrops Info
Now let’s compare the prices of TRON and its pet project. We’ll start with BitTorrent Token:BitTorrent Token (BTT) Technical Analysis
On Apr 2, the price of BTT reached a high of nearly $0.0083. It reached a similar level on Apr 6. It has been decreasing since.
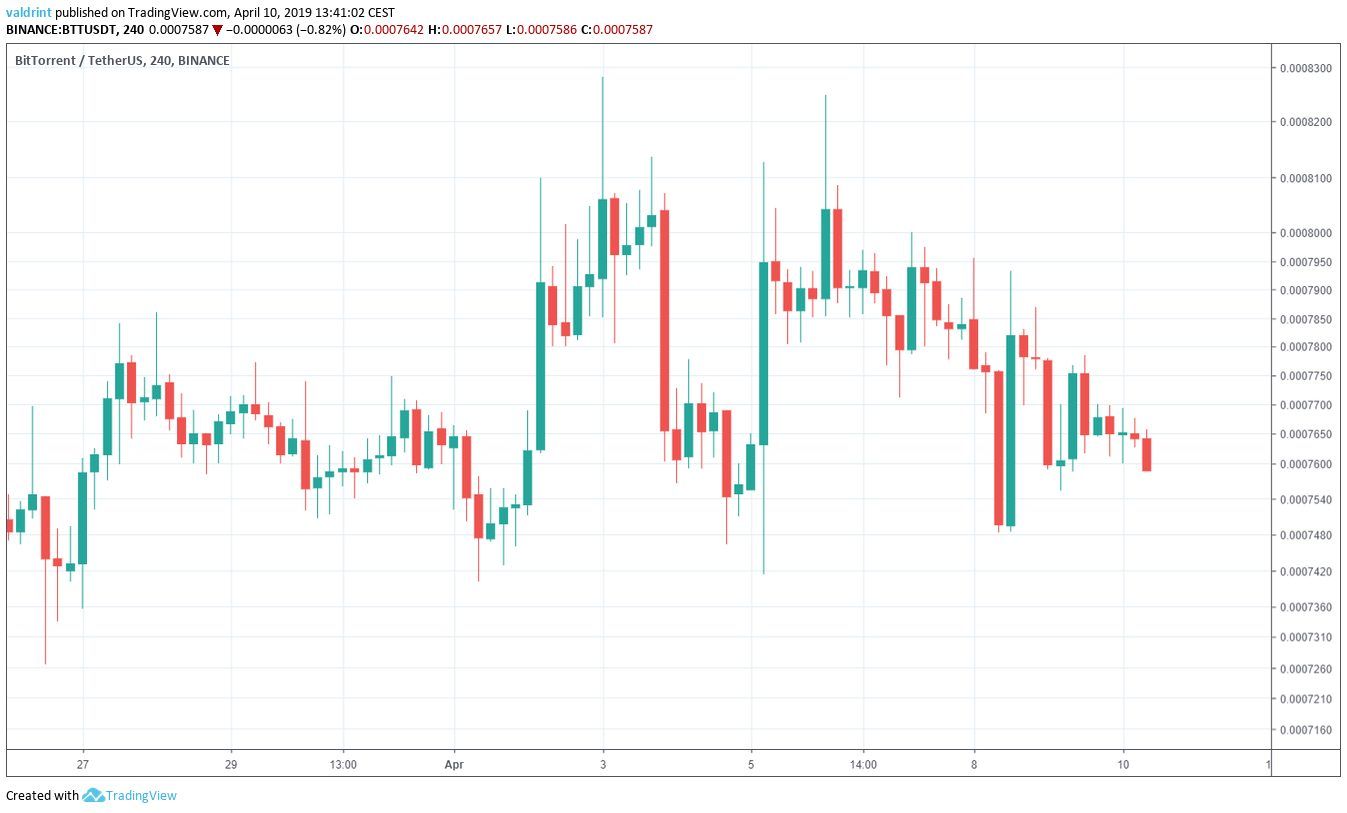
BitTorrent Token (BTT): Trends And Highlights for April 10.
- BitTorrent Token has been on a gradual downtrend since Apr 2.
- BTT is trading inside a symmetrical triangle and below the 20- and 50-period moving averages.
- There is resistance near $0.00081 and support near $0.000725.
About the Current Trading Pattern
The price of BitTorrent (BTT) on Binance is analyzed at four-hour intervals from Mar 25 to Apr 10 to define its current trading pattern. On Mar 26, the price made a low of $0.00072. Several market cycles have been completed and the price has made higher lows each time. Tracing these lows gives us an ascending support line: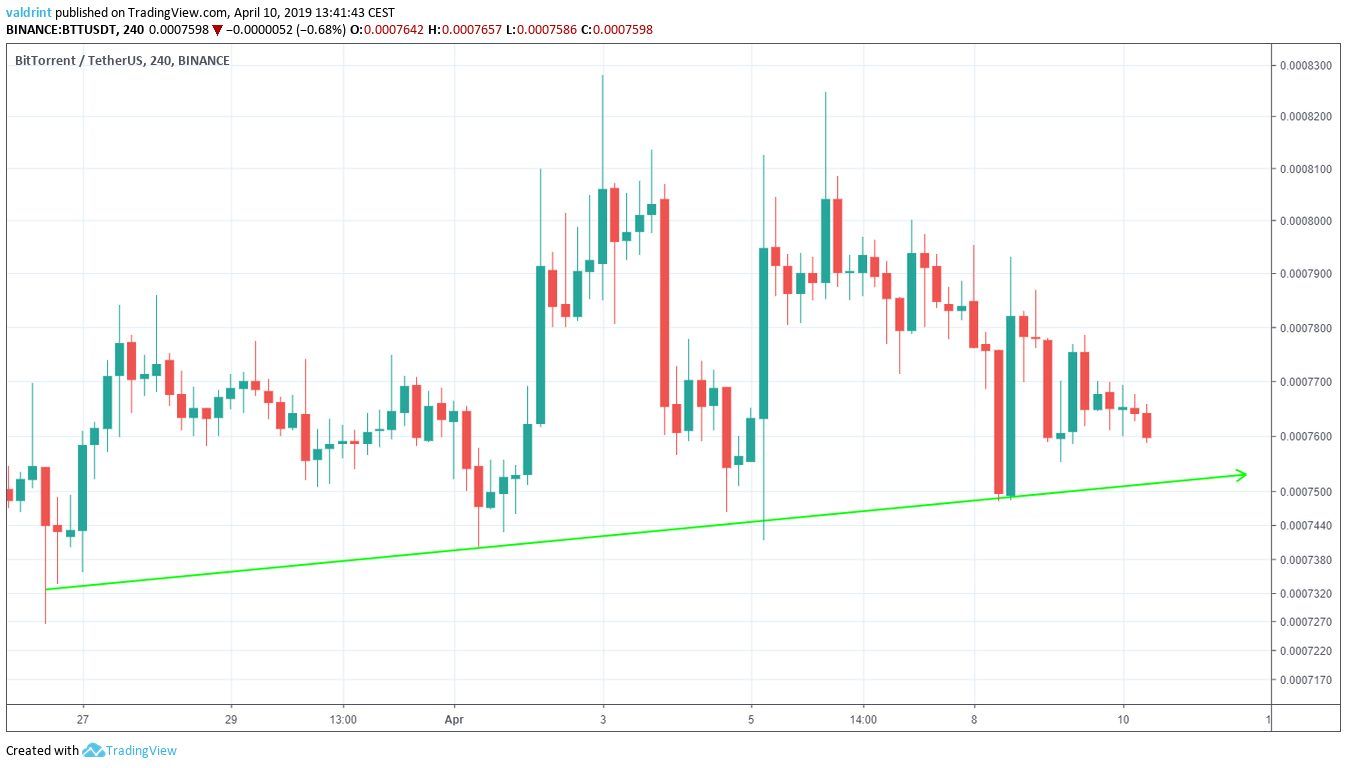 The price of BitTorrent reached a high of $0.00082 on Apr 3. A sharp decrease was followed by a gradual increase. The price has made several lower highs.
Tracing these highs gives us a descending resistance line.
These resistance and support lines combine to create a symmetrical triangle:
The price of BitTorrent reached a high of $0.00082 on Apr 3. A sharp decrease was followed by a gradual increase. The price has made several lower highs.
Tracing these highs gives us a descending resistance line.
These resistance and support lines combine to create a symmetrical triangle:
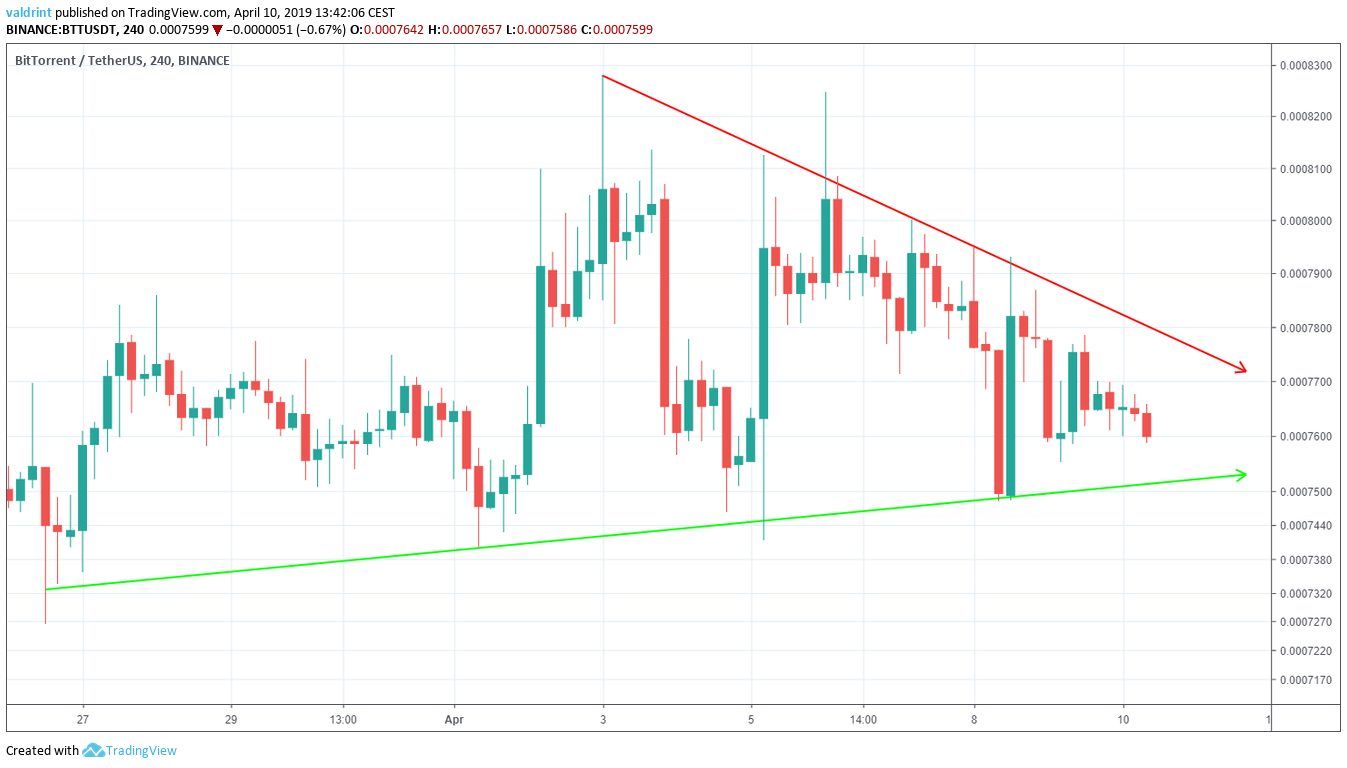 The price is likely to move inside the confines of this triangle until a decisive move occurs.
In order to figure out the direction of this move, we need to take a look at some technical indicators.
The price is likely to move inside the confines of this triangle until a decisive move occurs.
In order to figure out the direction of this move, we need to take a look at some technical indicators.
Moving Averages
To better assess the possibility of price losses, we incorporate moving averages into the analysis.
What are Moving Averages? Moving averages are tools used in technical analysis to smooth out price action. It is a lagging indicator since it is based on past prices. The relationship between price and moving averages can help in identifying the type of current trend. The relationship between short and long-term moving averages can help in identifying the beginning and end of a trend.
In the chart below 20-period moving averages are traced in red while 50-period moving averages are traced in green:
 We can see that the price is trading below both of them MAs. Furthermore, on Apr 9, the 20-period crossed below the 50-period MA.
This is known as a bearish cross and often indicates that a new downtrend may have begun.
This confirms that BTT is currently in a downtrend and that price losses are likely forthcoming in the short-term. However, this loss may be postponed because of Apr 11’s airdrop.
We can see that the price is trading below both of them MAs. Furthermore, on Apr 9, the 20-period crossed below the 50-period MA.
This is known as a bearish cross and often indicates that a new downtrend may have begun.
This confirms that BTT is currently in a downtrend and that price losses are likely forthcoming in the short-term. However, this loss may be postponed because of Apr 11’s airdrop.
Postponed Losses?
During the airdrop on Mar 11, the price of BTT skyrocketed and then plummeted near prior trading levels. Thus, we may see a rapid spike followed by a plummet to current levels. Then, longer-term losses are likely to be expected along this downtrend. Another analysis of BTT will be performed on Apr 12 to assess whether the airdrops are beginning to correlate with a regular pump and dump. If such a correlation exists, we’ll continue analyzing monthly airdrops to see if a regular pattern emerges.Future Movement
We do not believe the airdrop will cause significant deviations from the current trading pattern. Thus, resistance and support areas are incorporated into this analysis based on the symmetrical triangle defined above.Resistance and support areas are formed when the price revisits the same level several times. They indicate possible future prices based on past patterns.
A resistance and support area are traced below.
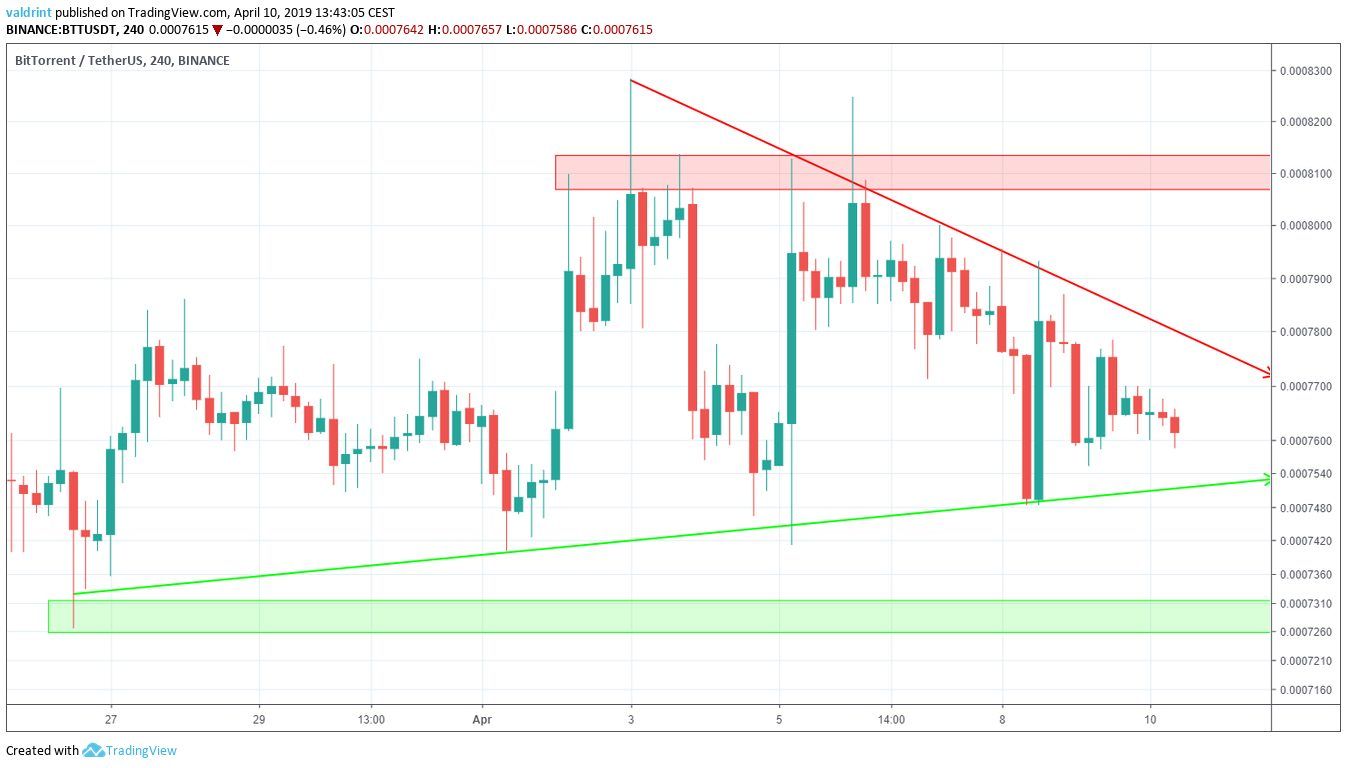 The closest support area is found near $0.000725. If the price breaks down from the triangle, it is likely to provide an area of reversal.
The closest resistance area is found near $0.00081. If the price breaks out of the triangle, it is likely to reach this area.
If the correlation we suggested in the previous section proves valid, the price of BitTorrent Token may spike to or above the resistance level. However, prices would then drop to their current levels within a very short period.
Thus, while the resistance may be met, it is unlikely to be sustained.
Prices are likely to fall toward the support whether or not this spike occurs.
The closest support area is found near $0.000725. If the price breaks down from the triangle, it is likely to provide an area of reversal.
The closest resistance area is found near $0.00081. If the price breaks out of the triangle, it is likely to reach this area.
If the correlation we suggested in the previous section proves valid, the price of BitTorrent Token may spike to or above the resistance level. However, prices would then drop to their current levels within a very short period.
Thus, while the resistance may be met, it is unlikely to be sustained.
Prices are likely to fall toward the support whether or not this spike occurs.
Summary of Analysis
Based on this analysis, it is likely that the price keeps trading inside the confines of the triangle and possibly breaks down following a massive price spike. This could cause a false breakout. Any rapid gains around the time of the airdrop are not expected to be maintained. Do you think the price of BTT will keep trading inside the triangle? Let us know your thoughts in the comments below.Tron (TRX) Technical Analysis
In our Mar 28 analysis of TRX, we predicted slight increases. Our prediction was validated when the price stayed inside the confines of the triangle we have defined below. A breakout occurred on Apr 2. To learn more, read our latest analysis below:
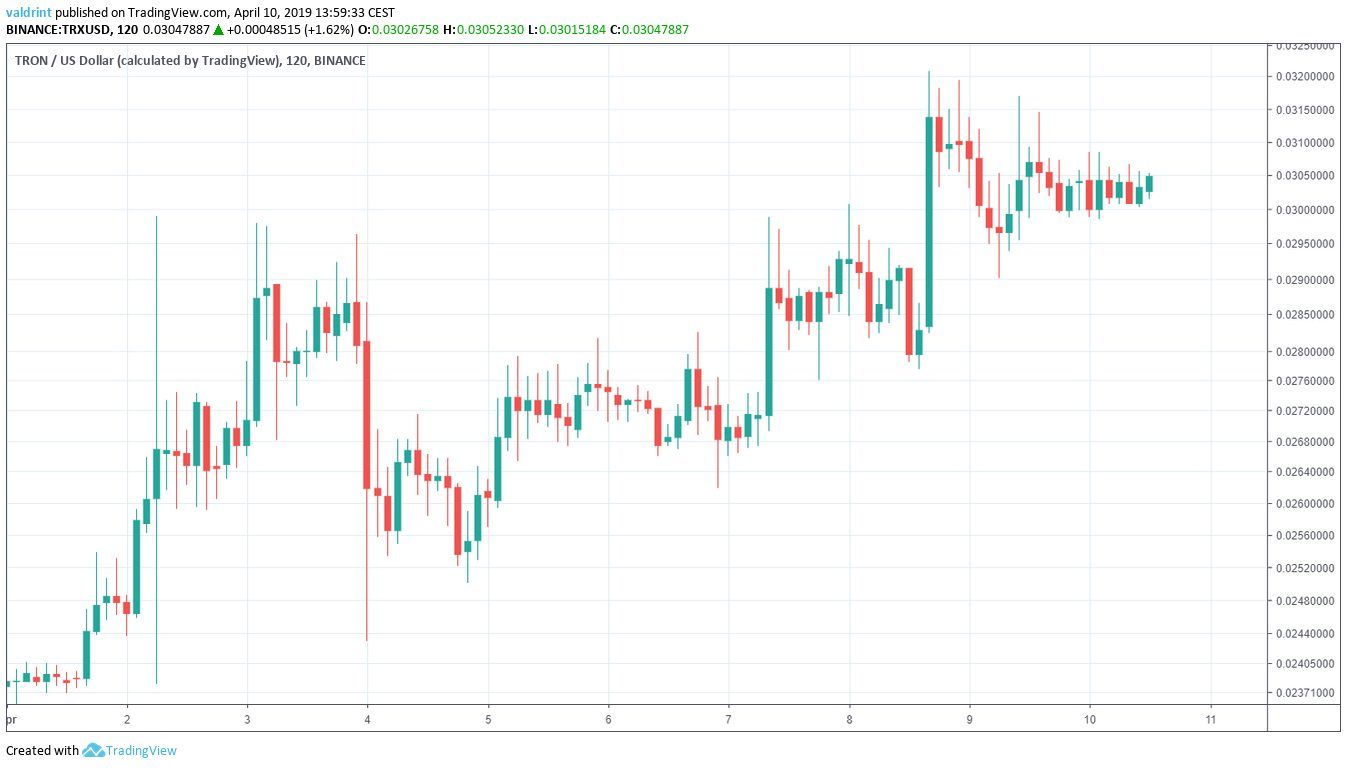
On Apr 1, the price began a rapid upward movement. It eventually reached a high of $0.32 on Apr 8. It has been decreasing since.
Tronix (TRX): Trends And Highlights For April 10, 2019
- The price of Tronix—often referred to as simply Tron or TRX—is trading inside an ascending channel.
- TRX is following a longer-term ascending support line.
- Bearish divergence is developing in the RSI.
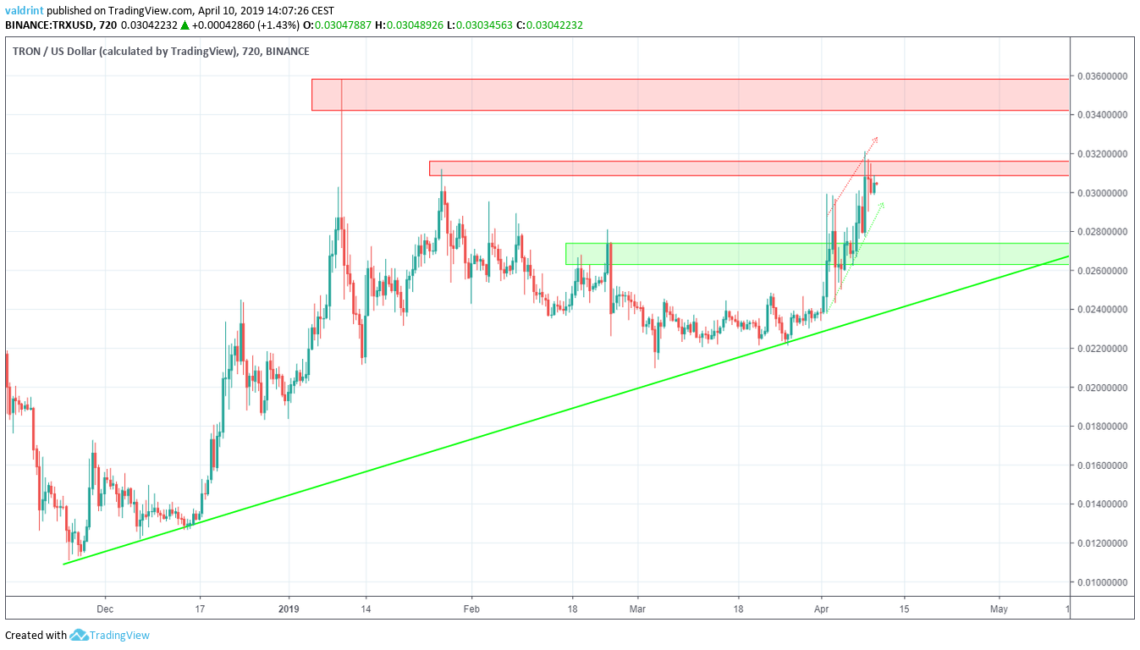
- There are resistance areas near $0.031 and $0.035 while the closest support area is found near $0.027.
Horizontal Channel
We begin our analysis by defining Tron’s current trading pattern. We do this by analyzing the price of TRX on Binance at two-hour intervals from Apr 2 to Apr 10. Tron reached a low of $0.023 on Apr 2. A gradual increase in price ensued. Several market cycles were completed with each low being higher than the previous one. Tracing these lows gives us an ascending support line: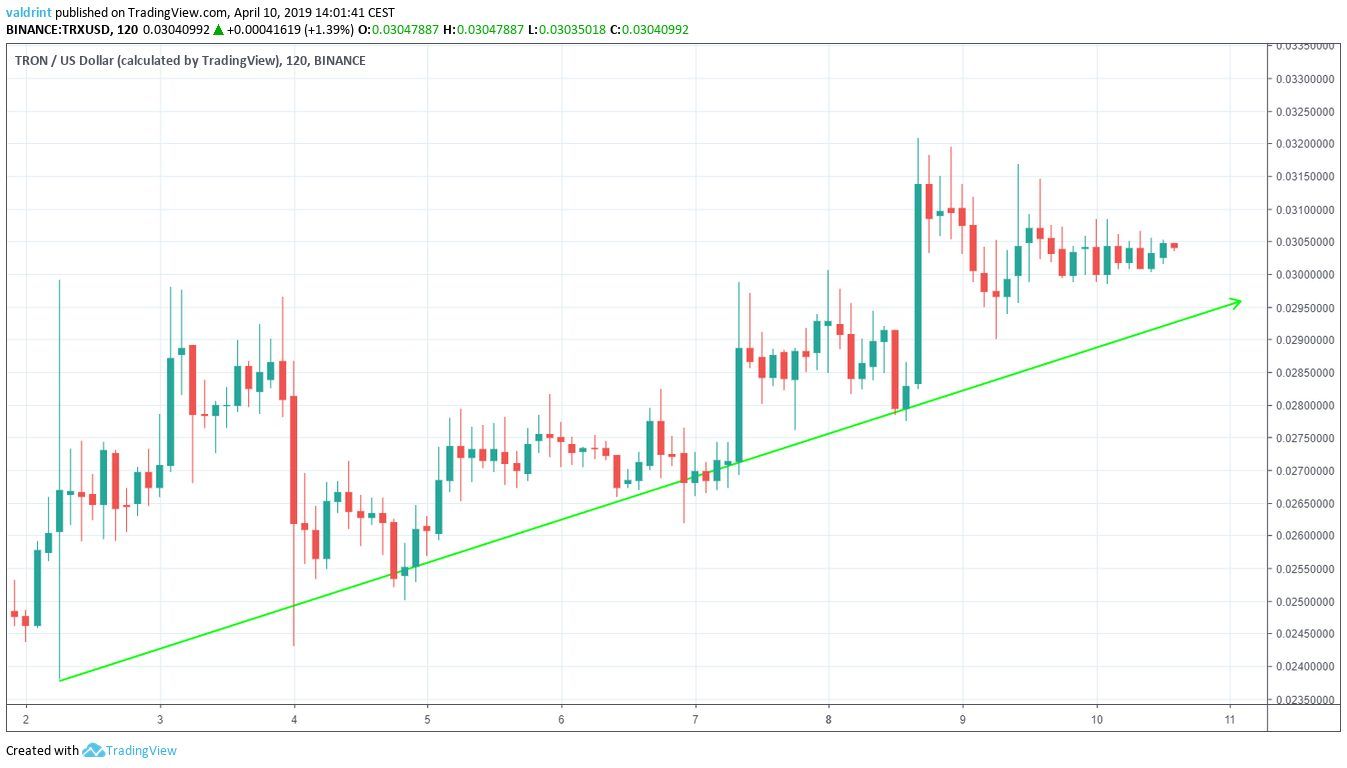 The price of Tron reached a high of $0.028 on Apr 2. It has been increasing, creating several higher highs.
Tracing these highs gives us an ascending resistance line.
Furthermore, the resistance and support lines combine to create an ascending channel:
The price of Tron reached a high of $0.028 on Apr 2. It has been increasing, creating several higher highs.
Tracing these highs gives us an ascending resistance line.
Furthermore, the resistance and support lines combine to create an ascending channel:
 This channel is a generally neutral trading pattern. Price is expected to rise and fall between support and resistance.
Bearish Divergence
To better determine the future movement of Tron, we analyze its price at 12-hour intervals from Nov 2018 to Apr 2019 alongside the relative strength index (RSI).About the RSI: The relative strength index (RSI) is an indicator which calculates the size of the changes in price in order to determine oversold or overbought conditions in the market. Combining RSI bullish/bearish divergence with support/resistance essentially predicts price fluctuations.
RSI is shown below price in the chart below:
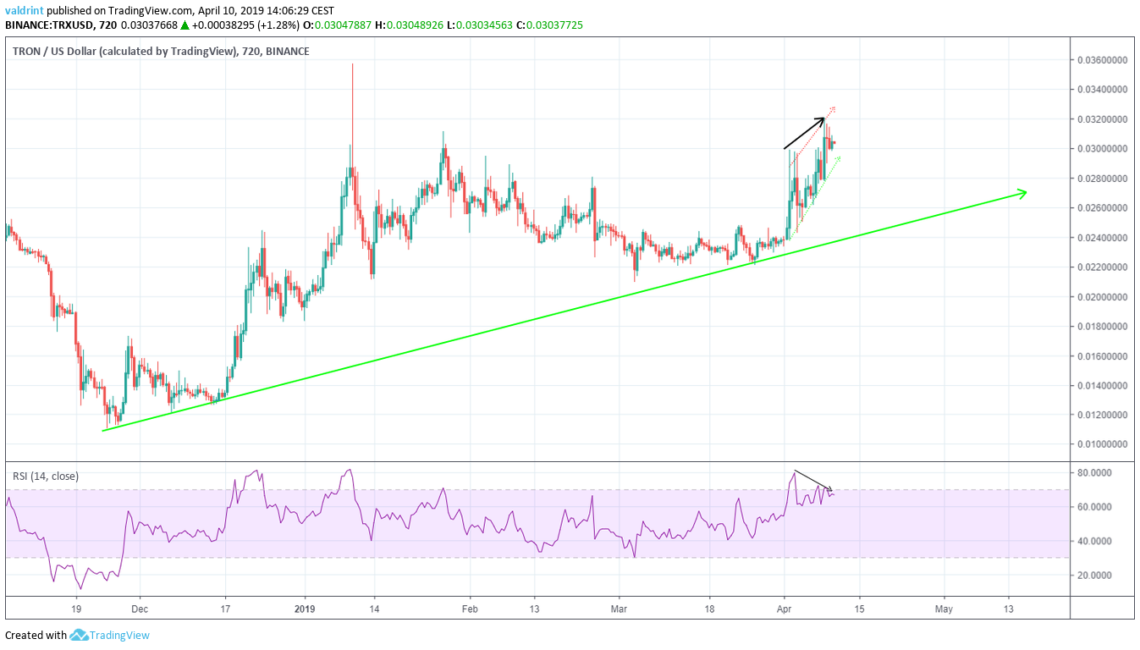 The price has been on an uptrend since Nov 21, 2018.
The channel we have outlined in the section above is drawn in dotted lines.
The price made a high of $0.028 on Apr 2. It reached a higher high of $0.032 on Apr 8.
Similarly, the RSI made the first high on Apr 2. However, it has generated lower values since.
This is known as bearish divergence and often precedes price decreases.
This suggests that TRX may drop toward the support line of the channel. However, it is also possible that the BitTorrent airdrop may lead to noticeable short-term rises before continued losses.
The price has been on an uptrend since Nov 21, 2018.
The channel we have outlined in the section above is drawn in dotted lines.
The price made a high of $0.028 on Apr 2. It reached a higher high of $0.032 on Apr 8.
Similarly, the RSI made the first high on Apr 2. However, it has generated lower values since.
This is known as bearish divergence and often precedes price decreases.
This suggests that TRX may drop toward the support line of the channel. However, it is also possible that the BitTorrent airdrop may lead to noticeable short-term rises before continued losses.
Reversal Areas
About Resistance and Support Areas: Resistance and support areas are formed when the price reaches a certain level several times. They can act as a ceiling/floor that prevents the price from moving further in that direction.
Summary of Analysis
Based on this analysis, it is likely that the price will break down from the channel and drop to the long-term support line.Do you think TRON will break down from this channel? Let us know your thoughts in the comments below!
Disclaimer: This article is not trading advice and should not be construed as such. Always consult a trained financial professional before investing in cryptocurrencies, as the market is particularly volatile.
Top crypto platforms in the US

 eToro
Explore
Explore
Explore
Explore
eToro
Explore
Explore
Explore
Explore
Don’t invest unless you’re prepared to lose all
the money you invest.
This is a high-risk investment and you should not expect to be protected if something goes wrong.
Take 2 mins to learn more
Don’t invest unless you’re prepared to lose all
the money you invest.
This is a high-risk investment and you should not expect to be protected if something goes wrong.
Take 2 mins to learn more
Don’t invest unless you’re prepared to lose all
the money you invest.
This is a high-risk investment and you should not expect to be protected if something goes wrong.
Take 2 mins to learn more
Don’t invest unless you’re prepared to lose all
the money you invest.
This is a high-risk investment and you should not expect to be protected if something goes wrong.
Take 2 mins to learn more
Don’t invest unless you’re prepared to lose all
the money you invest.
This is a high-risk investment and you should not expect to be protected if something goes wrong.
Take 2 mins to learn more
Don’t invest unless you’re prepared to lose all
the money you invest.
This is a high-risk investment and you should not expect to be protected if something goes wrong.
Take 2 mins to learn more
Top crypto platforms in the US
Uphold
eToro
eToro
eToro
eToro
Plus500
Coinbase
Moonacy
Don’t invest unless you’re prepared to lose all
the money you invest.
This is a high-risk investment and you should not expect to be protected if something goes wrong.
Take 2 mins to learn more
Don’t invest unless you’re prepared to lose all
the money you invest.
This is a high-risk investment and you should not expect to be protected if something goes wrong.
Take 2 mins to learn more
Don’t invest unless you’re prepared to lose all
the money you invest.
This is a high-risk investment and you should not expect to be protected if something goes wrong.
Take 2 mins to learn more
Disclaimer
In line with the Trust Project guidelines, this price analysis article is for informational purposes only and should not be considered financial or investment advice. BeInCrypto is committed to accurate, unbiased reporting, but market conditions are subject to change without notice. Always conduct your own research and consult with a professional before making any financial decisions. Please note that our Terms and Conditions, Privacy Policy, and Disclaimers have been updated.

Valdrin Tahiri
Valdrin discovered cryptocurrencies while he was getting his MSc in Financial Markets from the Barcelona School of Economics. Shortly after graduating, he began writing for several different cryptocurrency related websites as a freelancer before eventually taking on the role of BeInCrypto's Senior Analyst.
(I do not have a discord and will not contact you first there. Beware of scammers)
READ FULL BIO
Sponsored
Sponsored