


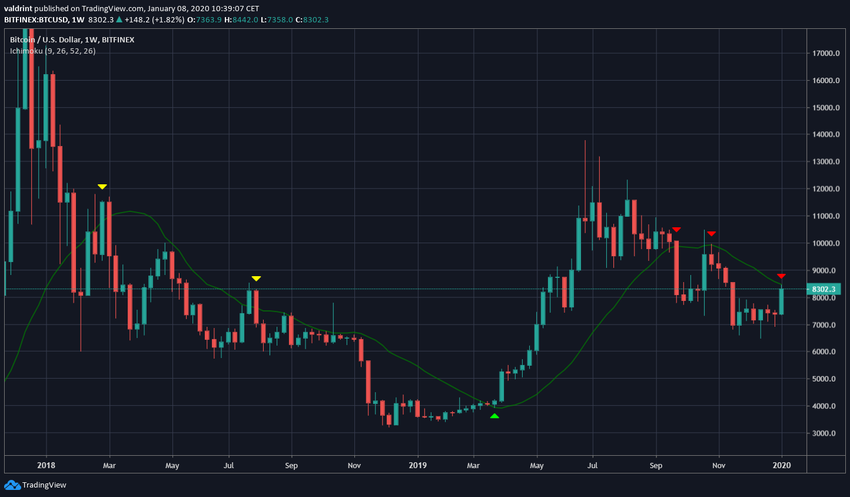
The Bitcoin price has reached its 20-week moving average (MA) and is making an attempt at moving above it.
The 20-week moving average has been a flawless predictor of the trend’s direction since December 2018. Every time the Bitcoin price has moved above it, it has continued its upward movement and vice-versa.
The MA currently coincides with the downtrend resistance line, suggesting that a breakout above it could begin a new upward move.
Bitcoin trader and YouTuber @themooncarl outlined a Bitcoin price chart and the relationship of the price to its 20-week moving average. He stated that a failure to move above the 20-week MA could lead to a decrease below $6000, while a successful breakout could lead to $9450.
#Bitcoin is currently testing the 20-week moving average.
This moving average has historically marked VERY important turning-points for Bitcoin, both bullish and bearish.
A rejection here could lead to a break below $6,000. If broken, BTC could reach $9,450 quickly! pic.twitter.com/Ud0QCJBZLY
— Carl Moon (@TheMoonCarl) January 8, 2020
Bitcoin’s 20-Week Moving Average
During the 2018 downward trend, the Bitcoin price did not react to the 20-week MA — since the price broke out above it twice and then quickly reversed. However, since reaching the $3200 bottom in December 2018, the relationship of the price to the 20-week MA has been instrumental in determining the direction of the trend:
- First, the Bitcoin price moved above it in March 2019 — initiating the upward move that continued until June.
- Afterward, the breakdown below this MA in September marked an end to the consolidation phase and the beginning of the next downward trend.
- Similarly, the price retested (but failed to break through) the MA in October and is currently making another attempt at moving above the MA.
Validity of Targets
The target for a breakout is given at $9450. While there is no exact target for the downside, the tweet suggests values below $6000.
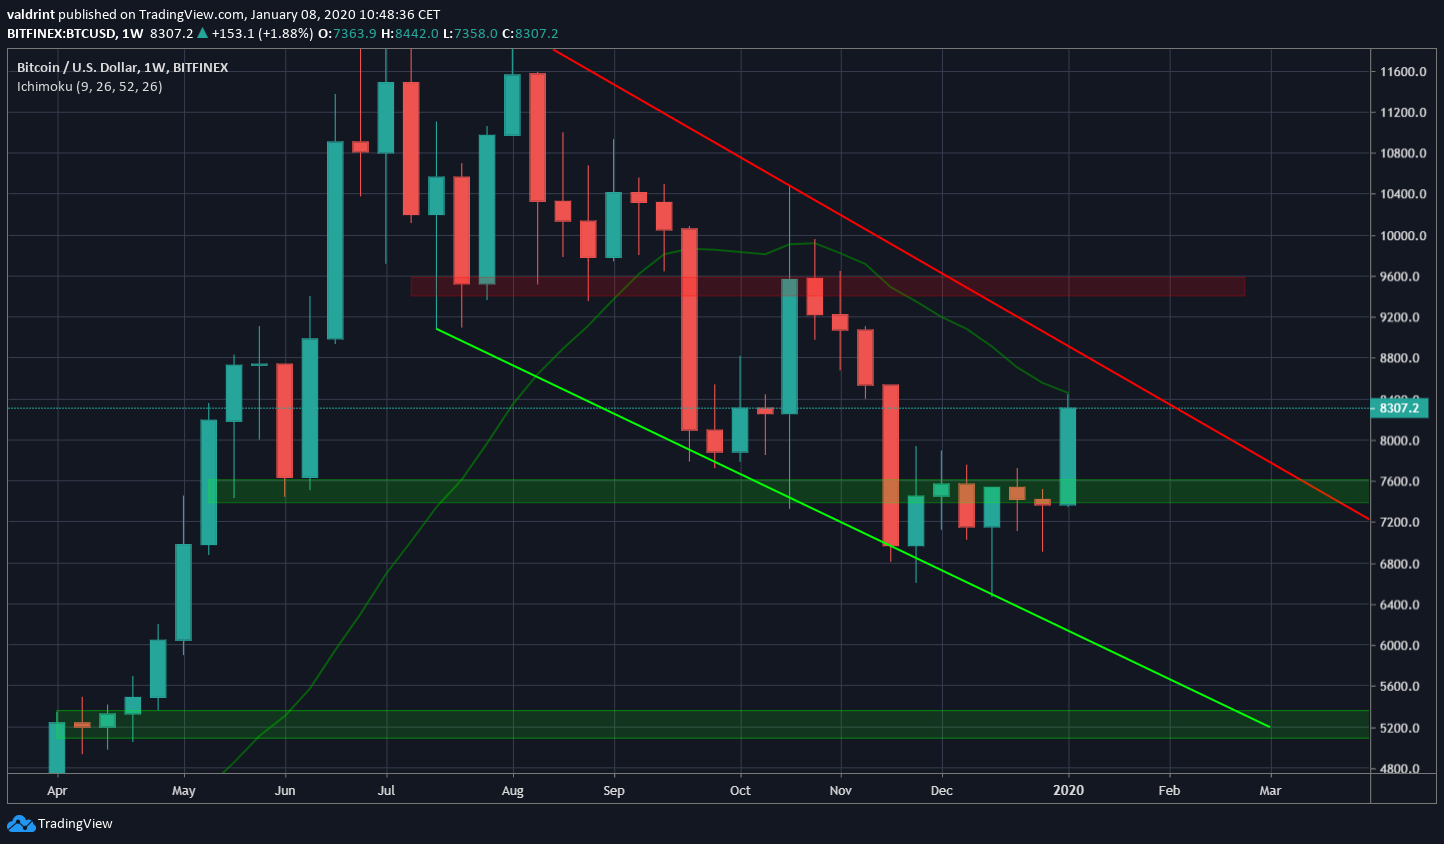
While the values could slightly differ depending on the exchange, the $9400-$9600 area acted as support and afterward as resistance, making it significant and validating it as a possible target.
On the other hand, the closest support area below $6000 is found at $5200, coinciding with the support line of the channel in March 2020.
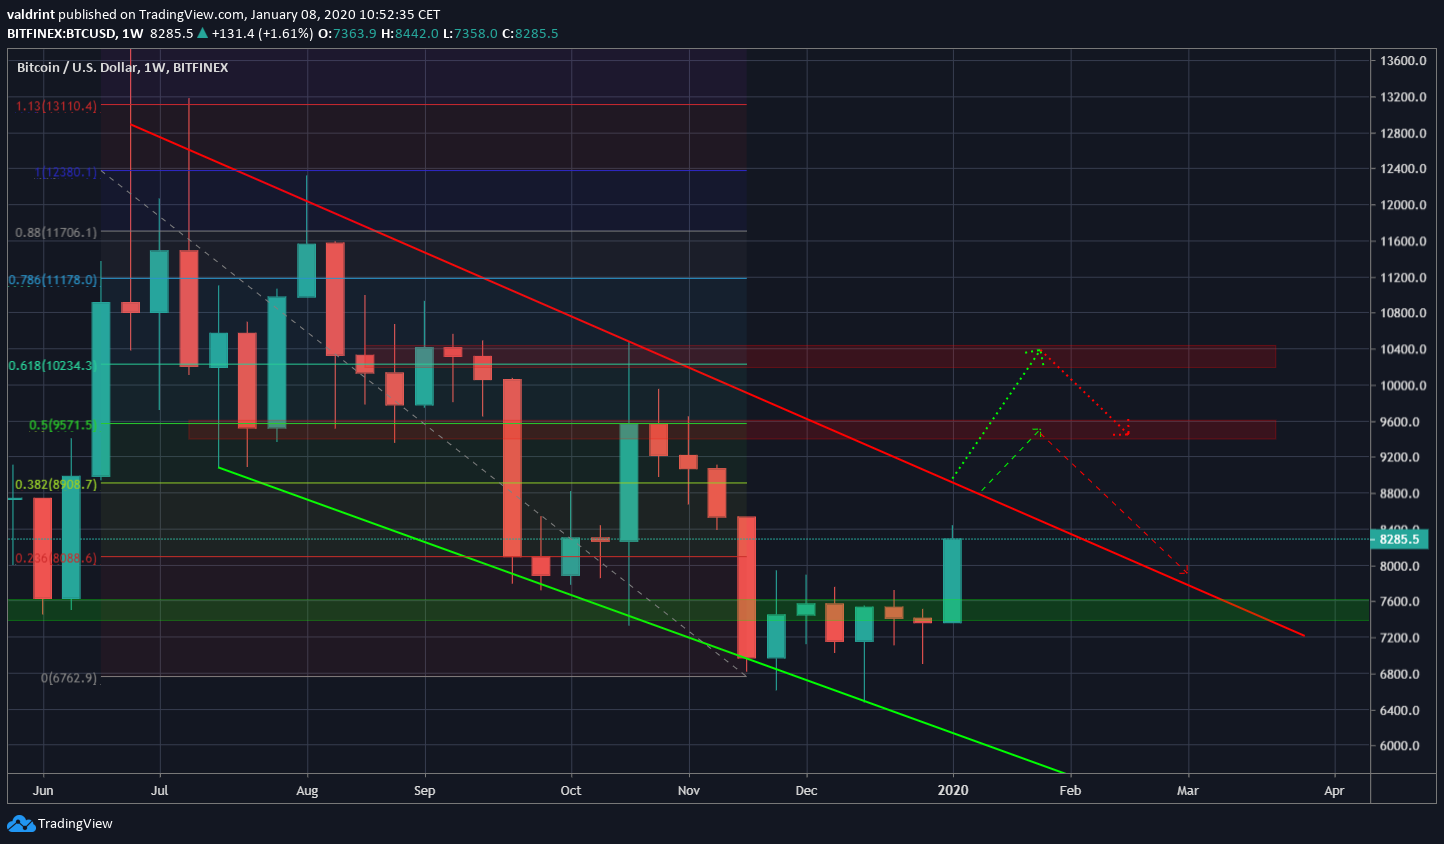
Breakout Target
In case the price breaks out, we believe a more suitable target can be found at $10,250. This is the 0.618 Fib level of the current downward trend. The reason for this is the fact that the original target of $9450 (0.5 Fib level) is very close to the descending resistance line.
A breakout above a roughly six-month descending resistance line is more often followed by a strong upward move. If the Bitcoin price were to reach $9450, it would only amount to a roughly $650 movement above the descending resistance line.
Therefore, we believe the dotted lines represent a more likely price movement than the dashed ones.
Bitcoin Breakdown Target
Even if the Bitcoin price fails to move above its 20-week MA, we do not think a decrease below $6000 is likely for several reasons:
- The $7400-$7600 support area is very significant. It acted as support since June 2019, before the price finally broke down in November. However, the lower price levels could not be sustained as BTC created several long lower wicks and moved upward. This failed breakdown suggests that the $7400-$7600 area will likely provide support to the price in the future.
- Even if the price breaks down, there should be minor support between $6400-$6800, the area in which the long lower wicks were created.
- Finally, the descending support line of the channel is currently above $6000 and will fall below $6000 at the beginning of February.
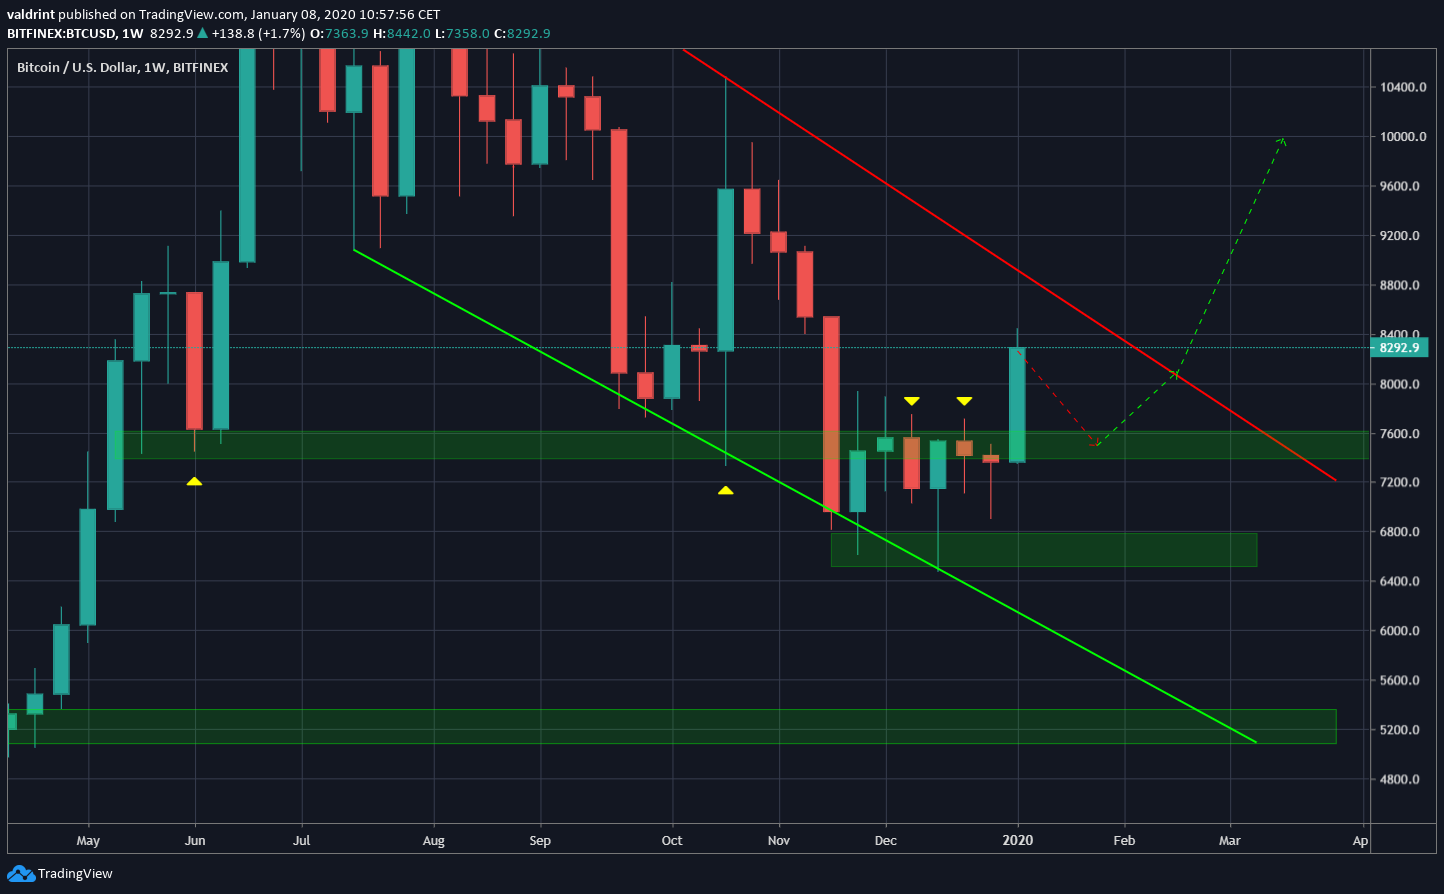
To conclude, the 20-week MA can be used as a gauge of the trend’s direction. A breakout above it and the descending resistance line could take the price to $10,200. Failure to do so would likely retest the $7400-$7600 support area.


