


Bitcoin may have had a tumultuous year so far in terms of volatility, but longer-term trends are still very healthy. The yearly moving average price for BTC is closing in on its all-time high.
This week has been one of the best so far this year for BTC prices. Since the same time last weekend, it has surged by 17%, outperforming traditional stocks and commodities yet again.
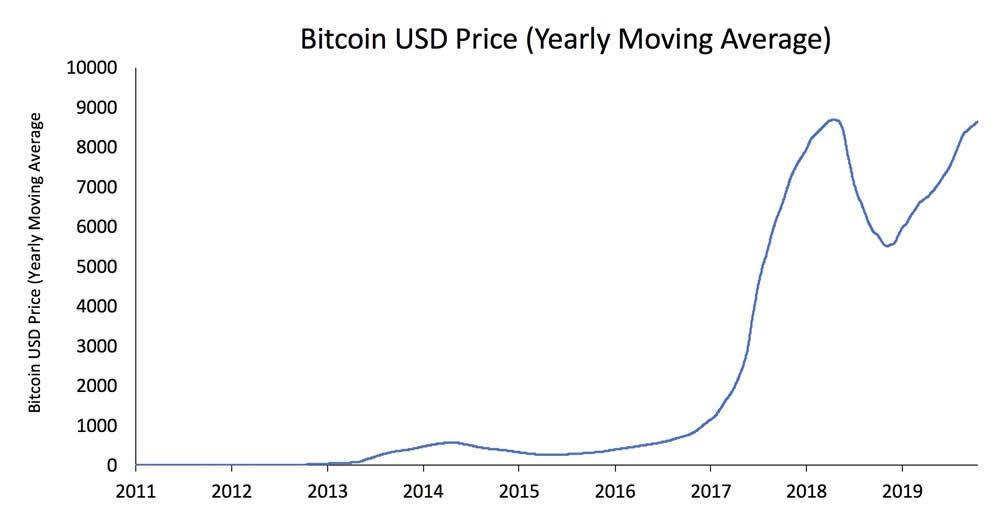
Yearly Moving Average High
Observers and analysts have noted that Bitcoin’s yearly moving average is back up from its 2018 slump, and is approaching its previous all-time high.
This does not mean that prices are approaching ATH, but the accumulation of the averages over the year is.
The 200 and 50-day moving averages have served as support and resistance levels throughout Bitcoin’s life cycle, and trading above both is generally very bullish.
The weekly chart is also looking positive at the moment with seven green candles in a row. The last time this happened was in March 2019, just before the big rally to $14,000. BTC is also trading above both the 200 and 50-week moving averages which is extremely healthy.

The next major resistance zone is around $9,720, but Bitcoin really needs to top its previous high of $10,500 for a real bull run to be registered. Forming a lower-high at the moment could result in further downsides and the resumption of the downtrend.
Bitcoin Dominance Surges
This week’s rally has also had the effect of increasing Bitcoin’s dominance as it outperforms its altcoin brethren.
BTC dominance has been on a downward trend since September 2019, and it has remained below 70% for most of this year.
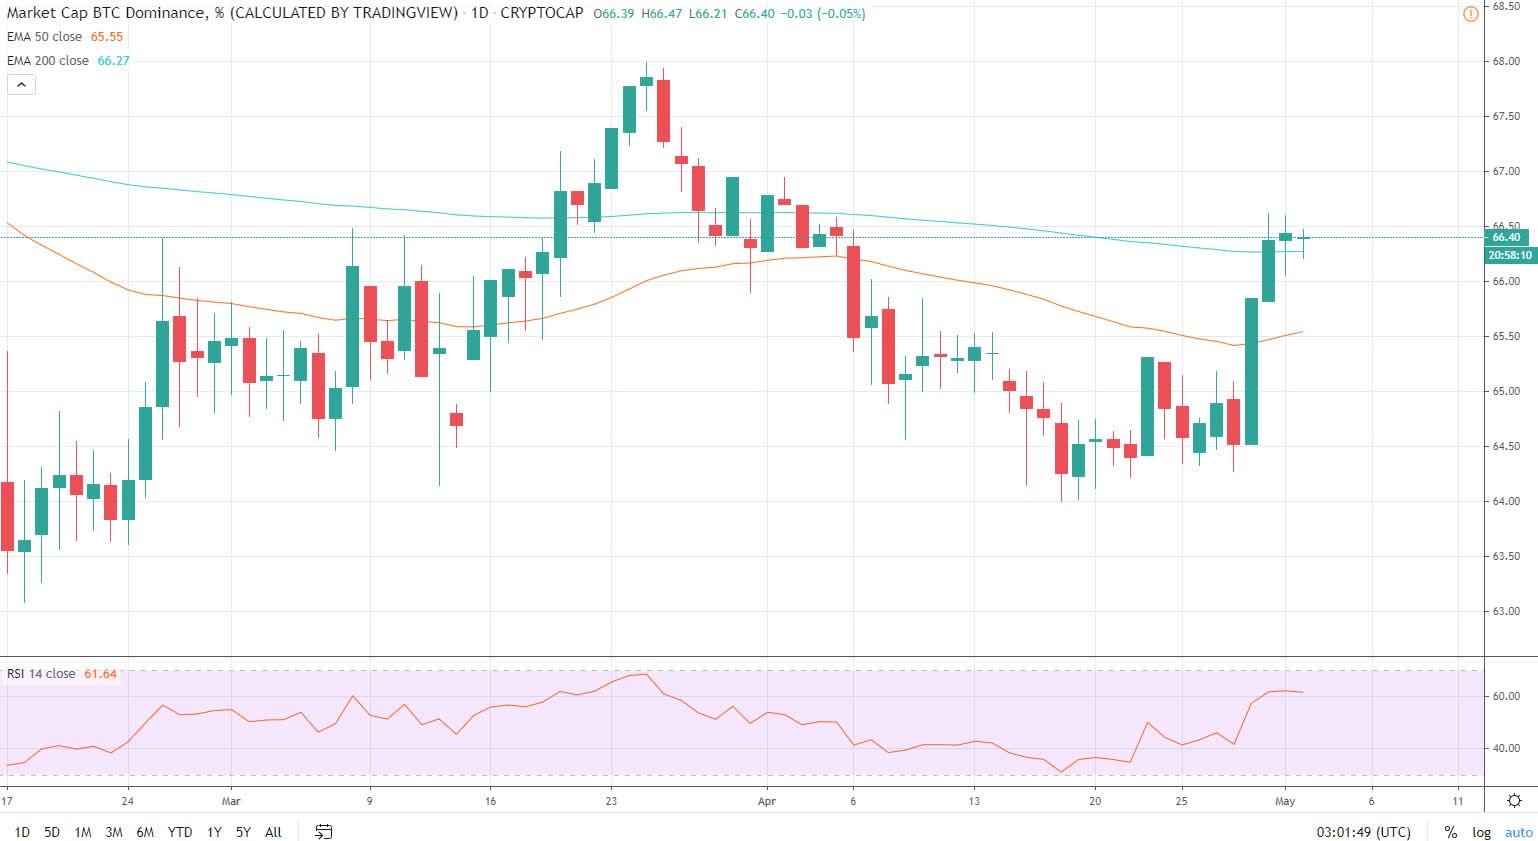
BTC dominance has increased two percent this week to 66.5% according to the charts. This means that it has gained at the expense of altcoins which have all lost long-term ground, despite enjoying gains in price this week.
Altcoin traders have been looking at the charts noting that a climb in BTC market share is bad for altcoins as they have weakened in terms of satoshi values. ‘Altcoin Sherpa’ [@AltcoinSherpa] has correlated these BTC dominance gains with the seasons, adding;
“BTC.D has risen hard in the summers the last few years, crippling altcoins during this time. June is a good time to exit all altcoins IMO.”
Bitcoin’s halving appears to be driving momentum at the moment and is only ten days away now.


