

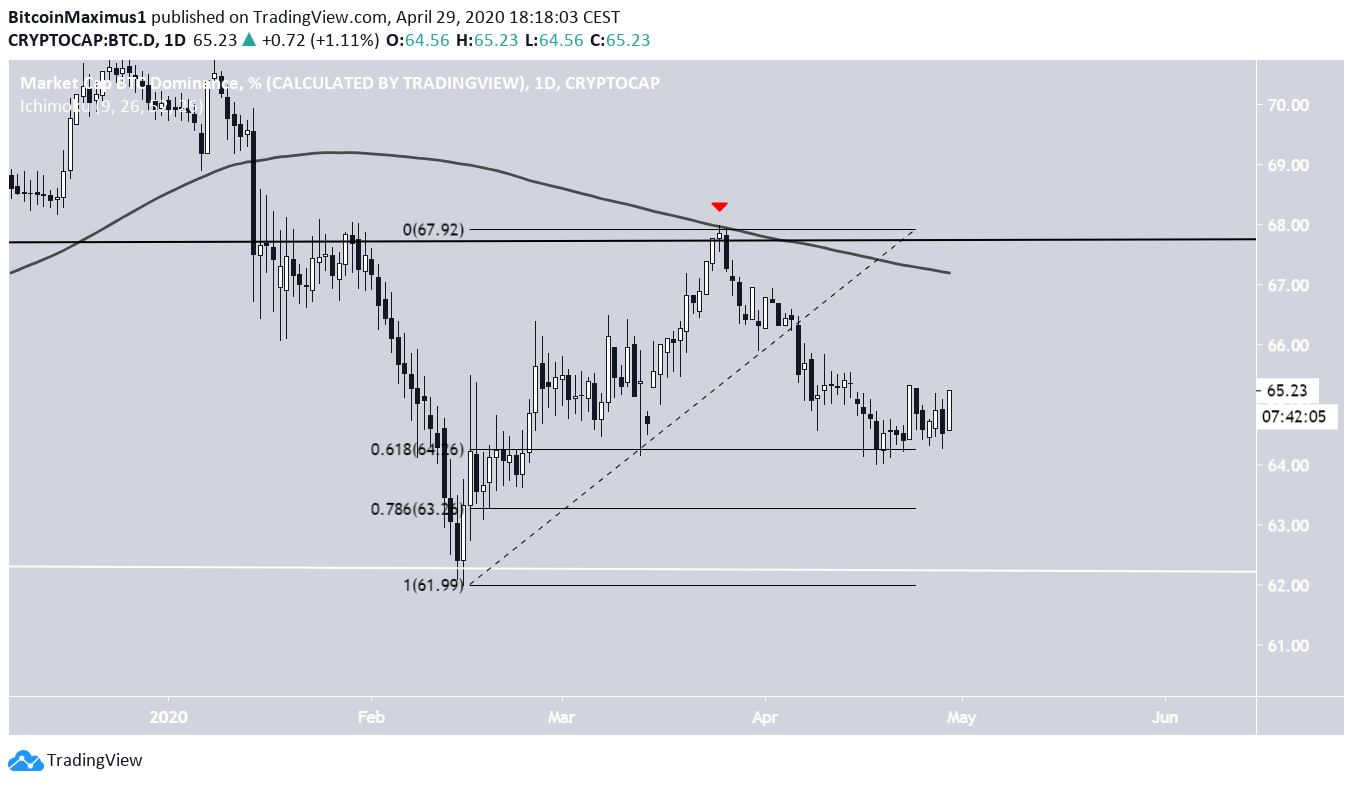
The Bitcoin dominance rate has been increasing since Feb. 15. Since then, it has been trading inside a neutral area between two trading ranges, with its future direction being still unclear.
Well-known cryptocurrency trader @Altcoinsherpa posted a long thread about the Bitcoin dominance rate (BTCD), eventually coming to the conclusion that June would be a good time to exit her altcoin positions.
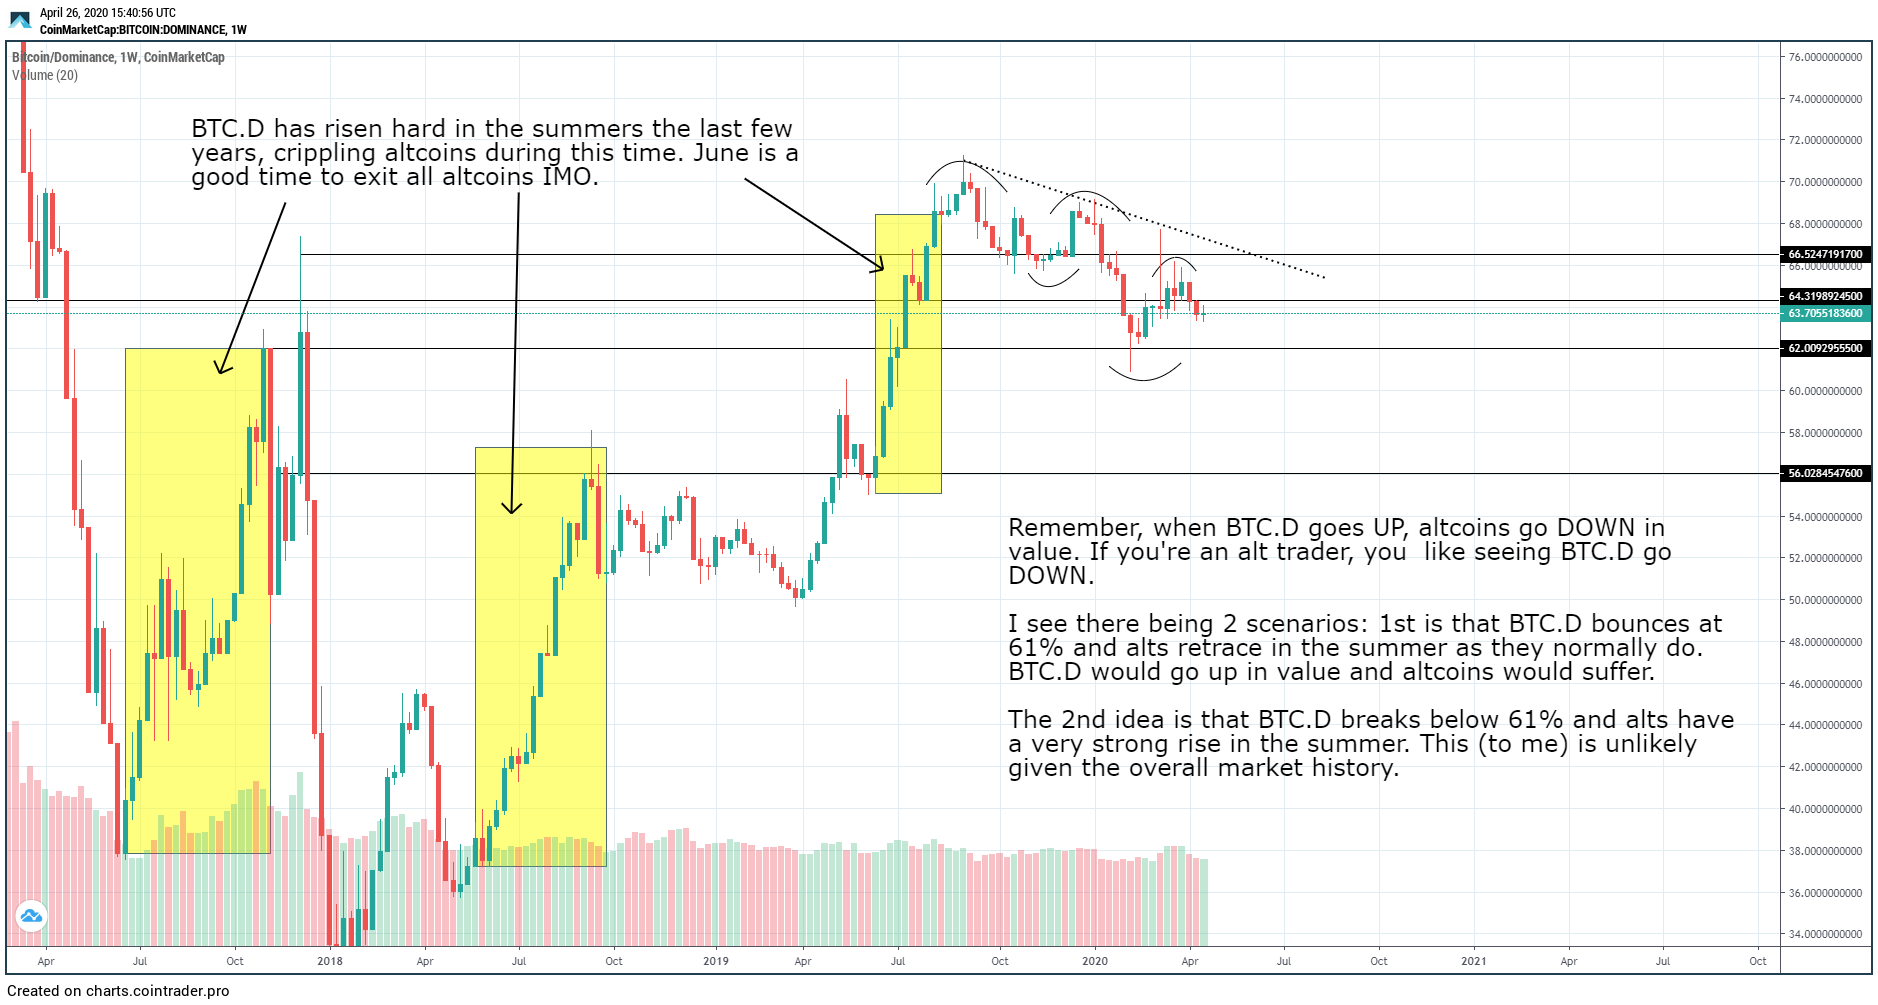
Where are we in the 2nd #altcoin pump cycle? How much longer do we have to trade $ALTS? What is the typical market history like? As alt traders, we must be aware of the conditions and environment that are strong for trading alts (namely alt/btc pairs).In this article, we will take a closer look at the Bitcoin dominance rate in order to determine where it is heading to next and the effect on alt/btc pairs.
Range Movement
A look at the three-day chart for the BTCD shows two trading ranges, which in the image below are shown in black and white lines, respectively. The narrower trading range (white) is found between 52.5-62.5%, while the broader range (black) is found between 39.5-69.5%. On Feb. 15, the price reached the resistance line of the narrower range at 62.5%. This low was combined with the lowest RSI value since 2017, deep into oversold territory, indicative that the price is close to reaching a bottom. Shortly after, an upward move followed. However, the price failed to breach the 68.5% area, which is the resistance line of the broader range. Therefore, there are two possibilities. If the price breaks out above 68.5%, it is likely to continue increasing and initiate a new upward move, since that would entail a breakout above the long-term range. On the other hand, a drop below 62.5% would likely initiate a drop towards support at 52.5%.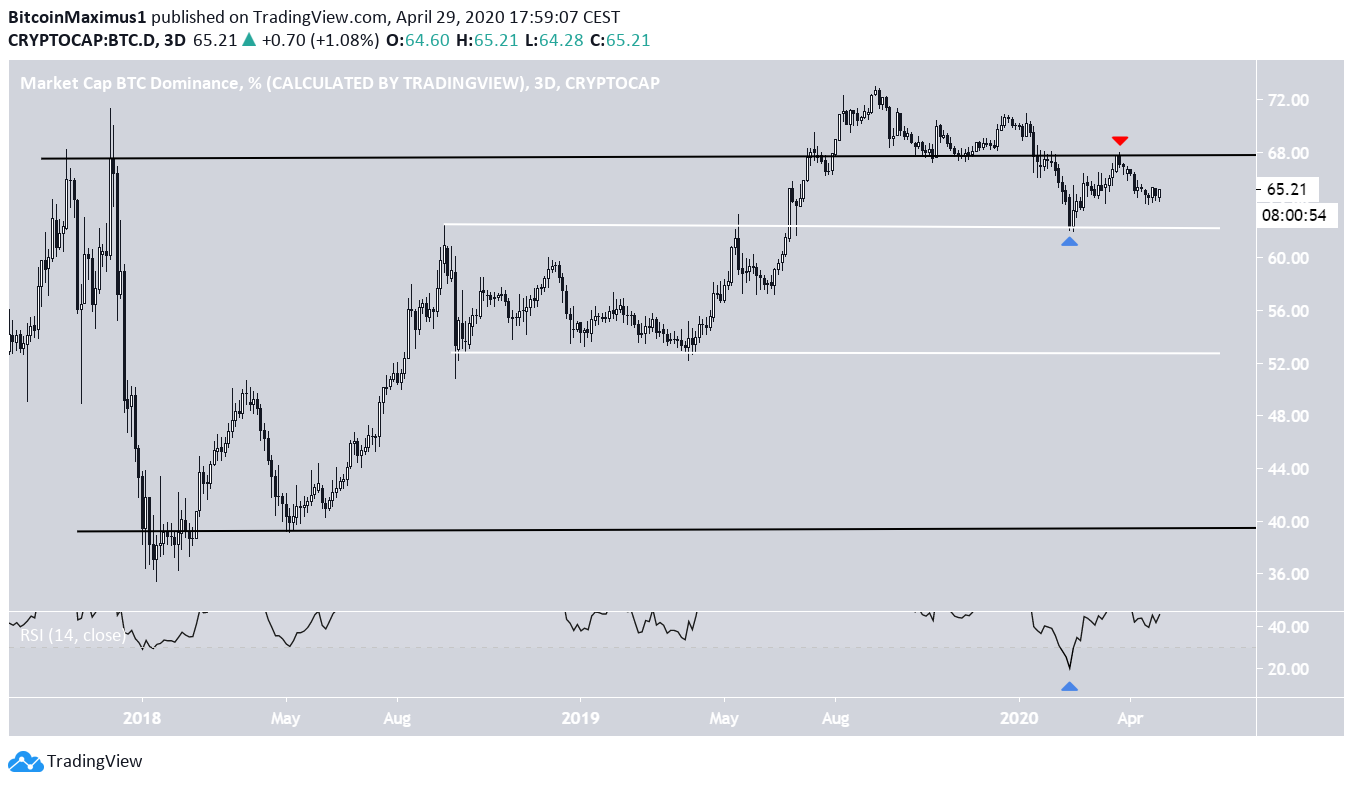
Long-Term Movement
The tweet states that June would be a good time to close alt/btc positions. Interestingly, the BTCD has increased for at least 35 days in June 2017, 2018 and 2019. This along with the analysis from the previous section aligns with the hypothesis that alt/btc pairs will decrease soon. However, the BTCD has broken down below a long-term ascending support line, a sign that the upward trend might be over. Therefore, there are several conflicting signs about the direction of the next move. Until the price moves outside of the neutral 62.5-68.5% area, the direction of the future movement is unclear.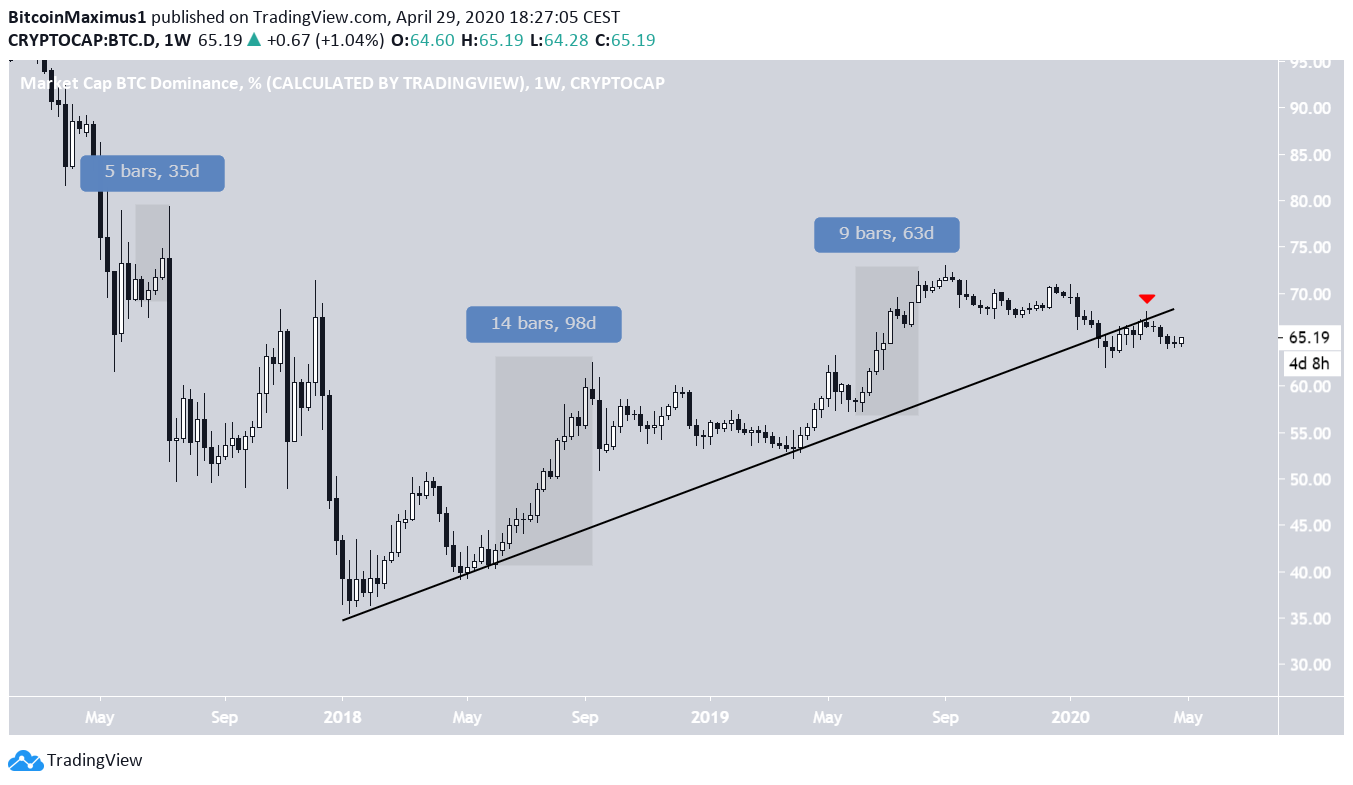
Disclaimer
In line with the Trust Project guidelines, this price analysis article is for informational purposes only and should not be considered financial or investment advice. BeInCrypto is committed to accurate, unbiased reporting, but market conditions are subject to change without notice. Always conduct your own research and consult with a professional before making any financial decisions. Please note that our Terms and Conditions, Privacy Policy, and Disclaimers have been updated.

Valdrin Tahiri
Valdrin discovered cryptocurrencies while he was getting his MSc in Financial Markets from the Barcelona School of Economics. Shortly after graduating, he began writing for several different cryptocurrency related websites as a freelancer before eventually taking on the role of BeInCrypto's Senior Analyst.
(I do not have a discord and will not contact you first there. Beware of scammers)
READ FULL BIO
Sponsored
Sponsored