

The Bitcoin Dominance Rate (BTCD) has reached a significant support area. Despite a potentially bearish trend, it’s expected to bounce at one of the support areas presented below.
Due to the decreasing Bitcoin dominance, the Altcoin Perpetual Index (ALTPERP) is expected to break out above the current $1,700 resistance area.
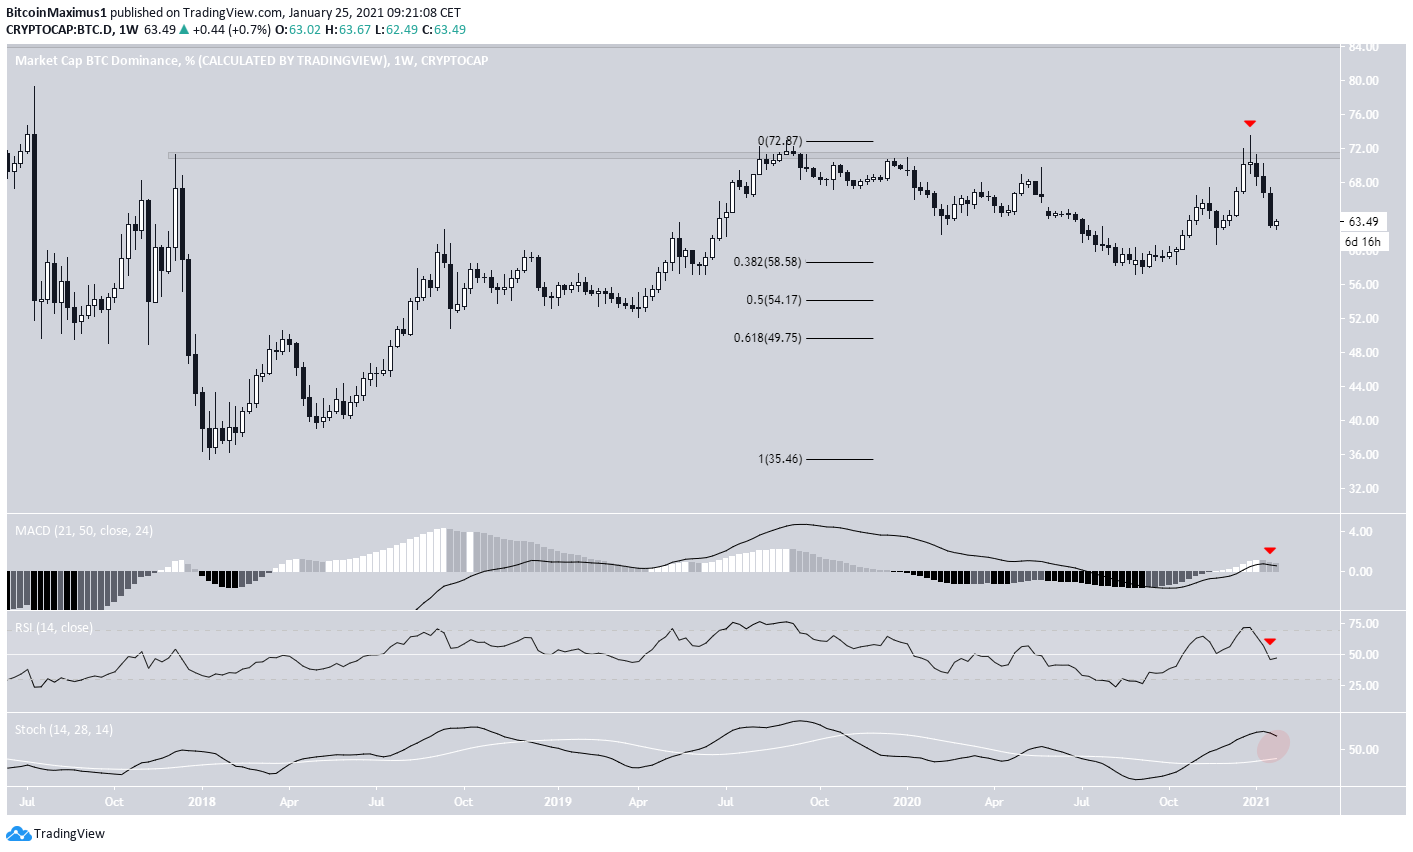
Bitcoin Dominance Long-Term Rejection
BTCD has been moving downwards since being rejected by the 71.5% resistance area in January 2021. The rejection had tremendous significance due to the fact that BTCD had not been above this level since July 2017.
While technical indicators are gradually turning bearish, they have not confirmed a bearish trend reversal yet.
If the BTCD were to continue decreasing in the long-term, the closest support areas would be found at 58.5%, 54%, and 50%.
Future Movement
Cryptocurrency trader @TheEWguy outlined a Bitcoin dominance chart and stated that he expects it to continue falling toward 63%.
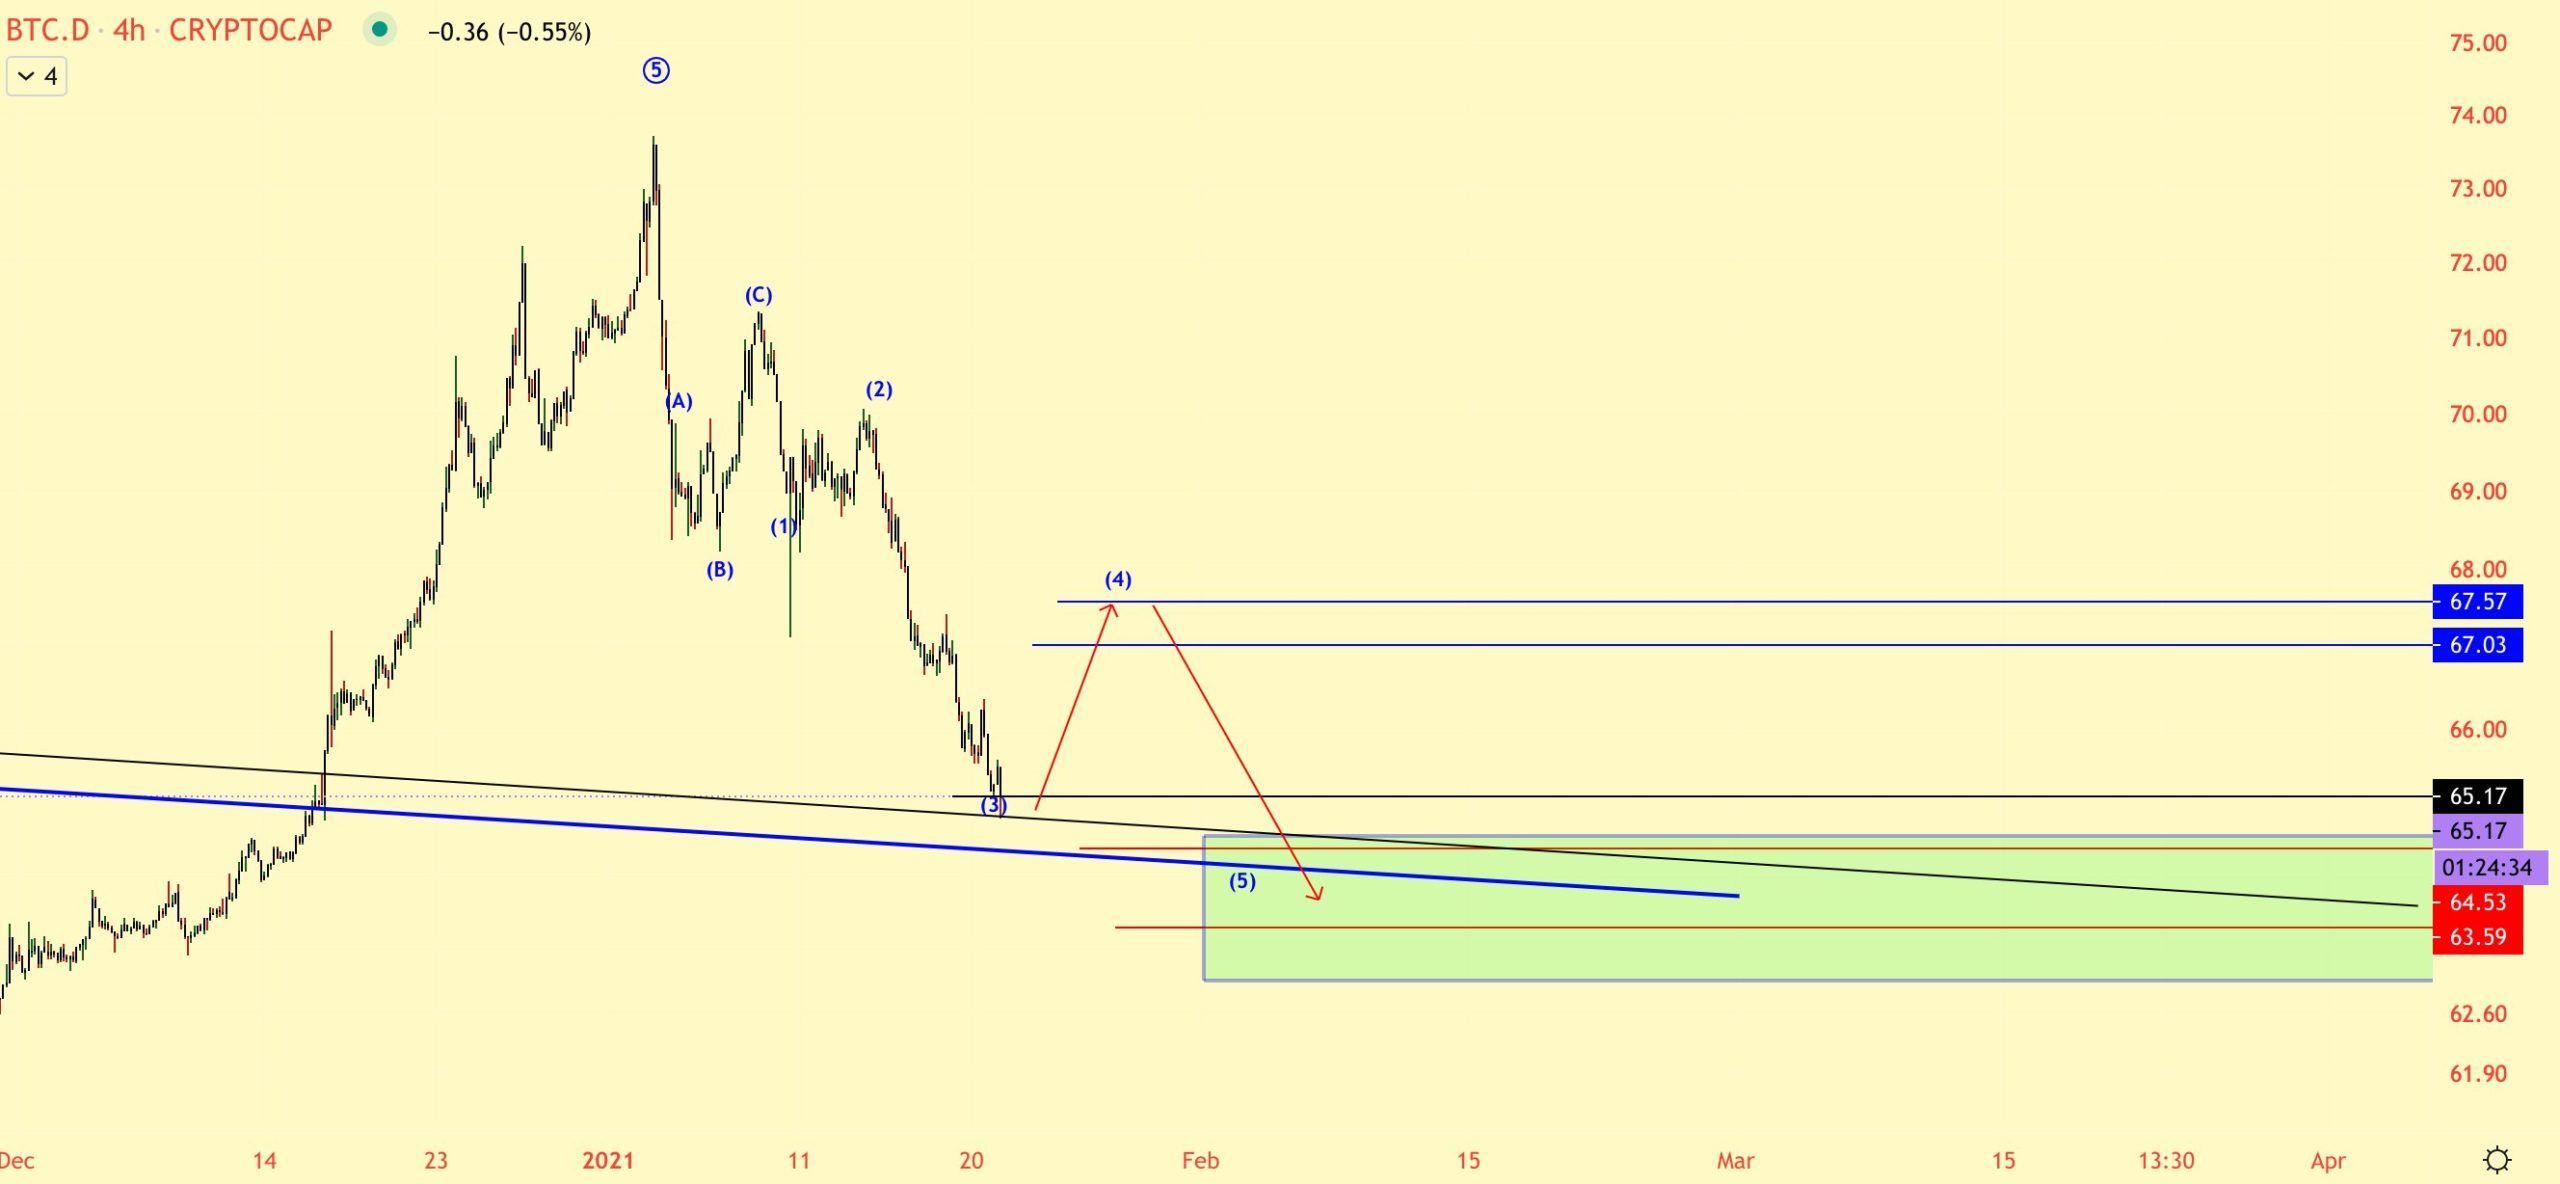
BTCD has been falling since the tweet and reached the 63% level on Jan. 25.
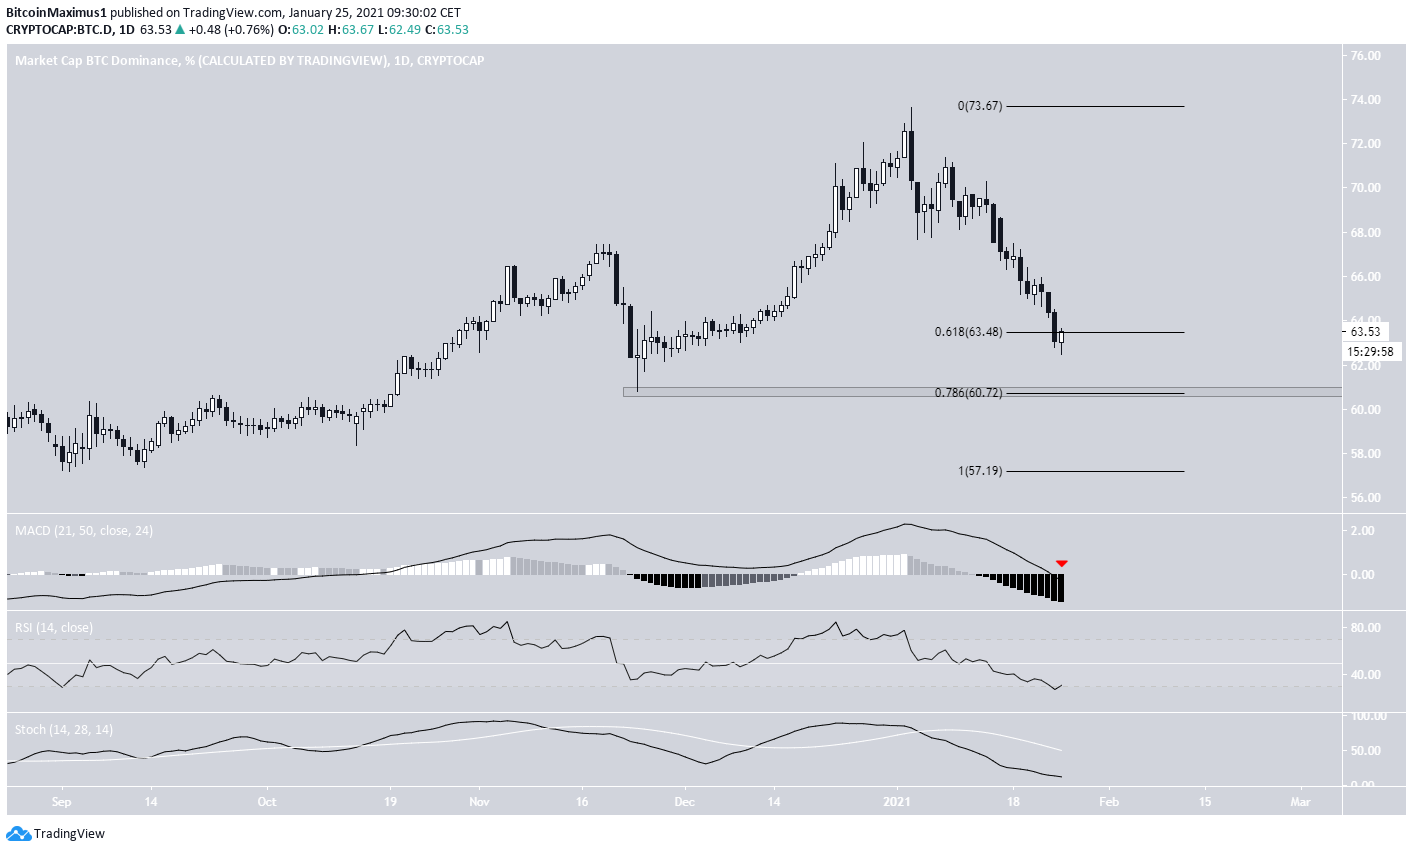
The daily chart shows even more bearish technical indicators. The MACD, RSI, and Stochastic oscillator are all moving downwards.
Furthermore, the MACD has crossed into negative territory and the RSI has just crossed below 30.
Nevertheless, the BTCD has just reached the 0.618 Fib retracement level, which very commonly initiates either trend reversals or bounces. The next support is found at 60.72%.
Therefore, even if the BTCD trend is bearish, a short-term bounce is expected near the current levels.
Relationship to BTC
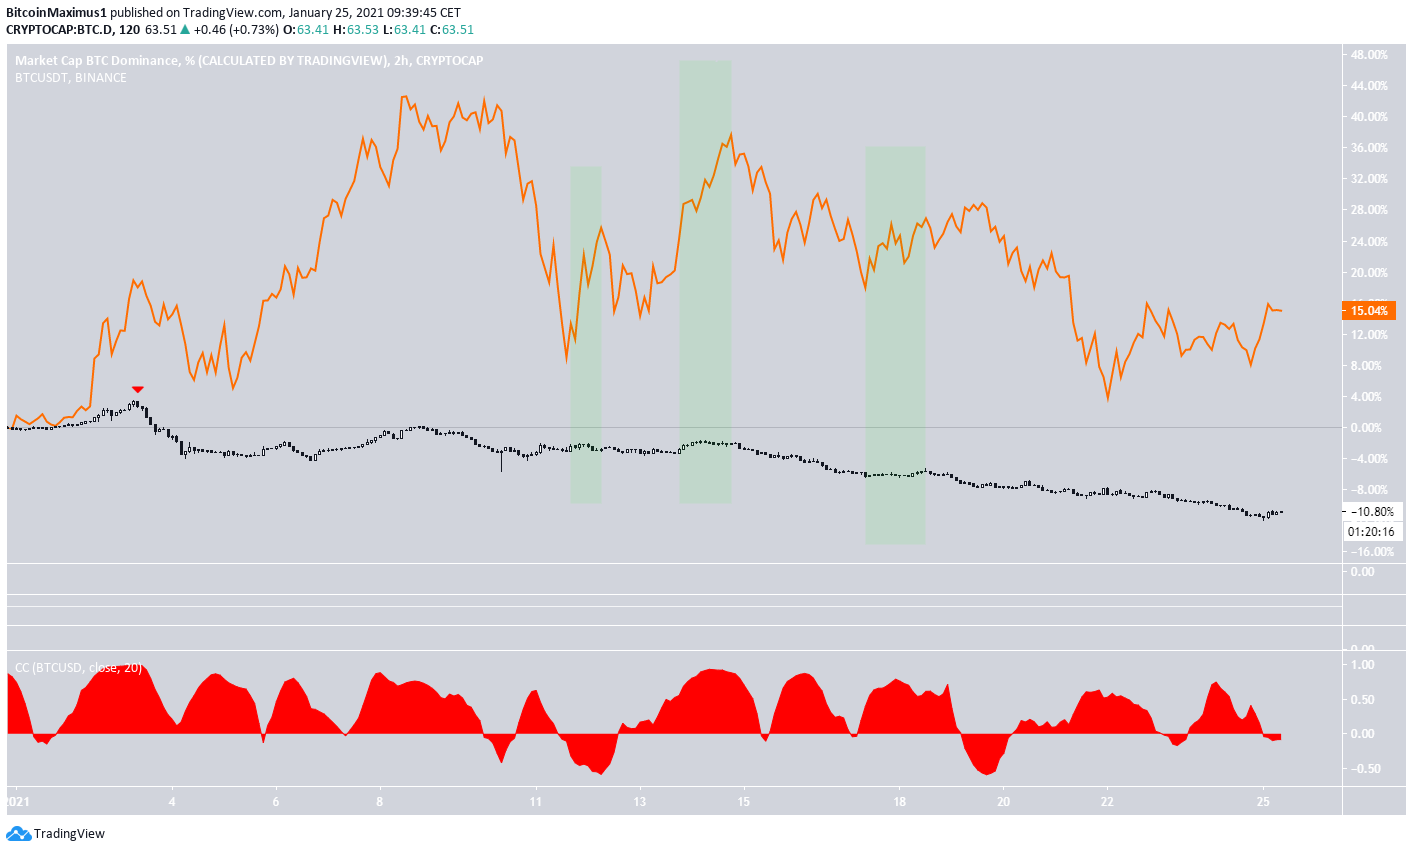
The BTC price (orange) and BTCD (candlesticks) are shown in the chart below.
Since the aforementioned high on Jan. 3. the BTC price and BTCD have had a positive correlation. This is visible in the Correlation coefficient, which shows values very close to one the majority of the time, implying a nearly perfect positive correlation.
Therefore, if the BTC price increase were to occur, it would likely cause an increase in BTCD.
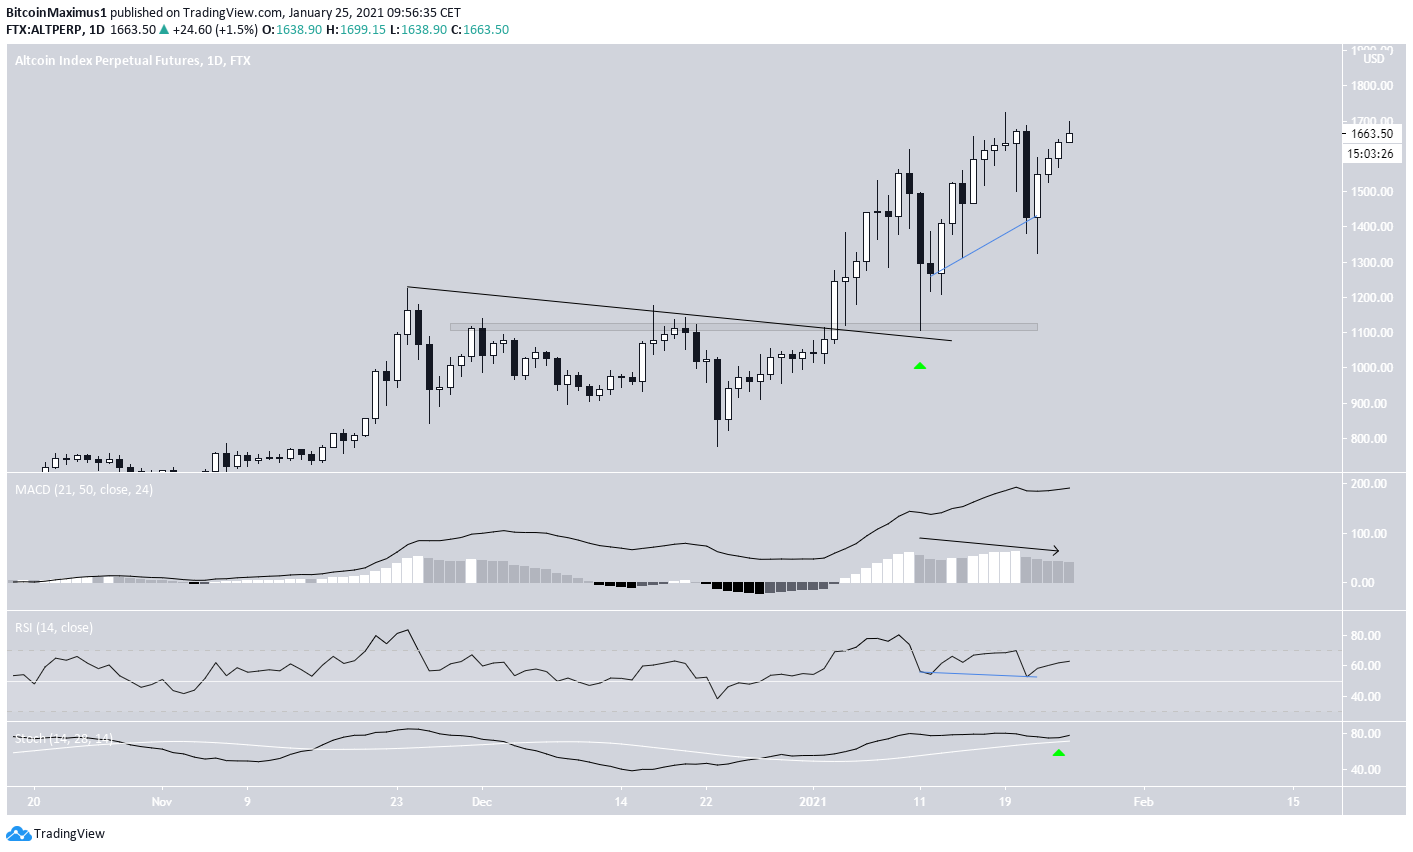
Altcoin Index
The Altcoin Index (ALTPERP) has been moving upwards since breaking out from and validating the previous descending resistance line as support.
While another drop occurred on Jan. 21, preceded by bearish divergence in the MACD, the RSI generated a significant hidden bullish divergence after. The ALTPERP has been increasing since.
The Stochastic oscillator has also made a bullish cross and is increasing, suggesting that the trend is bullish.
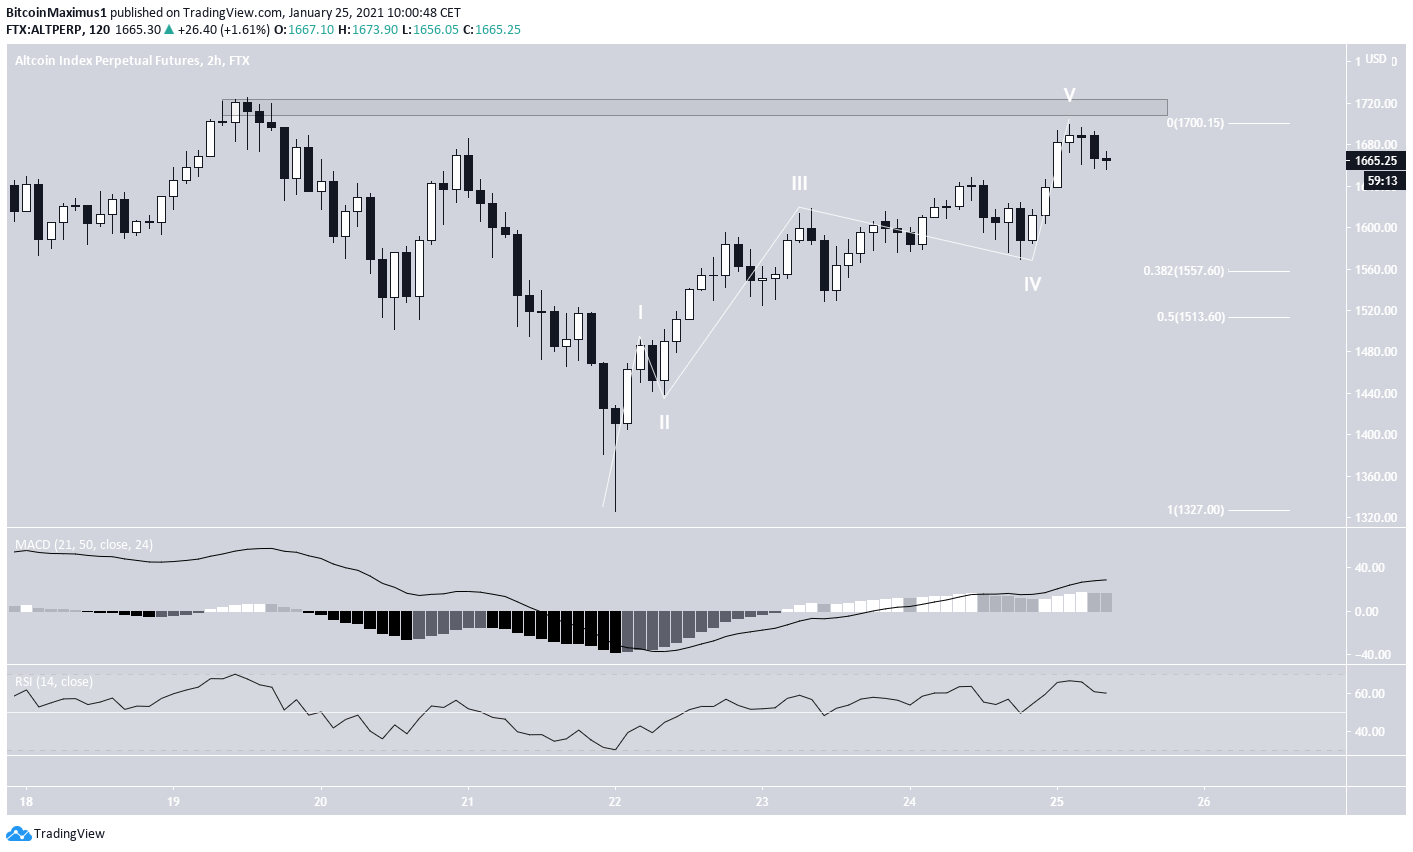
The two-hour chart also suggests that a breakout is likely.
The move of the lows seems impulsive and technical indicators are also bullish.
Even if a short-term drop were to occur, there is strong support at $1,557 and $1,513, (0.382-0.5 Fib retracement levels).
The rate of increase would be expected to accelerate above $1,700.
Conclusion
Bitcoin dominance is expected to bounce at one of the support areas found at 63.5% or 60.70%. The Altcoin Index (ALTPERP) is also expected to break out above the current $1,700 resistance area.
For BeInCrypto’s latest Bitcoin (BTC) analysis, click here!
Trusted
Disclaimer
In line with the Trust Project guidelines, this price analysis article is for informational purposes only and should not be considered financial or investment advice. BeInCrypto is committed to accurate, unbiased reporting, but market conditions are subject to change without notice. Always conduct your own research and consult with a professional before making any financial decisions. Please note that our Terms and Conditions, Privacy Policy, and Disclaimers have been updated.
